Title
Simultaneous Determination of Fe(III) and Fe(II) Ions via
Complexation with Salicylic Acid and 1,10-Phenanthroline in
Microcolumn Ion Chromatography( 本文(Fulltext) )
Author(s)
OKTAVIA, Budhi; LIM, Lee Wah; TAKEUCHI, Toyohide
Citation
[Analytical Sciences] vol.[24] no.[11] p.[1487]-[1492]
Issue Date
2008-11
Rights
The Japan Society for Analytical Chemistry (社団法人日本分析
化学会)
Version
出版社版 (publisher version) postprint
URL
http://hdl.handle.net/20.500.12099/33445
2008 © The Japan Society for Analytical Chemistry
Introduction
Determination of iron in analytical chemistry has become a routine procedure because of its importance in our life. There are many techniques reported for determination of iron in the literature:1–14 colorimetry,1 ICP,2 atomic absorption
spectrometry3–5 and chromatography.8–13 Most of the methods
are based on determination of one form of the iron and/or the total iron.1–8 Saitoh and Oikawa reported determination of Fe(II)
and Fe(III) by ion chromatography, where Fe(III) was reduced to Fe(II) by ascorbic acid.10 Moses et al. reported determination
of Fe(III) and Fe(II), but in determination of Fe(III) some interference occurred when Fe(II) was present.11 Determination
of various forms of the same element (speciation) is a worthwhile task in analytical chemistry due to the importance of environmental analysis and the need for understanding of fundamental biochemical reactions.13
The use of a complexing reagent to determine heavy metal ions in chromatographic separation is very popular. 8-Hydroxy-quinoline (or oxine) and its derivatives have been well studied for the solvent extraction of metal ions.7,8,15–20 Other examples
involve bis-2-ethylhexyl succinamic acid for lanthanides,21
1,5-diphenylcarbazide for Cr(VI) and/or Cr(III) after its oxidation to Cr(VI),22,23 1,10-phenanthroline (abbreviated as Phen in the
complex) for Fe(II) and/or Fe(III) after its reduction to Fe(II),1,23,24 precipitation of salicylic acid (abbreviated as SA in
the complex) by Fe(III),25 and dimethylglyoxime for Ni(II).1
In this paper, Fe(III) and Fe(II) were separated and determined
via in-column and post-column reaction with salicylic acid and 1,10-phenanthroline as eluent and complexing reagent. Fe(III) and salicylic acid form a violet-colored complex which is stable
for 2 – 3 days in the pH range 2.5 – 2.7. On the other hand, 1,10-phenanthroline forms a complex with Fe(II) in the pH range 2 – 9. The color of the complex Fe(II)-Phen is orange-red and the material is stable for 6 months or longer.1
The aim of this work is to establish the most suitable conditions for routine determination of Fe(III) and Fe(II) in a single chromatographic run. The proposed method was successfully applied to determination of Fe(III), Fe(II) and total Fe in real water samples.
Experimental
Reagents and standards
The reagents employed were of guaranteed reagent grade and were obtained from Wako (Osaka, Japan), unless otherwise noted. Purified water was produced in the laboratory by using a GS-590 water distillation system (Advantec, Tokyo, Japan). The standard solution of metal cations were prepared by dissolving FeCl3·6H2O and FeCl2·4H2O in 10 mM hydrochloric acid. The
eluent and the post-column reagent solution were prepared by dissolving salicylic acid and 1,10-phenanthroline in ethanol and water. All standard solutions were stored in polyethylene containers and kept under refrigeration at 4˚C. Ethanol was used as the eluent modifier.
The eluents were degassed under a vacuum using an ultrasonic vibration bath before use.
Apparatus
Microcolumn ion chromatography. A microcolumn ion chromatograph was constructed from two MF-2 Microfeeders (Azumadenki Kogyo, Tokyo, Japan) equipped with one MS-GAN 050 gas-tight syringe (0.5 mL; Ito, Fuji, Japan) each, a Model 7520 injector (Rheodyne, Cotati, CA), and a UV-2070 UV-Vis detector (Jasco, Tokyo, Japan). The injection volume
Simultaneous Determination of Fe(III) and Fe(II) Ions via
Complexation with Salicylic Acid and 1,10-Phenanthroline in
Microcolumn Ion Chromatography
Budhi O
KTAVIA, Lee Wah L
IM, and Toyohide T
AKEUCHI†Department of Chemistry, Faculty of Engineering, Gifu University, 1-1 Yanagido, Gifu 501–1193, Japan
Fe(III) and Fe(II) ions were separated and determined via in-column and post-column reactions with salicylic acid and 1,10-phenanthroline by microcolumn ion chromatography with UV-Vis detection. The separation could be achieved on a silica microcolumn using an aqueous ethanol solution of salicylic acid as eluent. The effluent from the column was then mixed with aqueous ethanol solution of 1,10-phenanthroline and detected at 518 nm. Fe(III) ion was detected as the complex with salicylic acid, whereas Fe(II) ion was detected as the complex with 1,10-phenanthroline. The detection limits with 0.25 mL injection volume at S/N = 3 were 0.21 and 0.10 mg L–1 for Fe(III) and Fe(II), respectively. Increasing
the injection volume of sample, e.g., 5.1 mL, improved the sensitivity; the detection limits at S/N = 3 were 12 and 9.2 mg L–1 for Fe(III) and Fe(II), respectively. The present system was applied to the determination of iron in a local well
water sample.
(Received July 18, 2008; Accepted September 3, 2008; Published November 10, 2008)
† To whom correspondence should be addressed. E-mail: [email protected]
1488 ANALYTICAL SCIENCES NOVEMBER 2008, VOL. 24
was determined to be 0.25 mL by collecting loaded sodium nitrate solution, followed by measurements of UV absorbance. The flow rate for the eluent/complexing reagent 1 (150 mM salicylic acid in 40% ethanol), was kept at 4.2 mL min–1 and that
for the complexing reagent 2 (20 mM 1,10-phenanthroline in 50% ethanol) was kept at 1.0 mL min–1. The UV-Vis detector
was operated at 518 nm, and the data were acquired using a Chromatopac C-R7Ae data processor (Shimadzu, Kyoto, Japan).
UV spectrophotometry. A U-3500 UV spectrophotometer (Hitachi, Tokyo, Japan) was used to determine maximum wavelengths for Fe(III)-SA and Fe(II)-Phen complexes. Complexes of Fe(III)-SA came from 0.26 mM Fe(III) reacted with 150 mM salicylic acid (in 40% ethanol) and complexes of Fe(II)-Phen came from 0.06 mM Fe(II) reacted with 20 mM 1,10-phenanthroline (in 50% ethanol).
ICP-AES. A P-4010 ICP-AES (Hitachi, Japan) was used to determine concentrations of iron in water samples for crosschecks. ICP operation condition: power, 1.0 kW; plasma gas, 16 L/min; carrier gas, 0.7 L/min; auxiliary gas, 1.0 L/min; analytical line, 240.488 nm.
Procedures
Sample preparation and storage. Water samples were taken from a local well near Gifu University, Japan. One milliliter of 1 M hydrochloric acid was added per 10 mL sample to prevent hydrolysis of iron. The samples were stored in polyethylene containers, and then kept under refrigeration at 4˚C. The samples were filtrated before injection with a 0.45-mm membrane filter for ion chromatography (GL Sciences, Tokyo, Japan).
Column preparation. Fused-silica capillary (95 ¥ 0.32 mm i.d.) was packed with Develosil 30-5 (porous silica; Nomura Chemical, Seto, Japan) as separation column by using a slurry packing method previously reported,26 and then conditioned
with the eluent. The column was operated at room temperature. The mean pore diameter of the silica is 30 Å, while its mean particle diameter is 5 mm.
Results and Discussion
Optimum wavelength for iron complexes
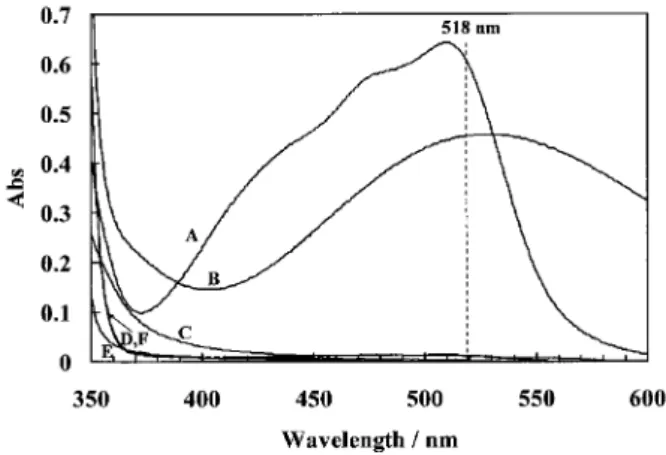
The typical spectra of Fe(III) and Fe(II) complexes with salicylic acid and 1,10-phenanthroline reagent are shown in Fig. 1. It should be noted that Fe(II)-Phen (A) and Fe(III)-SA (B) complexes have absorptions in the 400 – 600 nm range, whereas Fe(II)-SA and Fe(III)-Phen complexes do not have sufficient absorptions in the 400 – 600 nm range. The maximum wavelength for Fe(II)-Phen complex is 510 nm with absorbance of 0.642 and molar extinction coefficient of 1.1 ¥ 104 M–1 cm–1,
whereas that for Fe(III)-SA complex is 527 nm with absorbance of 0.458 and molar extinction coefficient of 1.8 ¥ 103 M–1 cm–1.
Figure 1 indicates that only Fe(III) forms a stable complex with salicylic acid (C7H6O3), whereas only Fe(II) forms a stable
complex with 1,10-phenanthroline (C12H8N2). The reaction
between Fe(II) with 1,10-phenanthroline1 is
Fe2+ + 3C12H8N2 æÆ [Fe(C12H8N2)3]2+ (1)
with a stability constant of 3.16 ¥ 1018 (25˚C).27
Then, reaction between Fe(III) with salicylic acid25 is
Fe3+ + 2C
7H6O3æÆ [Fe(C7H5O3)2]+ + 2H+ (2)
with a stability constant of 1.58 ¥ 1027 (25˚C).27
The wavelength should be optimized for simultaneous determination because of the small difference in the maximum wavelength for Fe(III) and Fe(II). For this purpose the wavelength 518 nm was chosen for the following experiments because that wavelength is the mean of the two maximum wavelengths for Fe(III)-SA and for Fe(II)-Phen complexes. At 518 nm Fe(III)-SA and Fe(II)-Phen complexes have molar extinction coefficients of 1.8 ¥ 103 and 1.1 ¥ 104 M–1 cm–1, respectively.
In addition, although the structure of Fe(III)-SA is shown as a positive iron by Eq. (2), its ionic structure has not been confirmed in the present work. Regarding the chromatographic retention of the Fe(III)-SA on silica, we expect that the complex may have a positive charge under the acidic conditions in the present paper, as discussed below.
In-column and post-column derivatization
The complex of Fe(III)-SA is formed while traveling in the separation column (in-column derivatization), whereas the complex of Fe(II)-Phen is formed via post-column reaction (post-column derivatization). Figure 2 shows the diagram of the
Fig. 1 Absorption spectra of Fe(II)-Phen complex (A: 0.06 mM Fe(II) with 20 mM 1,10-phenanthroline in 50% ethanol), Fe(III)-SA (B: 0.26 mM Fe(III) with 150 mM salicylic acid in 40% ethanol), Fe(II)-SA (C: 0.26 mM Fe(II) with 150 mM salicylic acid in 40% ethanol), Fe(III)-Phen (D: 0.06 mM Fe(III) with 20 mM 1,10-phenanthroline in 50% ethanol), 150 mM salicylic acid in 40% ethanol (E), and 20 mM 1,10-phenanthroline in 50% ethanol (F).
instrument for this method. Silica can act as a cation exchanger by using weak acid (pH 2 to 9) as the eluent. Salicylic acid in 40% ethanol was supplied from micropump 1 not only as the eluent but also as the complexing reagent for Fe(III). On the other hand, 1,10-phenanthroline in 50% ethanol was supplied from micropump 2 for post-column reaction for Fe(II). Complexation was influenced by pH of these solutions (apparent pH of 150 mM salicylic acid in 40% ethanol and 1,10-phenanthroline in 50% ethanol employed in this research was 2.29 and 8.20, respectively) and the composition of the complexing reagents. The concentrations of salicylic acid and ethanol were important criteria and were investigated.
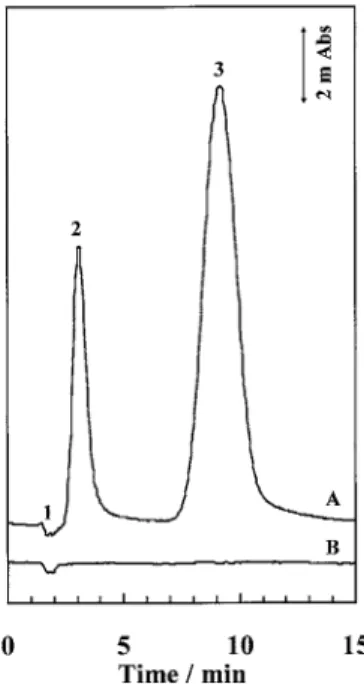
Figure 3 shows chromatograms for standard and blank solutions. The standard solution was prepared in 10 mM hydrochloric acid and the concentrations of Fe(III) and Fe(II) were 25 mg mL–1 each. The blank solution was 10 mM
hydrochloric acid. It can be seen that Fe(III) and Fe(II) are completely separated within 15 min. The retention of the analytes on the column depends on their ionic charge. It is expected that Fe(III) forms a charged complex of [Fe(C7H5O3)2]+
on the separation column, whereas Fe(II) travels without forming a complex in the column and forms a positive-charge complex with 1,10-phenthroline after elution from the column. Silica gel acts as a cation exchanger to separate [Fe(C7H5O3)2]+
and Fe2+.
Effect of stationary phase of microcolumn on the retention of iron complexes
Figure 4 shows the chromatograms of standard Fe(III)-SA and Fe(II)-Phen on different stationary phases. Column A (95 ¥ 0.32 mm i.d.) was packed with Develosil 30-5, column B (100 ¥ 0.32 mm i.d.) was packed with TSKgel Super IC-Cation (Tosoh, Tokyo, Japan) and column C (100 ¥ 0.32 mm i.d.) was packed with TSKgel IC-Cation-SW 5 mm (Tosoh, Japan). As described
above, if silica was used as stationary phase, Fe(III) and Fe(II) could be completely separated from each other, but not when TSKgel Super IC-Cation and TSKgel IC-Cation-SW were used. For TSKgel Super IC-Cation, Fe(II) was eluted before Fe(III)-SA complex and the two peaks overlapped each other. Super IC-Cation consists of carboxylic groups and the retention of Fe(II) decreased with decreasing pH. As for the TSKgel IC-Cation-SW column, Fe(III) and Fe(II) were not detected within 90 min. In other words, Fe(III) and Fe(II) were strongly retained on the IC-Cation-SW stationary phase that contains sulfonic groups as the cation-exchange site. Stronger acids, i.e., eluents with more H+, may be needed in order to elute these ions
for the IC-Cation-SW column.
Effect of eluent concentration on the retention of complexes
Eluent composition strongly affected the retention of the metal complexes. In order to obtain the optimum eluent condition, the concentrations of salicylic acid and ethanol in the eluent were varied. Figure 5 presents the retention behavior of Fe(III)-SA and Fe(II) on the silica gel microcolumn for different reagent concentrations. It can be seen that, when the concentration of salicylic acid increased, the retention time of the analytes decreased. This is a normal phenomenon because more H+
exists in higher-concentration eluent, leading to faster elution of the analytes.
Figure 6 shows effects of ethanol concentration in the eluent on the retention of the analytes. When the concentration of ethanol increased, the retention time of the analytes increased. This is because the driving force of the eluent based on cation exchange decreases with increasing ethanol concentration. Ethanol is required for dissolving high concentrations of salicylic acid. The concentration of salicylic acid around 150 mM and that of ethanol around 40% were chosen for the following experiment, because these conditions achieved complete separation of Fe(III)-SA and Fe(II) within a reasonable
Fig. 3 Chromatograms of standard (Fe(III)-SA, Fe(II)-Phen) and blank. Column, Develosil 30-5 (95 ¥ 0.32 mm i.d.); flow rate, 150 mM salicylic acid in 40% ethanol = 4.2 mL min–1, 20 mM 1,10-phenanthroline in 50% ethanol = 1.0 mL min–1; injection volume, 0.25 mL; wavelength of detection, 518 nm. Peaks: 1, system peak; 2, Fe(III)-SA complex; 3, Fe(II)-Phen complex. Samples: A, standard 25 mg mL–1 Fe(III) and Fe(II); B, blank.
Fig. 4 Chromatograms of Fe(III)-SA and Fe(II)-Phen on different stationary phases. Operating conditions are the same as in Fig. 3. Stationary phases for microcolumns: A, silica; B, TSKgel Super IC-Cation; C, TSKgel IC-Cation-SW.
1490 ANALYTICAL SCIENCES NOVEMBER 2008, VOL. 24
time. When the concentration of ethanol was less than 40%, salicylic acid was deposited in the column and the column became clogged.
Calibration curve
The linearity of calibration for Fe(III) and Fe(II) was studied, where the concentrations of Fe(III) and Fe(II) were varied from 2.5 to 50 mg mL–1 under the optimum operating condition as in
Fig. 3. The peak areas were linear to the Fe(III) concentration up to 50 mg mL–1 with a correlation factor (R2) of 0.9929 and
Fe(II) concentration up to 50 mg mL–1 with R2 of 0.9948.
The linearity of the standard additional method for real water samples has been also studied. The linear regressions for Fe(III) and for Fe(II) were y = (9.87 ¥ 103)x + 1.90 ¥ 104 with R2 of
0.9944 and y = (3.60 ¥ 103)x + 1.86 ¥ 106 with R2 of 0.9977,
respectively.
The operating condition for the determination of Fe(III) and Fe(II) in water samples was validated. Table 1 shows the repeatability of the retention time and the peak signals under the conditions in Fig. 3. The relative standard deviation (RSD) values for five successive measurements were less than 0.61% for retention time, whereas those for the peak height and peak area were less than 1.8%.
Effect of injection volume
In order to improve the sensitivity, we increased the injection
volume. A fused-silica capillary tube (102 ¥ 0.25 mm i.d.) was used as an injection volume loop, and it had a volume of 5.1 mL. The injection volume was determined to be 5.1 mL by collecting loaded sodium nitrate solution, followed by measurement of UV absorbance. When a 5.1-mL of sample was injected, the operating conditions are the same as for 0.25 mL injection. Under this condition, analyte ions are expected to be enriched on the top of the separation column.28
As for 5.1-mL injection, the peak areas were linear to the Fe(III) concentration up to 500 mg L–1 with R2 of 0.9949 and
Fe(II) concentration up to 500 mg L–1 with R2 of 0.9901.
The detection limits for Fe(III)-SA and for Fe(II)-Phen when the injection volume was 0.25 and 5.1 mL were determined. The detection limits under the former condition were 0.21 and 0.10 mg L–1 at S/N = 3, respectively, whereas under the latter
condition, the sensitivity of this on-column enrichment method were improved to be mg L–1 level, e.g., 12 and 9.2 mg L–1 for
Fe(III)-SA and Fe(II)-Phen, respectively. It should be noted that the peak widths were larger for 5.1-mL injection, although Fe(III)-SA and Fe(II) could be still completely separated.
Effect of foreign ions
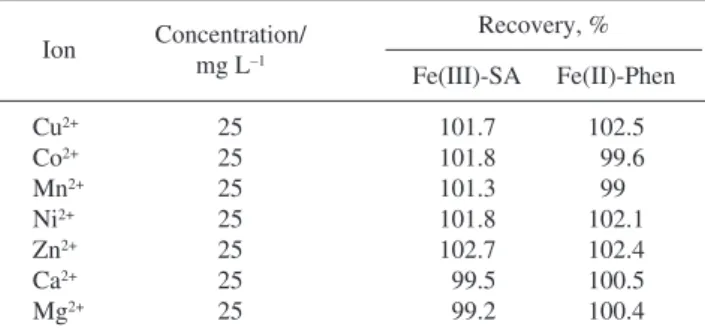
An extensive study was made on the effects of foreign ions on determination of iron species using the recommended procedure. Some transition metal ions (Cu2+, Co2+, Mn2+, Ni2+ and Zn2+) and
alkaline earth metal ions (Ca2+ and Mg2+) usually coexist in
environmental waters with Fe. These ions may interfere with the determination of Fe. Known quantities of the foreign ions (25 mg L–1) and Fe ions (each 25 mg L–1 for Fe(III) and Fe(II))
were prepared. As shown in Table 2, the cations examined did not interfere with the separation and determination of the iron species, and the recoveries of iron species were quantitative in the presence of other examined cations.
Application to real water sample
As an application to real water analysis, Fe(III) and Fe(II) contained in well water near Gifu University (Japan) were
Fig. 5 Effect of concentration of salicylic acid on the retention time. Operating conditions are the same as in Fig. 3 except for the eluents as indicated.
Fig. 6 Effect of concentration of ethanol in eluent on the retention time. Operating conditions are the same as in Fig. 3 except for the eluents as indicated.
Table 1 Relative standard deviation (RSD) of detector signal of iron complex Fe(III)-SA 25 0.61 1.8 1.7 Fe(II)-Phen 25 0.26 0.80 0.88 Complex Concentration of iron/mg L–1 RSD, % (n = 5) Retention time Peak area Peak heigh
Table 2 Effect of foreign ions on the recovery of iron speciesa
Ion Concentration/mg L–1 Recovery, %
Fe(III)-SA Fe(II)-Phen Cu2+ 25 101.7 102.5 Co2+ 25 101.8 99.6 Mn2+ 25 101.3 99 Ni2+ 25 101.8 102.1 Zn2+ 25 102.7 102.4 Ca2+ 25 99.5 100.5 Mg2+ 25 99.2 100.4
a. Sample solution (2 mL) containing 25 mg L–1 Fe(III), 25 mg L–1 Fe(II) and 25 mg L–1 foreign ions.
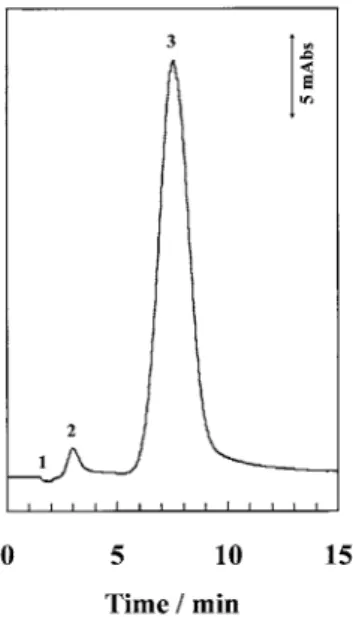
determined by the present system. This well water sample was chosen because the water seems clear to human eyes but it gives out an unpleasant smell. In 15 min after the sampling, the color of the water became brownish, and in 1 h later the bottom of the water became cloudy. Therefore, as soon as the water samples were taken, hydrochloric acid was added in the sample solution. As shown in Fig. 7, Fe(III) and Fe(II) in the real water sample could be separated without any difficulties. It can be seen that there were two peaks appeared from the well water sample at the same retention time as for the standard Fe(III)-SA and Fe(II)-Phen. Fe(II)-Phen peaks were broad, as demonstrated in the figure. Although the peak shape was improved by decreasing the injection volume, but 0.25 mL of the water samples were loaded in this work, considering the sensitivity achieved.
Table 3 shows the analytical results of Fe(III) and Fe(II) in the well water sample. These determination data were crosschecked with ICP-AES, and it is found that both data have no significant difference with probability 95% by student’s t-test, as shown in Table 3.
The concentration of Fe(II) in the water sample taken on 08-08-27 in Table 3 was also crosschecked with a spectrometric method using 1,10-phenanthroline as the complexation reagent. The concentration of Fe(II) measured with the ion chromatography method was (54.9 ± 0.4), whereas those obtained by the spectrometric method was (54.3 ± 0.3) with student’s t-test = 2.08, showing that there is no significant difference in between the two data.
Conclusion
Fe(III) and Fe(II) were successfully determined via complexation with salicylic acid and 1,10-phenanthroline using in-column and post-column reaction in microcolumn ion chromatography in a single chromatographic run. The analytes were directly injected without any extraction. The sensitivity could be improved by increasing injection volume, and mg L–1
levels of the detection limits were achieved. The present method provides simple routine determination of Fe(III) and Fe(II) in environmental waters without any difficulties.
References
1. E. B. Sandell, “Colorimetric Determination of Traces of
Metals”, 2nd ed., 1950, Interscience Publishers, Inc., New York.
2. J. de Jong, V. Schoemann, J.-L Tison, S. Becquevort, F. Masson, D. Lannuzel, J. Petit, L. Chou, D. Weis, and N. Mattielli, Anal. Chim. Acta, 2007, 589, 105.
3. Z. O. Tesfaldet, J. F. van Staden, and R. I. Stefan, Talanta, 2004, 64, 1189.
4. R. C. de C. Costa and A. N. Araújo, Anal. Chim. Acta, 2001, 438, 227.
5. E. K. Paleologos, D. L. Giokas, S. M. Tzouwara-Karayanni, and M. I. Karayannis, Anal. Chim. Acta, 2002, 458, 241. 6. S. Ohno, N. Teshima, H. Zhang, and T. Sakai, Talanta,
2003, 60, 1177.
7. G. C. Ragos, M. A. Demertzis, and P. B. Issopoulos, Il
Farmaco, 1998, 53, 611.
8. H. S. Amoli, A. Porgam, Z. B. Sadr, and F. Mohanazadeh,
J. Chromatogr., A, 2006, 1118, 82.
9. K. Ohta, K. Tanaka, B. Paull, and P. R. Haddad, J.
Chromatogr., A, 1997, 770, 219.
10. H. Saitoh and K. Oikawa, J. Chromatogr., A, 1985, 329, 247.
11. C. O. Moses, A. T. Herlihy, J. S. Herman, and A. L. Mills,
Talanta, 1988, 35, 15.
12. A. Atanassova, R. Lam, and D. B. Zamble, Anal. Biochem., 2004, 335, 103.
13. S. Oszwaldowski and A. Pikus, Talanta, 2002, 58, 773. 14. Z. L. Chen and R. Naidu, J. Chromatogr., A, 2004, 1023,
151.
15. T. Takeuchi, S. Inoue, M. Yamamoto, M. Tsuji, and T. Miwa, J. Chromatogr., A, 2001, 910, 373.
16. J. Stary`, Anal. Chim. Acta, 1963, 28, 132.
17. C. Mouralian, J. L. Buss, B. Stranix, J. Chin, and P. Ponka,
Biochem. Pharmacol., 2005, 71, 214.
18. A. R. Bowie, E. P. Achterberg, R. F. C. Mantoura, and P. J. Worsfold, Anal. Chim. Acta, 1998, 361, 189.
19. A. Laës, R. Vuillemin, B. Leilde, G. Sarthou, C.
Bournot-Fig. 7 Chromatogram of well water sample. Operating conditions are the same as in Fig. 3 except for the sample; sample, well water.
Table 3 Concentrations of Fe(III), Fe(II) and total Fe in well water samples
1 08-02-19 5.21 ± 0.004 50.6 ± 0.2 55.8 ± 0.2 56.3 ± 0.6 1.36
2 08-02-22 4.07 ± 0.05 49.9 ± 0.07 54.0 ± 0.1 54.8 ± 0.8 1.83
3 08-03-21 7.40 ± 0.07 49.7 ± 0.2 57.1 ± 0.2 57.3 ± 0.6 0.585
4 08-08-27 1.73 ± 0.04 54.9 ± 0.4 56.6 ± 0.3 56.8 ± 0.2 0.964
No. Date of sample IC method
a/mg L–1 (n = 3) ICP method/mg L–1 (n = 3)
Student’s t-test
Fe(III) Fe(II) Total Fe Total Fe
1492 ANALYTICAL SCIENCES NOVEMBER 2008, VOL. 24 Marec, and S. Blain, Mar. Chem., 2005, 97, 347.
20. Y.-S. Kim, J.-H. Shin, Y.-S. Choi, W. Lee, and Y.-I. Lee,
Microchem. J., 2001, 68, 99.
21. C. S. K. Raju, M. S. Subramanian, N. Sivaraman, T. G. Srinivasan, and P. R. V. Rao, J. Chromatogr., A, 2007, 1156, 340.
22. J. Weiss, “Ion Chromatography”, 2nd ed., 1995, VCH, Weinheim, New York, Basel, Cambridge, Tokyo.
23. M. Šikovec, M. Novib, V. Hudnic, and M. Franko, J.
Chromatogr., A, 1995, 706, 121.
24. J. Xu, P. Che, and Y. Ma, J. Chromatogr., A, 1996, 749, 287. 25. M. Rahni and B. Legube, Water Res., 1996, 30, 1149. 26. T. Takeuchi and D. Ishii, J. Chromatogr., A, 1981, 213, 25. 27. L. G. Silléen and A. E. Martel, “Stability Constants of
Metal-Ion Complexes”, 1971, Supplement No. 1, Special Publication 25, The Chemical Society, London.
28. L. W. Lim, J.-Y. Jin, and T. Takeuchi, Anal. Sci., 2003, 19, 447.