Title
Determination of Inorganic Anions in Natural Water by
Microcolumn Ion Chromatography with On-column Enrichment(
本文(Fulltext) )
Author(s)
LIM, Lee, Wah; JIN, Ji-Ye; TAKEUCHI, Toyohide
Citation
[Analytical sciences : the international journal of the Japan
Society for Analytical Chemistry] vol.[19] no.[3] p.[447]-[449]
Issue Date
2003-03-10
Rights
The Japan Society for Analytical Chemistry (日本分析化学会)
Version
出版社版 (publisher version) postprint
URL
http://hdl.handle.net/20.500.12099/28195
Introduction
Ion chromatography (IC) has been widely used in the determination of ionic species in drinking water, surface water, wastewater, etc. In most cases, the sample pretreatment involves only simple operations, such as filtration, protein precipitation, pH adjustment, dilution, and the extraction of the analytes. In some cases, the sample pretreatment can be difficult when the concentration of target ions in the sample is very low, or when the concentrations of the ionic matrix are too high relative to the analytes.
Sample pre-concentration has been widely employed in HPLC in order to achieve a high concentration sensitivity separation of analytes. Liu et al.1 proposed a simple sample
pre-concentration for the determination of trace levels of bromate and perchlorate in drinking water. The drinking-water sample was first treated with an Ag cartridge, and then concentrated 20-fold using a domestic microwave oven. A method for on-line pre-concentration and determination of Cr(VI) traces was developed by Padarauskas et al.2by using a C
18column (50 ×6
mm i.d.). The technique has been successfully applied to the determination of Cr(VI) traces in drinking water as well as surface and ground-water samples.
Efforts have also been made to inject large sample volumes3,4
in order to enhance the detection sensitivity. In these trials, the advantage of combining microcolumn LC and particle beam MS is that this allows the determination of acidic pesticides at very low concentrations. The sample volume that could be injected into a packed capillary column was increased by 800 times.4
Takeuchi and Ishii developed a precolumn concentration method in ultra-micro HPLC, and examined its application to trace analysis.5 It was proven that the precolumns, which were
about 1/10 to 3/10 of the length of the separation column, had shown a good enrichment efficiency in the separation of phthalates in water and corticosteroids in serum. The precolumn concentration method is a useful pretreatment in the
analysis of real samples by microcolumn LC, particularly in the analysis of biological samples,6,7 as well as for environmental
hormones analysis.8,9
Similarly, on-column enrichment is also performed in order to increase the sensitivity of detection. However, the on-column method is normally employed when using either gradient elution or a trap column, or when diluting the sample with a weak solvent. In these cases, it is common to inject large sample volumes in order to enhance the detection sensitivity.10
On the other hand, in the case of a simple isocratic mode, large injection volumes would produce a wide initial sample zone, and thus create a large precolumn dispersion that severely degrades the resolution.
Inorganic anions have a very close relation to environmental water. Lopez-Ruiz reviewed the advancement in the determination of inorganic anions by IC from 1997 to 1999.11
These topics include new sample pretreatments, new separation methods, new detection systems, and the latest applications in the fields of environment, water, food, etc. Bromate is a disinfection by-product of the ozonation of drinking water, and is classified as a carcinogen to humans at concentrations of more than 0.05 µg/L. Iodine species in seawater exist as iodide and iodate; the distribution of these species helps us to understand the marine environment. Nitrate and nitrite are naturally occurring ions that are part of the nitrogen cycle, and need to be monitored regularly due to their toxicity, especially in food products12,13 in which carcinogenic nitrosamines are
formed. Accurate and reliable method for the simultaneous determination of thiocyanate is crucial for studies in forensic science and clinical medicine.11
This paper describes the determination of six kinds of inorganic anions in water samples via on-column concentration in microcolumn IC. In this study, on-column enrichment was performed by injecting the whole amount of the sample into a separation column, in which the analytes were being concentrated and separated. Compared to the conventional micro-injector, the sample injection volume was increased by 50 fold. Thus, the determination of samples at low µg/L levels is possible.
447 ANALYTICAL SCIENCES MARCH 2003, VOL. 19
2003 © The Japan Society for Analytical Chemistry
Notes
Determination of Inorganic Anions in Natural Water by Microcolumn Ion
Chromatography with On-column Enrichment
Lee Wah L
IM,* Ji-Ye J
IN,** and Toyohide T
AKEUCHI*
†*Department of Chemistry, Faculty of Engineering, Gifu University, 1-1 Yanagido, Gifu 501–1193, Japan
**Instrumental Analysis Center, Gifu University, 1-1 Yanagido, Gifu 501–1193, Japan
An on-column enrichment method was developed for the rapid determination of inorganic anions in natural water. The system was assembled from a syringe pump, a six-port switching valve with a sample-enrichment loop, a separation column and a UV detector. The enrichment efficiency of the system was tested by using inorganic anions as samples. The limits of detection were between 0.6 and 7.7 µg/L. The system was applied to the determination of anions in river and pond-water samples.
(Received July 11, 2002; Accepted November 15, 2002)
†To whom correspondence should be addressed.
Experimental
Apparatus
The enrichment system was assembled from a syringe pump (MF-2 Microfeeder, Azumadenki Kogyo, Tokyo, Japan), an M435 micro injection valve (Upchurch Scientific, Oak Harbor, WA, USA), a laboratory-made anion-exchange separation column (100 ×0.32 mm i.d.), a 127 cm ×0.1 mm i.d. fused-silica capillary loop (10 µL; GL Sciences), and a 970 UV-Vis detector (Jasco, Tokyo, Japan). The eluent was supplied by a syringe pump equipped with an MS-GAN 050 gas-tight syringe (0.5 mL; Ito, Fuji, Japan). The M435 micro injection valve was used as the injection valve for sample enrichment. The flow-rate was kept at 4.2 µL min–1, while the detector was
operated at 210 nm. The data were collected by a C-R4AX Chromatopac processor (Shimadzu, Kyoto, Japan).
The laboratory-made separation column was prepared by using fused-silica tubing, as reported by Takeuchi and Ishii.14
The IC-Anion-SW column (5 µm; Tosoh, Tokyo, Japan) was operated in the anion-exchange mode with an ion-exchange capacity of ca. 0.40 mequiv g–1.15
Reagents
All of the reagents were obtained from Nacalai Tesque (Kyoto, Japan), and were used without any further treatment, unless otherwise noted. Purified water was produced in the laboratory using a GS-590 water-distillation system (ADVANTEC, Tokyo, Japan).
Enrichment unit
The enrichment unit, which consisted of an M-435 micro injection valve and a fused-silica capillary loop, had an injection volume of 10 µL. The whole volume of the sample was injected, and was moved by the eluent into the separation column, in which the analytes were being concentrated and separated. Figure 1 shows a diagram of the enrichment system.
Results and Discussion
Table 1 shows the signal intensities for six kinds of inorganic anions, i.e. iodate, bromate, nitrite, nitrate, iodide and thiocyanate. The present system is sensitive to the determination of nitrate and nitrite, as well as iodate. Although bromate, iodide and thiocyanate can also be detected, the sensitivities are less.
Figure 2 shows a chromatogram of an authentic mixture of iodate, bromate, nitrite, nitrate, iodide and thiocyanate. The average retention times for seven successive chromatographic runs were between 6.98 and 25.10 min with relative standard deviations (RSDs) of less than 0.60%. On the other hand, the RSDs of the peak area of all the analytes were less than 5%, except for bromate with 7.1%, whereas those of the peak height were between 0.90 and 3.4%.
Compared to other anions, bromate has relatively high RSD values for both the peak area and the peak height. It is also understood that the quantities of iodate and iodide would be reduced if the sample solution happened to be acidic. Thus, careful handling of the preparation and storing of the sample is crucial.
Table 2 gives the linear concentration ranges investigated and the resulting linear-regression coefficients (R-squares), along with the limits of detection (LOD) that were calculated at a
448 ANALYTICAL SCIENCES MARCH 2003, VOL. 19
Fig. 1 Diagram of the enrichment system.
Table 1 Comparison of the signal intensities for the inorganic anions; the operating conditions are as in Fig. 2
IO3– 10 4.51 56.2 BrO3– 10 1.51 18.8 NO2– 10 6.66 83.0 NO3– 10 8.02 100 I– 10 3.05 38.0 SCN– 10 1.32 16.5
Concentration/µM Peak height/10–3 Abs
Analyte Relative intensity
Table 2 Summarized data for the calibration graphs and the LODs; the operating conditions are as in Fig. 2, except for the sample concentration, as indicated
IO3– 0 – 8 0.9999 0.019 3.33 0 – 90 0.9933 BrO3– 0 – 5 0.9997 0.060 7.68 0 – 65 0.9996 NO2– 0 – 2 0.9999 0.014 0.64 0 – 25 0.9968 NO3– 0 – 2.5 0.9999 0.011 0.68 0 – 35 0.9896 I– 0 – 38 0.9936 0.029 3.68 SCN– 0 – 29 0.9835 0.067 3.89 LOD (S/N = 3) Analyte Concentration range, ppm R2
µM ppb
Fig. 2 Separation of the standard anions. Iodate (1), bromate (2), nitrite (3), nitrate (4), iodide (5) and thiocyanate (6). Column, IC-Anion-SW, 100 ×0.32 mm i.d. Mobile phase, 40 mM NaCl. Sample loop, fused silica, 1270 × 0.1 mm i.d. Flow-rate, 4.2 µL min–1.
Wavelength of UV detection, 210 nm. Sample, 10 µM of each prepared in purified water.
signal-to-noise ratio (S/N) equal to 3. At low sample concentrations, ranging from 0 to 8 ppm, the calibration graphs for iodate, bromate, nitrite and nitrate showed linear relationships between the peak height and the sample concentration. This can be seen from the good R-square values obtained at low sample concentration ranges. As for iodide and thiocyanate, the R-square values for the peak height versus the sample concentration plots were 0.9936 and 0.9835, while the concentration ranged from 0 to 29 ppm and 0 to 38 ppm, respectively. For bromate, it is noted that the peak height was linear to concentrations of up to 65 ppm. The LODs of iodate, bromate, nitrite, nitrate, iodide and thiocyanate were 3.3, 7.7, 0.6, 0.7, 3.7 and 3.9 ppb, respectively.
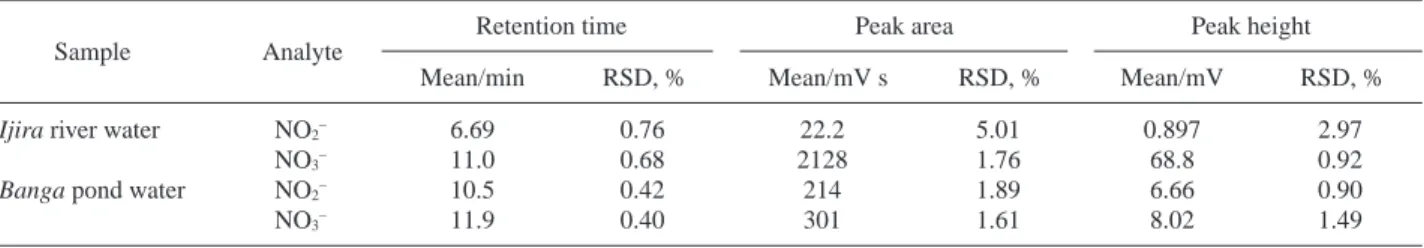
The present system could be applied to the determination of anions in river and pond-water samples. Figure 3 demonstrates the chromatogram for a pond-water sample. Only nitrite and nitrate were clearly identified in the sample. Six successive runs were carried out for the determination of anions contained in river and pond-water samples, limited to nitrite and nitrate ions. The repeatability results are given in Table 3.
The concentrations of nitrite and nitrate in river water, as calculated according to the peak height, were determined to be 70 ppb and 3.54 ppm, respectively. From these values, the river-water quality can be considered to be slightly polluted. As for the pond water, the nitrite and nitrate concentrations were determined to be 0.12 and 0.29 ppm, respectively.
Conclusions
In general, the enrichment method provides an acceptable
linearity; good retention times and peak-height precisions can be obtained. The system also allows the determination of anions at a low ng/mL level. Nitrite and nitrate in environmental water could be determined simultaneously, which shows the potential of the enrichment system as a pretreatment device in the analysis of real samples. There were no significant negative effects on the analytical data caused by either the sample loop or the switching valve. Thus, switching valves with a low dead volume could be applied to the capillary IC system as an alternative to the normal syringe-injection method. The easy set-up of the experiment apparatus has made this method very practical.
Acknowledgements
The authors gratefully acknowledge the Takeda Foundation for the financial support. One of the author (LWL) would like to thank Iwatani Foundation for the kind offer of a scholarship.
References
1. Y. Liu, S. Mou, and S. Heberling, J. Chromatogr. A, 2000, 956, 85.
2. A. Padarauskas, A. Jud entienè, E. Naujalis, and V. Paliulionytè, J. Chromatogr. A, 1998, 808, 193.
3. M. A. Rezai, G. Famiglini, and A. Cappiello, J. Chromatogr. A, 1996, 742, 69.
4. A. Cappiello, G. Famiglini, and A. Berloni, J. Chromatogr. A, 1997, 768, 215.
5. T. Takeuchi and D. Ishii, J. Chromatogr., 1981, 218, 199. 6. H. Terada, M. Asanoma, and Y. Sakabe, J. Chromatogr.,
1985, 318, 299.
7. H. W. Mueller and J. Eitel, J. Chromatogr. B, 1996, 678, 137.
8. T. Takeuchi, Y. Jin, and D. Ishii, J. Chromatogr., 1985, 321, 159.
9. L. Lim, T. Miwa, and T. Takeuchi, Anal. Sci., 2001, 17, i887.
10. M. D. Foster, M. A. Arnold, J. A. Nichols, and S. R. Bakalyar, J. Chromatogr. A, 2000, 869, 231.
11. B. López-Ruiz, J. Chromatogr. A, 2000, 881, 607.
12. D. C. Siu and A. Henshall, J. Chromatogr. A, 1998, 804, 157.
13. M. I. H. Helaleh and T. Korenaga, J. Chromatogr. B, 2000, 744, 433.
14. T. Takeuchi and D. Ishii, J. Chromatogr., 1981, 213, 25. 15. Safni, N. Ito, T. Takeuchi, and T. Miwa, J. Chromatogr. A,
1999, 864, 26.
ˇz
449 ANALYTICAL SCIENCES MARCH 2003, VOL. 19
Fig. 3 Detection of anions in the Banga pond-water sample. The operating condition was as in Fig. 2, except for the sample (10 µL of the Banga pond water).
Ijira river water NO2– 6.69 0.76 22.2 5.01 0.897 2.97
NO3– 11.0 0.68 2128 1.76 68.8 0.92
Banga pond water NO2– 10.5 0.42 214 1.89 6.66 0.90
NO3– 11.9 0.40 301 1.61 8.02 1.49
Sample Analyte
Retention time Peak area Peak height
Mean/min RSD, % Mean/mV s RSD, % Mean/mV RSD, % Table 3 Repeatability of the retention time and signals for six successive measurements for nitrite and nitrate in the Ijira river or Banga pond water samples; the operating conditions were as in Fig. 2, except for the sample (10 µL of the Ijira river water or Banga pond water)