Rapid and Simple Identification of Free
Magnesia in Steelmaking Slag Used for Road
Construction Using Cathodoluminescence
著者
Susumu Imashuku, Hiroki Tsuneda, Kazuaki
Wagatsuma
journal or
publication title
Metallurgical and materials transactions. B,
Process metallurgy and materials processing
science
volume
51
page range
27-34
year
2019-10-30
URL
http://hdl.handle.net/10097/00129616
doi: 10.1007/s11663-019-01724-8Rapid and Simple Identification of Free Magnesia in Steelmaking Slag Used for Road
1
Construction Using Cathodoluminescence
2 3
Susumu Imashuku*, Hiroki Tsuneda and Kazuaki Wagatsuma 4
5
Institute for Materials Research, Tohoku University, 2–1–1 Katahira, Aoba-ku, Sendai 980–
6
8577, Japan
7 8
*Corresponding author: Susumu Imashuku 9 E-mail: [email protected] 10 TEL: +81–22–215–2132 11 FAX: +81–22–215–2131 12 13 ABSTRACT 14
Reuse of steelmaking slags is important for the effective use of natural resources. Free 15
magnesia (f-MgO) in steelmaking slag may cause serious problems because of a hydration 16
reaction followed by expansion when it is reused for road construction. We present a promising 17
method to identify f-MgO that causes volume expansion rapidly by investigating 18
cathodoluminescence (CL) images and spectra of a steelmaking slag sample. f-MgO emitted 19
red–orange luminescence from a peak at 755 nm. The mineral phases, 3CaOSiO2 and
20
2CaOSiO2, emitted red and yellow luminescence from peaks at 720 nm and 590 nm,
21
respectively. No luminescence of FeO and 2CaOFe2O3 was detected. f-MgO changed its
22
composition in the slag sample that was immersed in hot (70 °C) water for a week. f-MgO that 23
was responsible for the volume expansion (combined content of FeO and MnO below 30 24
mass%) retained a red–orange luminescence, whereas the other f-MgO lost luminescence. The 25
CL intensity of the f-MgO that retained luminescence was more than 10 times larger than that 26
of 3CaOSiO2 and 2CaOSiO2. Therefore, we can distinguish f-MgO that causes volume
27
expansion by detecting the intense red–orange luminescence from the peak at 755 nm in the CL 28
image within a few seconds. 29
I. INTRODUCTION
30
The reuse of by-products and/or industrial wastes has been tackled aggressively in 31
various manufacturing industries globally to realize an improved sustainability.[1,2] Huge 32
amounts of steelmaking slag, which is a byproduct from the conversion of carbon-rich molten 33
iron to steel in basic oxygen and an electric arc furnaces, are produced globally. The reuse rate 34
of steelmaking slag is close to 100% in developed countries such as USA, Japan, Germany, and 35
France,[3,4] where almost half of the reused steelmaking slag has been used in road constructions,
36
such as road base and asphaltic concrete.[1,3-6] Steelmaking slag contains free lime (f-CaO) and 37
free magnesia (f-MgO) that can result in volumetric instabilities because f-CaO and f-MgO 38
double their volumes by reaction with water.[7,8] Before it is used for road construction, 39
steelmaking slag is exposed in air for a year or is sprayed with hot water or steam for a week,[9] 40
which is termed aging, to accelerate the hydration reactions of f-CaO and f-MgO. Subsequently, 41
an expansion test is normally performed for aged steelmaking slag by measuring the linear 42
expansion of aging-treated steelmaking slag immersed in hot water for several days in a 43
cylindrical vessel.[9] Only final products with linear expansions below a specified value (e.g., 44
1% in Japan[10]) are used for road construction. However, f-CaO and f-MgO may remain in the 45
aged steelmaking slag that passes the expansion test because the test cannot detect CaO or f-46
MgO directly. The residual f-CaO and f-MgO may create serious problems, such as road 47
expansion and cracking.[6] In particular, f-MgO is the main expansive component in aged 48
steelmaking slag because the hydration reaction of f-MgO occurs much more slowly than that 49
of f-CaO.[9] Therefore, the detection and determination of f-MgO is important to use 50
steelmaking slag for road construction efficiently and safely. 51
Unlike the determination of f-CaO content, no reliable analytical method exists to 52
determine the f-MgO content in steelmaking slag,[9] although several methods have been 53
presented; for instance, selective extraction into a liquid phase followed by analysis of f-MgO 54
(e.g., titration,[11] combined analysis of inductively coupled plasma-atomic emission 55
spectrometry and thermogravimetry[12,13]), 25Mg nuclear magnetic resonance (NMR),[14] and X-56
ray diffraction (XRD).[11] However, these methods have the following drawbacks: magnesium 57
compounds other than f-MgO may be extracted, several days are required to quantify f-MgO 58
by NMR, and it is difficult to detect f-MgO with a low crystallinity and quantify f-MgO with a 59
high crystal orientation by XRD. Owing to these drawbacks, even a qualitative method to detect 60
f-MgO rapidly has not been established well. 61
In this study, we focused on cathodoluminescence (CL) analysis, which is used to obtain 62
images and spectra based on the phenomenon of light emission from materials that were 63
induced by electron bombardment, to identify f-MgO in steelmaking slags rapidly. We have 64
shown that CL analysis can be used to identify oxides and nitrides produced in steelmaking 65
rapidly, such as f-CaO,[15] non-metallic inclusions,[16-22] and surface-oxide-scale on Fe–Al
66
alloys.[23] Few reports are available on CL analysis of MgO related to metallurgical processes, 67
such as MgO refractory bricks for steelmaking[24,25] and copper smelting.[26] In the reports, MgO 68
emitted blue, purple, and red luminescence by bombarding electrons on the MgO refractory 69
bricks, which indicates that the CL color of MgO depends on the process conditions. However, 70
such MgO CL color differences have not been explained well. In addition, mineral phases other 71
than f-MgO in steelmaking slag may emit luminescence in CL analysis. Here, we acquired CL 72
spectra of mineral phases in a steelmaking slag sample to investigate CL colors of mineral 73
phases in steelmaking slag and identify factors that affect the CL color of MgO and other 74
mineral phases. On the basis of the obtained CL spectra, we established a method to identify f-75
MgO rapidly from CL colors of steelmaking slag. 76
77
II. EXPERIMENTAL
Cathodoluminescence analysis was carried out for a steelmaking slag prepared by 79
heating a powder mixture of calcium carbonate (CaCO3), silica (SiO2), wüstite (FeO), hematite
80
(Fe2O3), manganese oxide (MnO), and MgO reagents in an argon atmosphere. This preparation
81
method is a general procedure for samples of steelmaking slag at the laboratory scale. Reagent 82
powders of CaCO3 (purity: 99.9%, Wako Pure Chemical Industries, Ltd., Osaka, Japan), SiO2
83
(purity: 99%, Nacalai Tesque, Inc., Kyoto, Japan), FeO (purity: 99.5%, Kojundo Chemical 84
Laboratory Co., Ltd., Saitama, Japan), Fe2O3 (purity: 99.9%, Kojundo Chemical Laboratory
85
Co., Ltd., Saitama, Japan), MnO (purity: 99.9%, Kojundo Chemical Laboratory Co., Ltd., 86
Saitama, Japan), and MgO (purity: 98%, Nacalai Tesque, Inc., Kyoto, Japan) were mixed with 87
an agate mortar. The nominal compositions in the mixed powder were listed in Table I. The 88
nominal composition was determined based on chemical compositions of steelmaking slags that 89
contained f-MgO.[9,27-29] The mixture was pressed into a pellet at 5 MPa. The pellet on a MgO
90
plate was heated at 1500 °C for 1 h in an argon atmosphere with a flow rate of 200 ml·min−1 91
and quenched to room temperature by blowing argon gas on the pellet. Phases in the slag 92
samples were identified by XRD (Ultima IV/SG, Rigaku Corporation, Tokyo, Japan) using a 93
Cu–Kα line. A certain surface of the slag sample was polished using 600-, 1200-, and 2400-94
grid abrasive papers and finished using a 1-μm diamond slurry. 95
96
Table I. Nominal compositions (in mass%) of a steelmaking slag sample.
97
CaO SiO2 FeO Fe2O3 MgO MnO
50 15 11 11 10 3
98
Cathodoluminescence images and spectra of the slag sample were acquired by using a 99
custom scanning electron microscope–cathodoluminescence (SEM-CL) system. Details of the 100
SEM and acquisition of the CL images have been reported in our previous papers.[15-21] The
101
procedure for acquiring CL images is summarized as follows. Cathodoluminescence images 102
were captured through a quartz viewport attached to a SEM (Mighty-8DXL, TECHNEX, Tokyo, 103
Japan) by using a digital single-lens reflex camera (α7RII, Sony Corp., Tokyo, Japan) equipped 104
with a zoom lens (LZM-06075A, Seimitu Wave Inc., Kyoto, Japan). The detectable wavelength 105
range of the camera was from 350 to 1000 nm. The wavelength range was achieved by removing 106
the built-in filter of the commercially available camera with a detectable wavelength range from 107
420 to 680 nm. Cathodoluminescence spectra of the slag sample were acquired by using a 108
custom SEM-CL spectrometer as shown in Fig. 1. Light that was emitted from the slag sample 109
was collimated by using an off-axis parabolic mirror with a 0.5-mm hole in the center. The 110
collimated light was collected by using a plano-convex lens through an optical fiber to a 111
spectrometer (QE65Pro, Ocean Optics Inc., Largo, Florida, USA). The plano-convex lens was 112
connected to the optical fiber, and this assembly was introduced into the SEM chamber through 113
a flange. Surface observations and elemental analyses of the slag sample were performed by 114
using SEM (TM3030 Plus, Hitachi High-Technologies Co., Tokyo, Japan) equipped with a 115
silicon drift energy dispersive X-ray (EDX) detector (Quantax70, Bruker Corp., Billerica, 116
Massachusetts, USA). 117
118
119
Fig. 1–Schematic illustration of SEM-CL system for acquiring CL spectra. 120
121
III. RESULTS AND DISCUSSION
122
A. CL images and spectra of mineral phases in steelmaking slag 123
Cathodoluminescence images and spectra of typical mineral phases of steelmaking slags such 124
as 2CaOSiO2, 3CaOSiO2, 2CaOFe2O3, and f-MgO,[9] were acquired to investigate whether
f-125
MgO could be identified from its luminescent color. We did not acquire a CL spectrum of f-126
CaO, which is one of the typical mineral phases in steelmaking slags[9] because we have already
127
reported its CL spectrum, which showed a peak at 600 nm.[15] The slag sample contained 128
2CaOSiO2, 3CaOSiO2, 2CaOFe2O3, and f-MgO phases, which were confirmed by XRD as
129
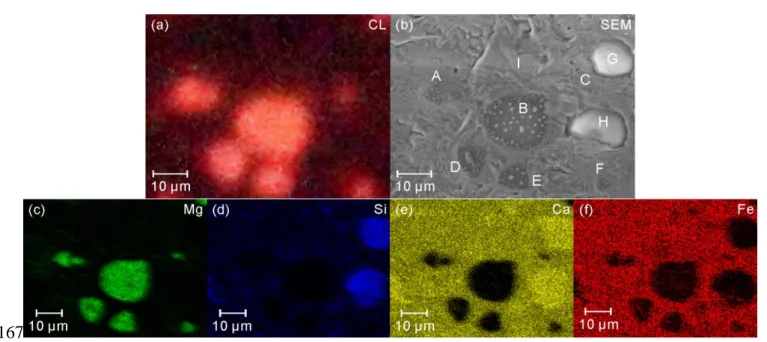
shown in Fig. 2. Particles with a red–orange luminescence were detected in the slag sample as 130
shown in Fig. 3(a). The corresponding SEM image and EDX elemental mappings of Mg, Si, 131
Ca, and Fe are shown in Fig. 3(b), (c), (d), (e), and (f), respectively. The illuminated particles 132
in Fig. 3(a) correspond to f-MgO (Areas A to F in Fig. 3(b)), which was confirmed by Mg 133
elemental mapping (Fig. 3(c)) and EDX point analysis as shown in Table II. The distribution 134
of f-MgO represents the typical distribution of f-MgO in the slag sample because there was not 135
a big difference in the distributions of f-MgO between the surface and the inside of the slag 136
sample. The compositions of Ca in Areas A, C, and F were higher than the solubility limits of 137
CaO in MgO at 1500 °C[30] because the observed areas included 2CaOFe2O3 particles close to
138
the f-MgO particles owing to their particle sizes. Areas G and H were confirmed to be 139
2CaOSiO2 by EDX point analysis (Table II). The other portions showed similar compositions
140
of Area I by EDX point analysis. Because the solubility limit of SiO2 in 2CaOFe2O3 is small,[15]
141
it is speculated from the EDX point analysis and XRD that Area I consists of 2CaOFe2O3 and
142
3CaOSiO2 phases. Therefore, no luminescence of 2CaOSiO2, 3CaOSiO2 or 2CaOFe2O3 was
143
detected in the CL image. It is speculated from Table II that 2CaOFe2O3 in the slag sample
144
contains MnO because the Mn contents in Area I and P, which contain 2CaOFe2O3 and
3CaOSiO2 phases, were 3 or 4 mol%, whereas those in Area J, K, L, and M, which only contain
146
3CaOSiO2 phase, were one or less than one mol%. All illuminated particles in Fig. 3(a) showed
147
a peak at 755 nm as shown in Fig. 4(a). The peak at 755 nm agreed well with previously reported 148
CL spectra of MgO and originated from manganese (II) ions (Mn2+) substituting octahedrally 149
coordinated magnesium (II) ions (Mg2+).[31] A few mol% of Mn in the f-MgO was confirmed
150
by EDX point analysis as shown in Table II. Therefore, the CL spectra support that the red– 151
orange illuminated particles in Fig. 3(a) are f-MgO. f-MgO emits blue and purple luminescence 152
from oxygen vacancies and Fe3+ substituting Mg2+, respectively.[26] It is also known that CL 153
peaks related to Mn2+ in minerals are intense.[32] Thus, f-MgO in steelmaking slags emits a red– 154
orange luminescence because steelmaking slags usually contain a few mass% of MnO.[5,6,9] The 155
red–orange luminescence was also detected in f-MgO particles that were present on another 156
area of the slag sample surface (see Fig. 6(a)), inside the slag sample, and on the surface of a 157
slag sample with a different nominal compositions as shown in supplementary Fig. S-1 (refer 158
to electronic supplementary material). The FeO phase is a typical mineral phase of steelmaking 159
slags,[9] but we could not detect the luminescence because of FeO when we captured a CL image 160
of the FeO reagent which contains 0.02 mass% of Mn and 0.01 mass% of Cr as impurities. This 161
result was consistent with a previous report on FeO in slags produced during copper smelting 162
and converting processes.[26] 163
Fig. 2–XRD pattern of the slag sample. 165
166
167
Fig. 3–(a) CL image, (b) SEM image, and EDX elemental mappings of (c) Mg, (d) Si, (e) Ca, 168
and (f) Fe of the surface of the slag sample. The exposure time for the CL image was 2 s. (color) 169
170
Table II. Chemical compositions (in mol%) of areas A to P in Fig. 3(b) and Fig. 5(b)
171
measured by EDX, and their phases determined by EDX and XRD.
172
Area Mg Si Ca Mn Fe Phases determined by
EDX and XRD A 77 2 12 2 7 Free magnesia B 94 <1 1 2 3 Free magnesia C 82 3 8 1 5 Free magnesia D 89 <1 3 3 4 Free magnesia E 89 1 3 3 5 Free magnesia F 81 2 10 2 6 Free magnesia G 2 31 65 <1 2 2CaOSiO2 H 1 31 66 <1 2 2CaOSiO2 I 5 6 53 3 33 2CaOFe2O3 + 3CaOSiO2 J 3 24 70 <1 3 3CaOSiO2 K 3 23 70 <1 2 3CaOSiO2 L 2 24 72 1 1 3CaOSiO2 M 2 22 73 1 1 3CaOSiO2 N 2 33 64 <1 2 2CaOSiO2 O 1 30 66 <1 2 2CaOSiO2 P 6 6 52 4 32 2CaOFe2O3 + 3CaOSiO2 173
174
Fig. 4–CL spectra of (a) near Areas B (Fig. 3(c)), (b) L (Fig. 5(b)), (c) O (Fig. 5(b)), and (d) 175
Area 11 (Fig. 6(d)). The acquisition time of the CL spectra was 30 s. 176
177
No luminescence of f-MgO was detected when we used a camera without removing a 178
built-in filter, because the f-MgO peak (755 nm) was out of the detectable wavelength range of 179
the camera (420–680 nm). However, areas that emit red and yellow luminescence were detected 180
by using the camera as shown in Fig. 5(a). The corresponding SEM image and EDX elemental 181
mappings of Mg, Si, Ca, and Fe are shown in Fig. 5(b), (c), (d), (e), and (f), respectively. As 182
listed in Table II, the compositions of areas that emit red (Areas J, K, L, and M in Fig. 5(b)) 183
and yellow (Areas N and O in Fig. 5(b)) luminescence were confirmed to be 3CaOSiO2 and
184
2CaOSiO2, respectively, by EDX point analysis. The other areas showed similar compositions
185
of Area P (Fig. 5(b)) by EDX point analysis, which suggests that the area consisted of 186
2CaOFe2O3 and 3CaOSiO2. The red luminescence of Areas J, K, L, and M is due to a CL peak
187
of 3CaOSiO2 at 675 nm shown in Fig. 4(b) because the peak at 675 nm is in the red region of
188
the camera (620–680 nm). The yellow luminescence of Areas N and O is due to a CL peak of 189
2CaOSiO2 at 590 nm as shown in Fig. 4(c) because the peak is in the yellow region (570–590
nm). A CL peak of 2CaOSiO2 at 720 nm (Fig. 4(c)) did not contribute to the luminescence of
191
2CaOSiO2 because the peak at 720 nm was out of the detectable wavelength range of the
192
camera. According to the literature[33] and EDX point analysis (Table II), all CL peaks of 193
3CaOSiO2 and 2CaOSiO2 originated from Mn2+ substituting calcium (II) ions (Ca2+). A Ca
194
site of CaO6 octahedron was present only in 3CaOSiO2,[34] whereas two Ca sites (CaO7
195
polyhedra and CaO8 polyhedra) existed in 2CaOSiO2.[35,36] Therefore, it could be inferred that
196
the CL spectra of 3CaOSiO2 and 2CaOSiO2 showed a single peak at 675 nm and two peaks
197
at 590 and 720 nm. Weak red luminescence was detected in several areas with similar 198
compositions to Area P, which indicates the presence of 3CaOSiO2 in the areas, and is
199
consistent with the phase determination by EDX point analysis and XRD (Table II). Although 200
the luminescence because of 3CaOSiO2 and 2CaOSiO2 was detected by using a camera with
201
a built-in filter, we could not detect the luminescence by using a camera without a built-in filter 202
as shown in Fig. 3(a) because the luminescence intensities of 3CaOSiO2 and 2CaOSiO2 were
203
approximately 250 times lower than that of f-MgO as shown in Fig. 4. These results indicate 204
that the SEM-CL system can identify f-MgO in steelmaking slags by detecting the peak at 755 205
nm in a CL spectrum or the intense red–orange luminescence because of the peak at 755 nm in 206
a CL image that was acquired by using a camera with a detectable wavelength range from 350 207
to 1000 nm. 208
209
Fig. 5–(a) CL image, (b) SEM image, and EDX elemental mappings of (c) Mg, (d) Si, (e) Ca, 210
and (f) Fe in another area of the polished surface of the slag sample. CL images were acquired 211
by using a camera with a detectable wavelength range from 420 to 680 nm. The exposure time 212
for the CL image was 60 s. (color) 213
214
B. Detection of residual free-magnesia in steelmaking slag after aging 215
Before the reuse of steelmaking slags for road constructions, steelmaking slags were 216
exposed to moisture (aging) to accelerate the hydration of f-CaO and f-MgO in the steelmaking 217
slag to prevent road expansion.[6] However, f-MgO is prone to remain in steelmaking slags even 218
after aging owing to its slow hydration reaction.[9] Therefore, the detection of residual f-MgO
219
after aging is important for CL analysis because it leads to a poor reused steelmaking slag 220
quality. Detection of residual f-MgO by acquiring a CL image and a CL spectrum was tested 221
by analyzing a slag sample after aging by immersing the slag sample in deionized water at 222
70 °C for one week. Cathodoluminescence images and the corresponding SEM images of the 223
slag sample before and after aging are shown in Fig. 6. The corresponding EDX elemental 224
mappings of Mg are also shown in Fig. 6. Both CL images were captured for the same region 225
of the slag sample. Areas with red–orange luminescence of the slag sample before aging were 226
confirmed to be f-MgO by EDX point analysis as shown in Table III. After aging, some parts 227
of the illuminated area retained the red–orange luminescence (Areas 6, 7, 9, and 11 in Fig. 6(d)), 228
whereas the other parts of the illuminated areas lost luminescence (Areas 5, 8, and 10 in Fig. 229
6(d)). The areas that lost luminescence agreed well with those whose intensities of the Mg–Kα 230
line decreased by aging as shown in Fig. 6(c) and (f). These results suggest that part of the f-231
MgO dissolved into the deionized water by aging. EDX point analysis also indicates the 232
dissolution of f-MgO since the magnesium compositions of f-MgO decreased by aging as 233
shown in Table III. The MgO compositions (mass%) of the areas that lose the red–orange 234
luminescence (Areas 5, 8, and 10) were approximately half those of the areas that retain the 235
red–orange luminescence (Areas 6, 7, 9, and 11). In the EDX point analysis, we did not include 236
Si and Ca in the compositions of Areas 1 to 11, although Si and Ca–Kα lines were detected in 237
these areas, because little SiO2 and CaO dissolved into MgO, and we consider that the detected
238
Si and Ca–Kα lines were attributed to calcium silicates beneath the f-MgO. It is speculated that 239
all f-MgO in Fig. 6(a) retained its MgO structure after aging since MgO forms binary 240
isomorphous systems with FeO[37] and MnO.[38] This result is supported by the CL spectrum of 241
the f-MgO, which retains the luminescence as shown in Fig. 4(d) because the peak related to 242
Mn2+ in MgO was detected at 755 nm. The CL intensity of the illuminated f-MgO after aging 243
was approximately 50 times lower than that before aging as shown in Fig. 4(d), because of the 244
increase in FeO content in the f-MgO. FeO that is dissolved in MgO forms a charge-transfer 245
band that is associated with electron transfer between Fe2+ and Fe3+ in the MgO, and the 246
luminescence in MgO was absorbed by the charge-transfer band.[39,40] In addition, luminescence
247
intensity related to Mn2+ decrease at higher content of MnO because of the reabsorption of the 248
emitted luminescence by other Mn2+ ions in a sample (self-quenching effect). Therefore, it is 249
expected that intensity of red–orange luminescence in f-MgO will decrease with increasing FeO 250
and MnO contents in f-MgO. Actually, the FeO and MnO contents in f-MgO that lose red– 251
orange luminescence (Areas 5, 8, and 10) were higher than those of f-MgO that retained red– 252
orange luminescence (Areas 6, 7, 9, and 11) as shown in Table III. Thus, it is difficult to detect 253
f-MgO particles with high FeO and MnO contents (Areas 5, 8, and 10) from their CL image. 254
However, these f-MgO particles would not cause road expansion since f-MgO dissolution of 255
more than 30 mass% of combined compositions of FeO and MnO does not result in volume 256
expansion by the hydration reaction.[41] In contrast, f-MgO that retained red–orange
257
luminescence after aging would lead to an expansion of roads since the combined compositions 258
of FeO and MnO in the f-MgO were less than 30 mass% (Areas 6, 7, 9, and 11) as shown in 259
Table III. Although the CL intensity of the f-MgO that retained the red–orange luminescence 260
decreased after aging, the CL intensity exceeded more than 10 times that of the 3CaOSiO2 and
261
2CaOSiO2 as shown in Fig. 4. We detected no luminescence, except for f-MgO, when we
262
acquired CL images of the slag sample after aging, although Mg(OH)2 and/or MgCO3 may
263
precipitate after aging, which indicates that Mg(OH)2 and MgCO3 show little or no CL
264
intensities. The CL intensities of Mg(OH)2 and MgCO3 reagent powders were more than 200
265
times lower than that of the MgO reagent powder as shown in supplementary Fig. S-2 (refer to 266
electronic supplementary material). These results suggest that it is possible to distinguish the f-267
MgO, which included FeO and MnO at a content of less than 30 mass%, from 3CaOSiO2 and
268
2CaOSiO2 by the difference in the luminescence intensities of the CL images. Therefore, we
269
can identify instantly residual f-MgO that leads to road expansion after aging by detecting the 270
red–orange luminescence of the CL image, captured by using a camera with a detectable 271
wavelength range from 350 to 1000 nm with an exposure time of a few seconds. 272
273
Fig. 6–(a) CL image, (b) SEM image, and (c) EDX elemental mapping of Mg of the surface of 274
the slag sample before aging. The exposure time for the CL image was 2 s. (d) CL image, (e) 275
SEM image, and (f) EDX elemental mapping of Mg of the same surface of the slag sample after 276
aging. The exposure time for the CL image was 0.1 s. The beam current density that bombarded 277
the sample to capture Fig. 6(d) was approximately 100 times higher than that for Fig. 6(a). 278
Table III. Chemical compositions (in mol% and mass%) of areas 1 to 11 in Fig. 6(c) and
280
(f) measured by EDX.
281
Area mol% mass%
Mg Mn Fe MgO MnO FeO
1 92 2 5 87 4 9 2 93 2 5 88 3 9 3 93 3 5 88 4 8 4 92 3 5 86 5 9 5 61 12 28 47 16 38 6 89 2 9 82 3 15 7 88 3 9 81 4 15 8 63 10 27 49 14 38 9 81 4 14 71 6 23 10 58 11 31 44 15 41 11 84 3 14 74 5 21 282 4. Conclusions 283
This work has proposed a method to detect f-MgO in steelmaking slags from CL images 284
that were obtained by using a camera with a detectable wavelength range from 350 nm to 1000 285
nm. The f-MgO may cause road expansion when steelmaking slags are used for road 286
construction. A method for the detection of f-MgO was established through analysis of CL 287
images and spectra obtained from a steelmaking slag sample. The CL image of the slag sample 288
showed that f-MgO emitted a red–orange luminescence. An intense luminescence peak was 289
detected at 755 nm in the CL spectra of the f-MgO, which is attributed to Mn2+ substituting 290
octahedrally coordinated Mg2+. The mineral phases, 3CaOSiO2 and 2CaOSiO2, emitted red
291
and yellow luminescence, respectively. Tri-calcium silicate (3CaOSiO2) showed a CL peak at
292
675 nm. The CL spectra of 2CaOSiO2 had peaks at 590 and 720 nm and the yellow
293
luminescence of 2CaOSiO2 was attributed to the peak at 590 nm. All peaks of 3CaOSiO2 and
294
2CaOSiO2 originated from Mn2+ substituting Ca2+. The CL intensities of 3CaOSiO2 and
295
2CaOSiO2 were approximately 250 times lower than that of f-MgO. No luminescence of
296
2CaOFe2O3 and FeO was detected in the CL images. Hence, we can distinguish f-MgO from
other mineral phases in steelmaking slags by detecting intense red–orange luminescence in the 298
CL image or a peak at 755 nm in the CL spectrum. We detected red–orange luminescence of 299
the f-MgO, whose combined content of FeO and MnO was below 30 mass% in the slag sample 300
after aging in deionized water at 70 °C for one week. The CL intensity of the illuminated f-301
MgO after the aging test was more than 10 times higher than that of the 3CaOSiO2 and
302
2CaOSiO2. In contrast, little or no luminescence was detected in f-MgO with a combined
303
content of FeO and MnO in excess of 30 mass%, Mg(OH)2, or MgCO3 particles . Therefore,
f-304
MgO which has the potential to casue road expansion can be selectively identified in 305
steelmaking slags after aging by detecting red–orange luminescence in the CL image with an 306
exposure time of a few seconds. These f-MgO particles contain less than 30% FeO + MnO and 307
have the potential to expand due to hydration when used in the road-building process. To our 308
knowledge, no method has been presented previously for the selective identification of f-MgO, 309
which causes road expansion in the steelmaking slag. Hence, the acquisition of CL images and 310
CL spectra of steelmaking slag is a promising method to detect f-MgO, which may be 311
detrimental to its reuse. Future work will investigate CL images and spectra of f-MgO in real 312
steelmaking slag and quantify the f-MgO content in the slag for the practical use of this method. 313
314
Acknowledgements
315
This study was supported by JSPS KAKENHI [Grant Number 17H03435]. 316
References
318
1. Y. Jiang, T.-C. Ling, C. Shi and S.-Y. Pan: Resour. Conserv. Recycl., 2018, vol. 136, pp. 319
187-197. 320
2. J. Li, S.Y. Pan, H. Kim, J.H. Linn and P.C. Chiang: J. Environ. Manage., 2015, vol. 162, 321
pp. 158-70. 322
3. S.-Y. Pan, R. Adhikari, Y.-H. Chen, P. Li and P.-C. Chiang: J. Clean Prod., 2016, vol. 323
137, pp. 617-631. 324
4. İ. Yüksel: Environ. Dev. Sustain., 2016, vol. 19, pp. 369-384. 325
5. G. Wang, Y. Wang and Z. Gao: J. Hazard. Mater., 2010, vol. 184, pp. 555-560. 326
6. C. Kambole, P. Paige-Green, W.K. Kupolati, J.M. Ndambuki and A.O. Adeboje: Constr. 327
Build. Mater., 2017, vol. 148, pp. 618-631.
328
7. S. Chatterji: Cem. Concr. Res., 1995, vol. 25, pp. 51-56. 329
8. L.F. Amaral, I.R. Oliveira, P. Bonadia, R. Salomão and V.C. Pandolfelli: Ceram. Int., 330
2011, vol. 37, pp. 1537-1542. 331
9. L.M. Juckes: Trans. Inst. Min. Metall., Sect. C, 2003, vol. 112, pp. 177-197. 332
10. J.I. Standards, (Japanese Industrial Standards: Tokyo, 2018). 333
11. F.M. Lea: The Chemistry of Cement and Concrete. 3rd ed., Edward Arnold, Glasgow, 334
1970, pp. 111-112. 335
12. K. Hanada, M. Inose, S. Sato, K. Watanabe and K. Fujimoto: Tetsu-to-Hagané, 2016, vol. 336
102, pp. 24-28. 337
13. M. Kato, K. Tsukagoshi, M. Aimoto, S. Saito and M. Shibukawa: ISIJ Int., 2018, vol. 58, 338
pp. 1834-1839. 339
14. K. Kanehashi and M. Aimoto: Tetsu-to-Hagané, 2013, vol. 99, pp. 543-551. 340
15. H. Tsuneda, S. Imashuku and K. Wagatsuma: Tetsu-to-Hagané, 2019, vol. 105, pp. 30-341
37. 342
16. S. Imashuku, K. Ono, R. Shishido, S. Suzuki and K. Wagatsuma: Mater. Charact., 2017, 343
vol. 131, pp. 210-216. 344
17. S. Imashuku, K. Ono and K. Wagatsuma: X-Ray Spectrom., 2017, vol. 46, pp. 131-135. 345
18. S. Imashuku, K. Ono and K. Wagatsuma: Microsc. Microanal., 2017, vol. 23, pp. 1143-346
1149. 347
19. S. Imashuku and K. Wagatsuma: Metall. Mater. Trans. B, 2018, vol. 49, pp. 2868-2874. 348
20. S. Imashuku and K. Wagatsuma: Surf. Interface Anal., 2019, vol. 51, pp. 31-34. 349
21. S. Imashuku and K. Wagatsuma: X-Ray Spectrom., 2019, vol. 48, pp. 522-526. 350
22. S. Imashuku and K. Wagatsuma: Metall. Mater. Trans. B, 2019, p. Submitted. 351
23. S. Imashuku and K. Wagatsuma: Corros. Sci., 2019, vol. 154, pp. 226-230. 352
24. W.E. Lee, S. Zhang and M. Karakus: J. Mater. Sci., 2004, vol. 39, pp. 6675-6685. 353
25. L. Musante, L.F. Martorello, P.G. Galliano, A.L. Cavalieri and A.G. Tomba Martinez: 354
Ceram. Int., 2012, vol. 38, pp. 4035-4047.
355
26. M. Karakus, M.D. Crites and M.E. Schlesinger: J. Microsc., 2000, vol. 200, pp. 50-58. 356
27. A. Niida, K. Okohira, A. Tanaka and T. Kai: Tetsu-to-Hagané, 1983, vol. 69, pp. 42-50. 357
28. M. Gautier, J. Poirier, F. Bodénan, G. Franceschini and E. Véron: Int. J. Miner. Process., 358
2013, vol. 123, pp. 94-101. 359
29. C. Liu, M. Guo, L. Pandelaers, B. Blanpain and S. Huang: Metall. Mater. Trans. B, 2016, 360
vol. 47, pp. 3237-3240. 361
30. S.-M. Liang and R. Schmid-Fetzer: J. Eur. Ceram. Soc., 2018, vol. 38, pp. 4768-4785. 362
31. T. Kato, G. Okada and T. Yanagida: J. Ceram. Soc. Jpn., 2016, vol. 124, pp. 559-563. 363
32. M. Gaft, R. Reisfeld and G. Panczer: Luminescence Spectroscopy of Minerals and 364
Materials. Springer, 2005.
365
33. K. Ramseyer and J. Mullis: Geologic Application of Cathodoluminescence of Silicates. 366
Springer, Berlin, 2000, pp. 177-191. 367
34. R. Dai, C. Tong, Y. Zhu, C. Xu, L. Yang and Y. Li: Opt. Mater., 2018, vol. 85, pp. 32-40. 368
35. Y. Sato, H. Kato, M. Kobayashi, T. Masaki, D.H. Yoon and M. Kakihana: Angew. Chem. 369
Int. Ed. Engl., 2014, vol. 53, pp. 7756-9.
370
36. Z. Mao, Z. Lu, J. Chen, B.D. Fahlman and D. Wang: J. Mater. Chem. C, 2015, vol. 3, pp. 371
9454-9460. 372
37. P. Wu, G. Eriksson, A.D. Pelton and M. Blander: ISIJ Int., 1993, vol. 33, pp. 26-35. 373
38. P. Wu, G. Eriksson and A.D. Pelton: J. Am. Ceram. Soc., 1993, vol. 76, pp. 2065-2075. 374
39. A.S. Marfunin: Spectroscopy, Luminescence and Radiation Centers in Minerals. 375
Springer-Verlag, Berlin, 1979. 376
40. D. Habermann, R.D. Neuser and D.K. Richter: Quantitative High Resolution Spectral 377
Analysis of Mn2+ in Sementary Calcite. Springer, Berlin, 2000, pp. 331-358.
378
41. H. Suito, T. Yokomaku, Y. Hayashida and Y. Takahashi: Tetsu-to-Hagané, 1977, vol. 63, 379
pp. 2316-2325. 380
Fig. S-1 (a) CL and (b) SEM (backscattered electron) images of the inside of the slag sample. (c) CL and (d) SEM (backscattered electron) images of the surface of a slag sample whose nominal compositions of CaO, SiO2, FeO, Fe2O3, MgO, and MnO were 50, 10, 13.5, 13.5, 10, and 3 mass%, respectively. The exposure time
for the CL image (a) and (c) were 0.2 s and 0.5 s, respectively.
Fig. S-2 CL spectra of reagent powders of (a) MgO, (b) Mg(OH)2, and (c) MgCO3. Acquisition times for (a), (b),