Hard Currency Strategy and Economic
Development in Papua New Guinea
著者
MINAMURA Takeichi
journal or
publication title
南太平洋海域調査研究報告=Occasional papers
volume
23
page range
53-56
URL
http://hdl.handle.net/10232/16784
Survey Team 4, Report 1. The Progress Report of the 1991 Survey of the Research Project, "Man and the Environment in Papua New Guinea"
HARD CURRENCY STRATEGY AND ECONOMIC DEVELOPMENT
IN PAPUA NEW GUINEA
Takeichi MINAMURA Introduction
Papua New Guinea (PNG) is characterized by an aggregation of several hundred cultural groups and its linguistic diversities. There are about 750 distinct languages and thousands of dialects in the region. The basic socio-political unit is the clan. A village or a family is the basic unit of production. Labour is controlled by a household or group of households whose members are closely related. Most of the population live in the villages and are engaged in subsistence agriculture. But in recent years, a money economy has developed in the town and village. In accordance with the development of a money economy, the traditional society of PNG is changing rapidly. The socio-economic structure of PNG is dualistic. There remains a traditional socio-economic system in the core, and modern one is penetrating the surface.
According to the classification by the World Bank, PNG is situated in the middle in come group (per head income : US. $ 890 in 1989). But if we see PNG's socio-economic indications, the country would surely be classified as a less developed country. For exam ple, the ratio of nonliteracy of PNG residents (55%) in 1985 is much higher than that of Ethiopia (38%) and China (31%), which are classified among the low income countries
(the least developed countries). Therefore, I have some questions about whether or not we
can analyze the socio-economy of PNG with the instruments of modern economic theory. We can surely analyze and understand only a part of the economic activities with the modern economic theory. With this caution in mind, I will discuss the problems of the hard currency kina strategy in PNG in this paper.
Hard Currency Kina Strategy
At the time of independence in 1975, the government declared to take three main eco
nomic policies. They are 1) the hard currency kina strategy, 2) the minimum wage policy, and 3) the commodity stabilization scheme. As PNG is a small open economy with its
domestic price levels largely determined by externally set export-import prices, the exchange rate was primarily intended as an anti-inflation instrument. The government decided that the value of the national currency kina should be equal with Australian dollar. As we see in table 1, during the period from 1976 to 1979, the kina was revalued six times (31%) against the Australian dollar which is the currency of their most major trading partner. In 1987, the kina recorded the highest exchange rate against the Australian dollar. The kina is one of the most appreciated currencies among the developing countries, and it is said that hard currency kina strategy has succeeded in the anti-inflation policy.
On the other hand, the balance of payments which had been generally in surplus until the end of 1979, has generally had a deficit since then (table 2). Unfavorable movements in the
T. Minamura
Tablet. Exchange Rates of Kina
A. $ US. $ YEN A. $ US. $ YEN
1975 1.00 1.26 383 1983 1.27 1.14 265 1976 1.13 1.23 361 1984 1.28 1.06 265 1977 1.16 1.32 317 1985 1.47 0.99 198 1978 1.26 1.45 281 1986 1.57 1.04 166 1979 1.31 1.45 348 1987 1.58 1.14 140 1980 1.32 1.55 315 1988 1.42 1.21 152 1981 1.30 1.47 323 1989 1.47 1.16 167 1982 1.36 1.34 313 1990 1.36 1.05 141
Source : Bank of Papua New Guinea (1992).
Table 2. Balance of Trade (million kina)
1978 1979 1980 1981 1982 1983 1988 1989 1990
Export 550 687 692 564 569 687 1276 1132 1111
Import 478 562 684 738 752 815 1199 1152 1050
Balance 72 125 8 -174 -183 -127 77 - 20 61
Source : Bank of Papua New Guinea (1992).
Table 3. Export Prices (kina/tonne, f. o. b.
1980 1982 1984 1985 1986 1987 1988 1989 1990
Cocoa 1,615 1,114 1,964 2,022 1,768 1,634 1,230 970 822
Coffee 2,326 1,892 2,241 2,894 3,927 2,079 2,533 1,652 1,623
Copra 271 173 523 324 108 180 252 231 158
Source : Bank of Papua New Guinea (1992).
balance of payments in the early 1980s were mainly caused by external factors. From mid 1980 to the end of 1982, the value of exports fell markedly (table 3). The deficit of the current account has been financed by a combination of private and government overseas
borrowing.
It is often said that the weakness of PNG's economic performance is due to the hard kina
strategy. The appropriateness of the hard kina strategy was increasingly questioned in academic circles as well as among government policy makers. It was suggested from time to time that the kina was overvalued in relation to PNG's balance payments position. The prevailing kina exchange rate was adversely affecting domestic economic development, and the rate was not low enough to provide the financial incentives necessary to increase growth of export and import-substitution industries. These arguments implied the appropriateness of devaluation, as a general macroeconomic policy measure, aimed at achieving a balance of payments equilibrium and increased domestic economic growth via the expansion of export
and import-substitution industries.
In 1990, a report of the World Bank insisted that the PNG government should devalu ate the kina about 30 percent. In January 1990, the government decided to devaluate the
kina ten percent.
Effectiveness of a Kina Devaluation in PNG
In early 1982, the government commissioned a major study by consultants to review the country's macroeconomic policy and performance since independence, particularly the exchange rate policy. A comprehensive report prepared by R. Garnaut and P. Baxter was submitted to the government in February 1983. It recommended the need for an increase in the price of tradables relative to labour of around 25 to 30 percent, and suggested two alternative approaches to achieve this ; a gradual approach to adjust with discrete
devaluation, and a sudden approach through devaluation.
M. D. Dayananda (1987) discussed the devaluation of the kina, and examined the necessary conditions for a successful devaluation in PNG. He says the necessary condi
tions for a successful devaluation are a reduction in real expenditures, a downward
flexibility in real wages, and a removal of price controls and subsidies. If these condi tions are met, and further, if exports and imports are substantively to responsive to price changes, a devaluation will induce a switch in the patterns of production and demand as a
result of the devaluation-induced rise in the domestic prices of tradables relative to non-tradables.
The ten percent devaluation of the kina in January of 1990 provided a valuable op portunity to assess the effectiveness of this policy instrument. The expected gain from
devaluation of the kina is a more competitive economy, i. e., lower labour cost. According
to Andrew Elek's study, it was very difficult to achieve gains in competitiveness through
devaluation (ELEK, 1992). The devaluation was not accompanied with wage restraint
because of the shortage of skilled workers. The wage level of workers in PNG is higher than
that of the other developing countries.
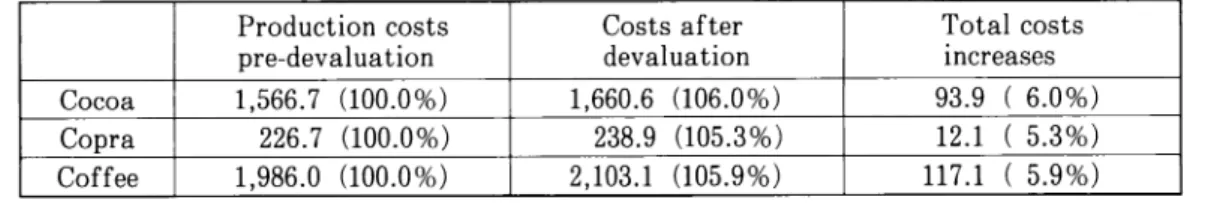
There still remains a necessity to assess the influence on export industries. Andrew
Elek suggests to us that the influence is not so large as expected because of increase of costs. According to his analysis, ten percent devaluation increases kina receipts at any given level of world prices, but the cost in kina terms also increases five to six percent (table 4).
Table 4. Effects of Devaluation on Export-crops (kina/tonne)
Production costs pre-devaluation Costs after devaluation Total costs increases Cocoa 1,566.7 (100.0%) 1,660.6 (106.0%) 93.9 ( 6.0%) Copra 226.7 (100.0%) 238.9 (105.3%) 12.1 ( 5.3%) Coffee 1,986.0 (100.0%) 2,103.1 (105.9%) 117.1 ( 5.9%) Source : Elek (1992).
56 T. Minamura Conclusion
Although the hard kina strategy benefited the wage-earners and expatriates, but it damaged the rural economy and indigenous industries. About 80 percent of population live in the small villages and are engaging in subsistence agriculture.
According to the data of World Bank (IBRD, 1990), per head income of PNG (US. $ 890
in 1989) is classified in the middle income group. The average cash income per head from
agriculture is only 50.4 kina in the rural district in 1980. It is evident that there are large inequalities between the income of wage-earners, expatriates and agriculture. So the hard currency kina strategy should not only be executed from the stand point of wage-earners and
expatriates but also from national stand point in general.
As M. D. Dayanada stated in 1987, and Andrew Elek analyzed in 1992. the exchange rate policy is not likely to be successful in achieving external and internal balance in an economy
such as the Papua New Guinea.
References
Bank of Papua New Guinea 1992. Quarterly Economic Bulletin 19 (2).
DAYANANDA, M. D. 1987. Papua New Guinea Journal of the Social Science and Humanities 14 (2) : 34-49.
Elek, A. 1992. Structural adjustment in Papua New Guinea, 1989-1990. Institute of National Affairs, Port Moresby.
IBRD, 1990. World Development Report. P. 271. Oxford University Press. New York.
WHALLY, J. 1982. Foreign trade policies in Papua New Guinea, Institute of National Affairs, Port Moresby.