Article
Effect of Crime Prevention through Environmental
Design (CPTED) Measures on Active Living and
Fear of Crime
Jae Seung Lee1, Sungjin Park1,* and Sanghoon Jung2,*
1 Department of Urban Design and Planning, Hongik University, 94 Wausan-ro, Mapo-gu, Seoul 121-791,
Korea; [email protected]
2 Department of Urban Planning, Gachon University, Seongnamdaero 1342, Seongnam,
Gyeonggi-do 461-701, Korea
* Correspondence: [email protected] (S.P.); [email protected] (S.J.); Tel.: +82-2-320-1664 (S.P.); +82-10-9817-5679 (S.J.); Fax: +82-2-336-7416 (S.P.)
Academic Editor: Tan Yigitcanlar
Received: 9 July 2016; Accepted: 15 August 2016; Published: 31 August 2016
Abstract:Crime prevention through environmental design (CPTED) has become a popular urban planning approach to preventing crime and mitigating fear of crime through the improvement of physical neighborhood environments. CPTED is widely used to improve deteriorated neighborhoods that suffer from crime. However, few studies have empirically examined the complex relationships among CPTED, fear of crime, and active living. Our study, therefore, investigated the effects of CPTED measures on walking frequency and fear of crime, analyzing behavioral data of residents living in participatory neighborhood regeneration areas and matched neighborhoods. We analyzed survey data from 12 neighborhoods that implemented CPTED approaches and 12 matched neighborhoods in Seoul, Korea, using structural equation modeling, which could consistently estimate complex direct and indirect relationships between a latent variable (fear of crime) and observable variables (CPTED measures and walking frequency). We designed the survey instrument as a smartphone app. Participants were recruited from 102 locations within the 24 selected neighborhoods; in total, 623 individuals returned surveys. The results revealed that sufficient closed-circuit television, street lighting, and maintenance played a significant role in mitigating fear of crime. This study has implications for planning and policy issues related to CPTED, mental health, and active living.
Keywords:CPTED; fear of crime; walking frequency; structural equation modeling
1. Introduction
Crime prevention through environmental design (CPTED) is one of the most popular urban planning strategies for improving safety in cities. The major purpose of CPTED is to deter potential criminals by modifying urban environments. It is based on the urban design and environmental psychology belief that human behavior can be influenced by the surrounding environment [1]. CPTED is often used to renovate declining neighborhoods that suffer from crime. For example, local governments in Korea have carried out urban regeneration projects to improve the physical environment of low-rise neighborhoods. Since most deteriorated neighborhoods in Korea suffer from high crime rates [2], neighborhood restoration projects generally incorporate CPTED to reduce crime and fear of crime and, thus, improve social sustainability for residents. However, the effectiveness of CPTED implementation is still disputed.
Although a few studies have assessed CPTED projects in terms of physical activity and fear of crime [3,4], the post-completion influence of specific CPTED measures are still insufficiently researched. Moreover, most previous studies have evaluated CPTED application at the neighborhood level [5–7]
although CPTED measures are used in different locations within a neighborhood. Additionally, few studies have objectively measured CPTED implementation [8]. Therefore, our study aimed to analyze how CPTED measures; for example, closed-circuit television (CCTV), street lighting, transparent fencing, community parks, and maintenance, influenced residents’ physical activity levels and fear of crime by objectively measuring CPTED application and surveying residents at the location level.
To attain this goal, we analyzed survey data collected from 12 neighborhoods that applied CPTED and 12 matched neighborhoods in Seoul, Korea. We identified neighborhood locations where CPTED measures were implemented and matched locations representing typical environments in non-CPTED neighborhoods. The survey was conducted in the selected locations. The survey dataset included residents’ socioeconomic and demographic characteristics, weekly walking trip frequency, and fear of crime. A structural equation model (SEM) examined the complex relationships among a latent variable (fear of crime) and observable variables (CPTED measures and activity levels). Specifically, we attempted to investigate the CPTED measures’ effect on activity levels in relation to residents’ fear of crime. Our ultimate goal was to gain insights into effective CPTED strategies for achieving safe environments that would encourage active lifestyles.
The rest of this paper is organized as follows: Section2discusses theoretical and empirical studies regarding CPTED and fear of crime; Section3presents our conceptual framework involving CPTED measures, fear of crime, and walking behavior of residents; Section4introduces this study’s setting and methods; Section5explains the SEM’s results. The paper concludes with a discussion of the study’s implications and suggestions for future research directions.
2. Literature Review
2.1. Crime Prevention through Environmental Design
Ray Jeffery [9] first used the phrase “crime prevention through environmental design”, but Jane Jacobs’s 1961 classic,The Death and Life of Great American Cities, deeply influenced the CPTED idea [10]. Although the construct continues to evolve, traditional CPTED can be defined by the following concepts: natural surveillance, territoriality, access control, activity support, and image/maintenance [11].
Jacobs’s famous idea of “eyes on the street” influenced the concept of natural surveillance [10]. According to this idea, the safest urban place is one that is continuously watched by human beings. Oscar Newman and his “defensible space” research confirmed and further developed this notion [12]. In his empirical study on American housing projects, he found that crimes more likely occurred in spaces that were invisible to residents. He argued that buildings and community designs that encouraged natural surveillance, especially by their own residents, were critical for deterring crime.
Territoriality was also applied in urban planning and design by Jacobs and subsequently by Newman. According to this concept, a place with a close-knit social network can develop voluntary community guardianship. A place that is continuously controlled by its own residents, who share a sense of community, can be more effective than police enforcement [10]. Newman [12] insisted that residents’ territorial attitude could act as an effective deterrent to potential crimes and that a semi-public community space surrounded by residential buildings would be important for developing territoriality.
Activity support can be achieved by designing a built environment or signage in a way that promotes the intended use of a public space through so-called “safe activities” [1]. The basic assumption of activity support is that crime can be deterred in spaces where a variety of activities continuously take place and attract people. Jacobs [10] mentioned that well-used streets and bustling sidewalks were safer from violent crimes than deserted spaces. Both natural surveillance and territoriality can be achieved by promoting more activities in public spaces.
community spaces was important for improving residential security. His study did not focus on suburban design, but the popularity of cul-de-sacs could also be explained by Newman’s idea of access control.
The CPTED concept of image/maintenance could be traced to Philip Zimbardo’s 1969 social experiment and Wilson and Kelling’s broken window theory [13]. In Zimbardo’s experiment, intentionally damaged vehicles were abandoned on urban streets to observe how they were vandalized. In unmaintained urban environments with no signs of ownership, vandalism and other criminal behavior escalated. Therefore, to prevent crime, both streets and properties should be maintained so that an image of civility would be perceived by a potential criminal. Based on research conducted in neighborhoods in Baltimore, MD, USA, Perkins et al. [14] found that physical incivilities, particularly “the actual presence of disorder-related cues”, negatively influenced the perception of crime-related problems.
These five concepts are interconnected, forming the backbone of traditional CPTED strategies, which are implemented through a variety of practical neighborhood and design measures. Marzbali et al. [3] assessed comprehensive CPTED measurements, as follows: landscaping, lighting, and street patterns for natural surveillance; physical barriers and security systems for access control; personalization items for territoriality; and exterior upkeep for maintenance. Their analysis identified negative and indirect effects of CPTED measures on the fear of crime through victimization. Increasing evidence shows the impact of CPTED measures or CPTED-related variables on recorded crimes and property values [1]. Perkins et al. [15] insisted that built-environment features, related to defensible space, and a “transient” environment, related to disorder and territoriality, could explain a significant proportion of neighborhood crimes. Another study conducted in the Netherlands found that territoriality and access control significantly influenced daytime burglary rates [16].
2.2. Fear of Crime
Any physical threat is a critical factor for a person’s quality of life; for this reason, fear of crime has become one of the most relevant contemporary social issues. Fear of crime is different from actual victimization. It is subjective and cultural because individual levels of fear of potential victimization vary. For example, substantial research evidence shows that women are consistently more likely to have a higher level of fear of crime than men [17–19]. Abdullah et al. [20] found that women demonstrated higher levels of fear in the following three dimensions: disorder, perceived risk, and crime.
Fear of crime is a complicated concept that can be observed and understood at the following psychological levels: perception, cognition, and behavior. As fear of crime can be indirectly experienced and propagated through social media, the public’s fear of crime can be inflated by the mass media. According to Jackson [21], fear of crime comprises “a range of subjective interpretations of the social meaning of crime and incivility embedded in the local context”. An accurate measurement of fear of crime requires dividing this multifaceted construct into more easily measurable subconcepts. Covington and Taylor [22] defined fear of crime through three dominant theoretical subconcepts—indirect victimization, community concern, and incivilities. Marzbali et al. [3] measured the fear of crime in greater detail, using the following subconcepts: perceived disorder, worry about victimization, and perceived risk. They surveyed residents’ perceptions of burglary, vehicle theft, vandalism, drug abuse, and teenagers hanging around and making trouble. Worry about victimization was measured through residents’ reported concerns about being robbed and assaulted, having their vehicles stolen, and being sexually harassed and raped. Perceived risk was measured by asking about residents’ perceived safety when walking alone in an area after dark. These studies demonstrate the importance of designing survey questionnaires, which are critical to objectively and accurately measure individuals’ fear of crime and to understand its relationship with psychosocial factors at various levels.
The design of the urban physical environment was tested as one of the major factors affecting fear of crime, and multiple studies evaluated CPTED-related variables [26]. Research outcomes indicated a significant relationship between incivilities and fear of crime [20]. In a film-based experiment, Medway et al. [27] found littering as a physical incivility that significantly influenced individuals’ perception of crime prevalence.
A recent research trend involved the use of SEM to confirm the multidirectional relationships among fear of crime and other related constructs. To simultaneously test the relationships among perceived risk of victimization, fear of crime, and other related variables, Valera and Guardia [28] built an SEM that revealed fear of crime as related to “environmental features, personal variables, and social representation of unsafe places”. In their research conducted in Malaysia, Marzbali et al. [3] investigated the comprehensive relationships among CPTED, victimization, and fear of crime. They observed a significant direct influence of victimization on fear of crime but a negative indirect relationship between CPTED and fear of crime.
2.3. Fear of Crime in Relation to Health
Scholars have hypothesized that residents’ fear of crime negatively influences their active lifestyles, particularly by minimizing their time spent in walking outdoors and eventually affecting their physical and psychological health [29]. Despite numerous studies focusing on the relationship between general built-environment attributes and physical activity [29,30], relatively few studies have tested the effects of comprehensive CPTED measures on health. However, some studies have included one or two CPTED-related measures when testing their effects on health-related variables, such as the level of physical activity or walking frequency.
For example, a study conducted in European cities found that neighborhood physical disorder, measured through indicators such as litter and graffiti, influenced “adults’ readiness to encourage children’s physical activity and women’s occasional involvement in sports or exercise” [31]. Weden et al. [32] found a strong association between health and perceived neighborhood quality, which was partially measured by CPTED-related indicators, such as general upkeep, abandoned buildings, and litter. Roman and Chalfin [19] tested variables including the percentage of vacant houses and their effect on residents’ reluctance to walk outdoors due to the fear of crime, but found no significant relationship. A study conducted in Seoul revealed a positive association between satisfaction with public security and vigorous physical activity among women, but this link was not found among men [33].
In a study conducted with Nigerian adults, Oyeyemi et al. [4] found that perceived safety from crime and traffic influenced the amount of physical activity, measured by accelerometers. Arango et al. [34] verified a “convincing association” between the presence of street lighting and transport-related physical activity. Recent Malaysian research found that in places with “highly permeable street layouts”, promoted by New Urbanists, residents were expected to have high levels of fear of crime and low social cohesion, which would cumulatively have a negative influence on their health [26].
A costly outcome of crime is that high levels of the fear of crime keep residents from going out and spending time in public spaces. This may significantly decrease physical activity levels, resulting in various physical and mental health problems. If CPTED measures can reduce fear of crime and thus increase outdoor activities and active living, they will help control increasing levels of obesity and eventually improve public health and individuals’ quality of life.
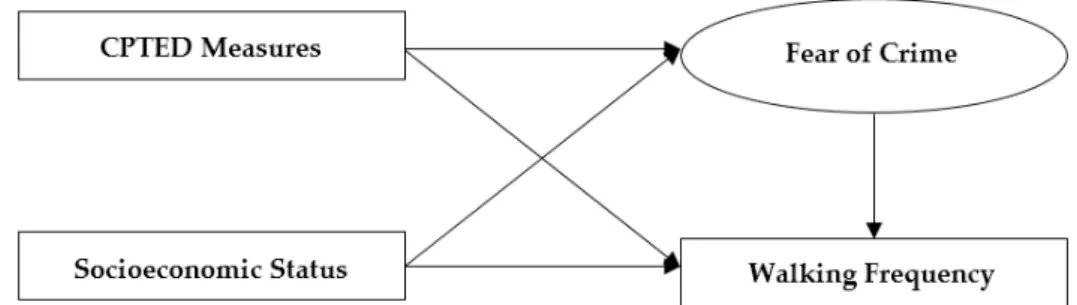
3. Conceptual Framework, Research Questions, and Hypotheses
the fear of crime, and a lower level of fear of crime would increase walking activities. Within this conceptual framework, this study attempted to answer the following research questions:
(1) Do CPTED Measures Mitigate Residents’ Fear of Crime?
CPTED measures—such as CCTV, street lighting, murals, paving patterns, community parks, community centers, and maintenance and occupancy (Figure2)—will likely decrease the fear of crime by enhancing CPTED constructs, including access control, natural surveillance, territoriality, activity support, and maintenance. We, therefore, expected to identify lower levels of fear of crime in locations where CPTED measures were applied.
(2) Do CPTED Measures Encourage Residents’ Walking Activities?
Based on previous findings that revealed an association between physical activity levels and perceived safety from crime [4,26], we anticipated that CPTED measures would encourage residents’ walking activities by reducing their fear of crime. We posited that CPTED measures, such as CCTV, street lighting, murals, paving patterns, community parks, and community centers, would directly mitigate residents’ fear of crime, as well as indirectly increase walking frequency due to reduced fear of crime.
Figure 1. Conceptual framework: walking behavior, socioeconomic status, fear of crime, and the role Figure 1.Conceptual framework: walking behavior, socioeconomic status, fear of crime, and the role of crime prevention through environmental design (CPTED) measures.
(a) (b) (c) (d)
(e) (f) (g) (h)
4. Setting and Method
4.1. Context
As the Korean economy rapidly grew in the 1960s, the city boundaries of Seoul expanded into surrounding areas. Occupying an area of 268.35 km2 in 1960, the city expanded to 605.25 km2 in 1995. During this period, the historic core of Seoul was developed across the Han River. Today, the Han River bisects Seoul into northern and southern halves. During the 1990s, the development policy disproportionally focused on the southern half, known as “Gangnam”. Consequently, Gangnam has been developed into a new economic core with affluent neighborhoods, while many districts in the northern half, “Gangbuk”, have deteriorated. For the most part, low-income neighborhood environments have been degraded through the lack of proper maintenance and investment. During the 1990s and 2000s, the most popular restoration approach to these dilapidated neighborhoods involved the demolition of old, low-density housing and the construction of high-density housing. This development pattern supported Korea’s real estate boom. However, such redevelopment evicted approximately 80% of original residents and destroyed the existing physical and social urban structures. To minimize the negative effects of the demolition-and-reconstruction redevelopment approach, the government has undertaken various types of urban rehabilitation plans, using resident participation. These participatory neighborhood regeneration projects typically aim to improve physical environments while maintaining old buildings and the urban fabric. Since most decrepit neighborhoods suffer from high crime rates, participatory neighborhood renovation projects generally incorporate CPTED to reduce crime and alleviate fear of crime.
4.2. Survey Design and Data
For this study, 12 neighborhoods in Seoul that implemented CPTED approaches were selected as the experimental group (Figure3). For the control group, we chose 12 matched neighborhoods adjacent to the CPTED neighborhoods in the experimental group. The control group neighborhoods had incomes, environments, and physical sizes similar to those in the experimental group. In each neighborhood in the experimental group, we identified approximately five locations where CPTED measures had been implemented, including murals, paving patterns, fence removal, and the development of public spaces, parks, and other community facilities (Figure2). Similarly, we chose approximately four or five locations in each neighborhood in the control group that represented the physical environments of typical neighborhoods.
The survey was conducted from 29 April to 20 May 2016. The sampling frame comprised the residents of the selected neighborhoods. The survey data collected included (1) socioeconomic and demographic characteristics; (2) behavioral characteristics (weekly walking trip frequency and daily walking time); and (3) levels of the fear of crime. We designed the survey instrument as a smartphone app. Surveyors recruited participants in the selected 102 locations. The survey was carried out from 10:00 a.m. to 3:00 p.m. daily during the three-week period. We attempted to recruit respondents 20 times in each location. If a pedestrian was a resident of the neighborhood and agreed to participate in the survey, the surveyor gave the person the smartphone app and asked him or her to complete the questionnaire by using the app. Each respondent spent approximately 5 min on average to complete the survey. Once the survey was completed, it was automatically sent to the researchers. In total, 623 individuals returned completed surveys, yielding a 30.5% response rate.
4.3. Measures and Descriptive Statistics
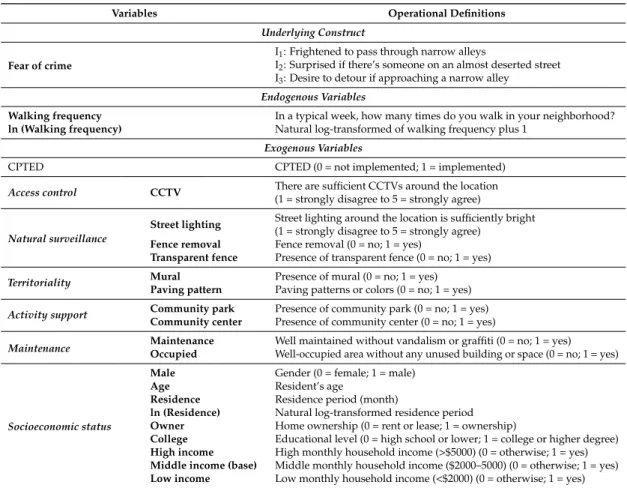
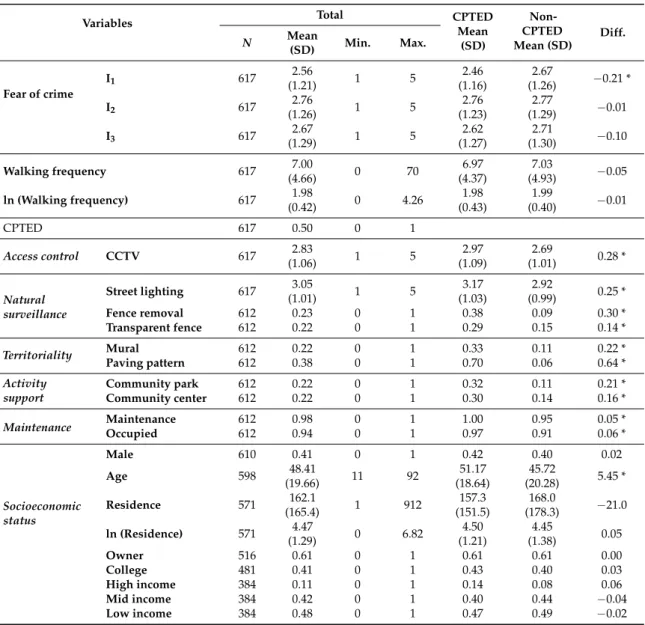
Table1 shows the operational definitions of the variables and indicators. Table 2includes descriptive statistics of the variables, based on CPTED and non-CPTED neighborhoods, andt-test results comparing the two groups. To extract the latent variable (fear of crime), we conducted factor analyses with indicators developed by Yang and Hong [35]. The indicators were designed to measure perceptional, emotional, and behavioral aspects of fear of crime on a five-point Likert scale. Our exploratory factor analysis and confirmatory factor analysis (Model 1 in Table3) identified the three indicators (shown in Table1) as valid for measuring the emotional aspects of fear of crime. Table2 shows that the three indicators of fear of crime have lower values in CPTED groups than in non-CPTED groups, while only one of the three reveals a statistical difference. An endogenous variable, walking frequency, denotes the number of unique pedestrians walking by a location. We log-transformed walking frequency because of its positively-skewed distribution (Table1). We identified no significant difference in walking frequency between the experimental and the control groups (Table2).
Exogenous variables include CPTED measures and socioeconomic status. About half of the survey locations were in participatory regeneration project sites that incorporated CPTED strategies. Among relevant CPTED measures, the participants evaluated the levels of effectiveness of CCTV and street lighting on a five-point Likert scale. Auditors recorded the presence of other CPTED measures in each location, such as murals, paving patterns, community parks, and community centers (see Figure2). These elements are often used to revitalize deteriorating Korean neighborhoods. Auditors identified that most of the locations were relatively well maintained, without vandalism or graffiti, and with high occupancy, without unused buildings or spaces. Among these measures, CCTVs (as surveillance devices) were expected to be symbolic barriers that would deter potential criminals. Street lighting, fence removals, and transparent fences were expected to reduce fear of crime by improving the visibility of activities on the streets, thus, enhancing natural surveillance. Murals and paving patterns were used as signs of territoriality and the sense of maintenance. We expected community parks and centers to support social activities, thereby alleviating the fear of crime. The absence of both incivilities (such as litter, graffiti, and vandalism) and vacant buildings was correlated with maintenance.
Table 1.Operational definitions of indicators and key variables.
Variables Operational Definitions
Underlying Construct
Fear of crime
I1: Frightened to pass through narrow alleys
I2: Surprised if there’s someone on an almost deserted street I3: Desire to detour if approaching a narrow alley
Endogenous Variables
Walking frequency In a typical week, how many times do you walk in your neighborhood?
ln (Walking frequency) Natural log-transformed of walking frequency plus 1 Exogenous Variables
CPTED CPTED (0 = not implemented; 1 = implemented)
Access control CCTV There are sufficient CCTVs around the location(1 = strongly disagree to 5 = strongly agree)
Natural surveillance
Street lighting Street lighting around the location is sufficiently bright
(1 = strongly disagree to 5 = strongly agree)
Fence removal Fence removal (0 = no; 1 = yes)
Transparent fence Presence of transparent fence (0 = no; 1 = yes) Territoriality Mural Presence of mural (0 = no; 1 = yes)
Paving pattern Paving patterns or colors (0 = no; 1 = yes) Activity support Community park Presence of community park (0 = no; 1 = yes)
Community center Presence of community center (0 = no; 1 = yes)
Maintenance MaintenanceOccupied Well maintained without vandalism or graffiti (0 = no; 1 = yes)Well-occupied area without any unused building or space (0 = no; 1 = yes)
Socioeconomic status
Male Gender (0 = female; 1 = male)
Age Resident’s age
Residence Residence period (month)
ln (Residence) Natural log-transformed residence period
Owner Home ownership (0 = rent or lease; 1 = ownership)
College Educational level (0 = high school or lower; 1 = college or higher degree)
High income High monthly household income (>$5000) (0 = otherwise; 1 = yes)
Middle income (base) Middle monthly household income ($2000–5000) (0 = otherwise; 1 = yes)
Low income Low monthly household income (<$2000) (0 = otherwise; 1 = yes)
The participants’ socioeconomic status included their gender, age, home ownership, length of residence in months, educational level, and monthly household income. Of the participants, 41% were male. The participants’ average age was 48.4 years old, and their average residence duration was 162.1 months (13.5 years). The residence period was log-transformed due to its positively-skewed distribution. About 61% of the respondents were homeowners, and 41% were at least college educated. Taking into account that many (237 out of 623) participants did not report their income levels, 11% earned high monthly incomes, and 48% belonged to the low-income group. The comparison revealed no significant socioeconomic differences between the CPTED and non-CPTED groups, except for the residents’ age, with the respondents from the CPTED neighborhoods tending to be older.
Table 2. Descriptive statistics of key variables, based on crime prevention through environmental design (CPTED) and non-CPTED neighborhoods.
Variables Total CPTED
Mean (SD) Non-CPTED Mean (SD) Diff. N Mean
(SD) Min. Max.
Fear of crime
I1 617 (1.21)2.56 1 5 (1.16)2.46 (1.26)2.67 −0.21 *
I2 617 (1.26)2.76 1 5 (1.23)2.76 (1.29)2.77 −0.01
I3 617 (1.29)2.67 1 5 (1.27)2.62 (1.30)2.71 −0.10
Walking frequency 617 7.00
(4.66) 0 70
6.97 (4.37)
7.03
(4.93) −0.05
ln (Walking frequency) 617 1.98
(0.42) 0 4.26
1.98 (0.43)
1.99
(0.40) −0.01
CPTED 617 0.50 0 1
Access control CCTV 617 2.83
(1.06) 1 5
2.97 (1.09)
2.69
(1.01) 0.28 *
Natural surveillance
Street lighting 617 3.05
(1.01) 1 5
3.17 (1.03)
2.92
(0.99) 0.25 *
Fence removal 612 0.23 0 1 0.38 0.09 0.30 *
Transparent fence 612 0.22 0 1 0.29 0.15 0.14 *
Territoriality Mural 612 0.22 0 1 0.33 0.11 0.22 *
Paving pattern 612 0.38 0 1 0.70 0.06 0.64 *
Activity support
Community park 612 0.22 0 1 0.32 0.11 0.21 *
Community center 612 0.22 0 1 0.30 0.14 0.16 *
Maintenance MaintenanceOccupied 612612 0.980.94 00 11 1.000.97 0.910.95 0.05 *0.06 *
Socioeconomic status
Male 610 0.41 0 1 0.42 0.40 0.02
Age 598 48.41
(19.66) 11 92
51.17 (18.64)
45.72
(20.28) 5.45 *
Residence 571 162.1
(165.4) 1 912
157.3 (151.5)
168.0
(178.3) −21.0
ln (Residence) 571 4.47
(1.29) 0 6.82
4.50 (1.21)
4.45
(1.38) 0.05
Owner 516 0.61 0 1 0.61 0.61 0.00
College 481 0.41 0 1 0.43 0.40 0.03
High income 384 0.11 0 1 0.14 0.08 0.06
Mid income 384 0.42 0 1 0.40 0.44 −0.04
Low income 384 0.48 0 1 0.47 0.49 −0.02
Notes: *p< 0.05, indicating significance levels of difference of means/proportions.
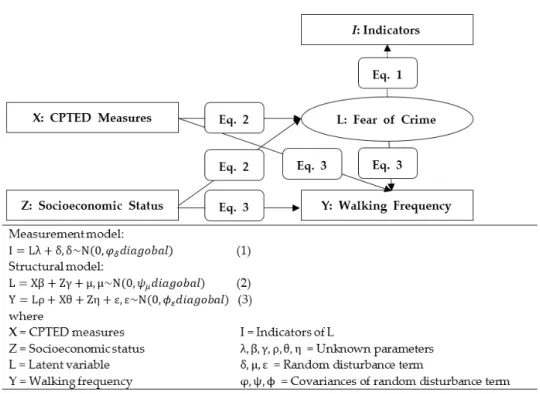
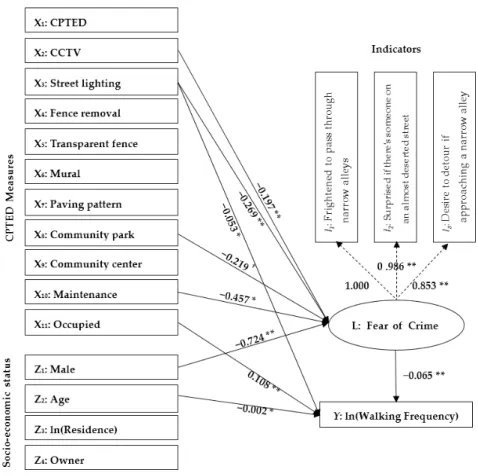
4.4. Behavioral Modeling
Figure 4. Path diagrams and equations of SEMs estimating relationships among CPTED measures Figure 4.Path diagrams and equations of SEMs estimating relationships among CPTED measures, fear of crime, and walking frequency.
5. Results
Table3presents the confirmatory factor analysis and SEM results. FigureA1in AppendixA illustrates the significant effects among the variables in the SEM. The college education and household income variables were excluded from the model due to their large number of missing values. To evaluate the influence of the exclusion, we compared our final model with a model that included college education and household income, imputing missing values. We decided to exclude the two variables because the comparison identified no critical differences between the two models.
The indicators’ significant and relatively large coefficients (greater than 0.8) in the confirmatory factor analysis (Model 1 in Table3) indicate their success in extracting the latent variable, fear of crime. The SEM employs confirmatory factor analysis as a measurement model (Model 2 in Table3). The chi-square test result shows a reasonable fit of the final SEM model. The values of the other fit indices of the SEM, such as the root mean square error of approximation (RMSEA), comparative fit index (CFI), Tucker-Lewis index (TLI), and standardized root mean square residual (SRMR), measure the model fit. Generally, RMSEA and SRMR values less than 0.05 suggest a good model fit. Additionally, CFI and TLI values greater than 0.95 indicate a good model fit [37]. Since all of the fit indices satisfy these guidelines, the SEM fits the data well.
Table 3.Confirmatory factor analysis (CFA) and structural equation model (SEM) results.
Model 1: CFA (n= 617) Model 2: SEM (n= 494)
Coef. (Robust SE) p-Value Coef. (Robust SE) p-Value
Measurement model
Latent variable: Fear of crime
I1: Frightened to pass through narrow alleys 1.000 1.000 I2: Surprised if there’s someone on
an almost deserted street 0.911 ** (0.067) 0.000 0.986 ** (0.063) 0.000
I3: Desire to detour if approaching
a narrow alley 0.800 ** (0.062) 0.000 0.853 ** (0.069) 0.000
Structural model
Exogenous variable: Fear of crime
CPTED 0.012 (0.139) 0.929
CCTV −0.197 ** (0.055) 0.000
Street lighting −0.269 ** (0.043) 0.000
Fence removal −0.107 (0.114) 0.347
Transparent fence 0.050 (0.115) 0.665
Mural 0.132 (0.111) 0.238
Paving pattern 0.066 (0.141) 0.640
Community park −0.219† (0.126) 0.081
Community center 0.180 (0.120) 0.132
Maintenance −0.457 * (0.223) 0.040
Occupied 0.110 (0.233) 0.636
Male −0.724 ** (0.088) 0.000
Age 0.003 (0.003) 0.353
ln (Residence) 0.025 (0.041) 0.551
Owner 0.003 (0.103) 0.973
Exogenous variable: ln (Walking frequency)
Fear of crime −0.065 ** (0.024) 0.008
CPTED −0.026 (0.052) 0.613
CCTV 0.015 (0.016) 0.340
Street lighting −0.053 * (0.021) 0.015
Fence removal 0.057 (0.049) 0.244
Transparent fence 0.034 (0.056) 0.549
Mural 0.046 (0.053) 0.388
Paving pattern −0.038 (0.052) 0.459
Community park −0.052 (0.048) 0.281
Community center 0.038 (0.057) 0.506
Maintenance 0.042 (0.043) 0.332
Occupied 0.108 ** (0.040) 0.007
Male −0.048 (0.038) 0.202
Age −0.002 * (0.001) 0.039
ln (Residence) 0.013 (0.016) 0.407
Owner 0.043 (0.033) 0.198
Constant 1.874 ** (0.107) 0.000
χ2(32) 48.144 0.033
RMSEA 0.032
CFI 0.977
TLI 0.952
SRMR 0.015
Notes:†p< 0.10; *p< 0.05; **p< 0.01; standard error (SE) adjusted for 102 clusters (locations).
Second, some variables are correlated with walking frequency. The effect of fear of crime on residents’ walking frequency is significant; people who are less afraid of crime tend to walk more frequently. Somewhat unexpectedly, the perceived sufficiency of street lighting is negatively correlated with walking frequency. Walking frequency is likely higher in occupied locations than in deteriorated locations with unused buildings or spaces. Additionally, older people tend to walk less frequently.
Since the direct effects of CCTV and maintenance on walking frequency are insignificant, their total effects are the same as their indirect effects. Thus, these CPTED measures (CCTV and maintenance) seem to contribute to alleviating the fear of crime, which eventually coaxes participants to walk more frequently. However, due to the negative direct effect of street lighting, its total effect on walking frequency is negative. A possible explanation for this negative total effect of street lighting may be that streetlights are generally installed in deserted places. Therefore, walking frequency in these locations may be lower because people avoid passing through deserted places even though streetlights help reduce fear of crime. Finally, being male has a positive indirect effect on walking frequency; male residents tend to walk more frequently since they feel less fearful of crime than female residents.
Table 4.Direct, indirect, and total effects of variables on walking frequency.
Indirect Effects
Direct Effects on Walking
Frequency
Total Effects on Walking Frequency Direct Effects
on Fear of Crime
Effects of Fear of Crime on Walking
Frequency
Indirect Effects on Walking
Frequency
CCTV −0.197 (−0.197)= 0.013×(−0.065) - 0.013
Street lighting −0.269 (−0.269)= 0.017×(−0.065) −0.053 −0.036
Maintenance −0.457 −0.065 (−0.457)= 0.030×(−0.065) - 0.030
Occupied - - 0.108 0.108
Male −0.724 (−0.724)= 0.047×(−0.065) - 0.047
Age - - −0.002 −0.002
Notes: only significant effects at the 0.05 alpha level are reported.
6. Implications and Conclusions
6.1. Implications
CPTED has become a popular urban planning approach to preventing crime and mitigating fear of crime by improving physical neighborhood environments. This strategy is widely used to improve deteriorated neighborhoods that suffer from crime. Residents of dilapidated neighborhoods are generally exposed to higher crime rates; hence, their fear of crime tends to be strong. Such environments jeopardize residents’ mental health and harm their physical health by discouraging physical activity. Thus, many neighborhood regeneration projects have incorporated CPTED measures to reduce crime rates, alleviate fear of crime, and eventually promote an active lifestyle by creating safe living environments. However, few studies have empirically examined the complex relationships among CPTED, fear of crime, and active living. Our study, therefore, investigated the effects of CPTED measures on walking frequency and fear of crime, analyzing behavioral data of residents living in participatory neighborhood regeneration project areas and matched neighborhoods. We used SEM, which could consistently estimate complex direct and indirect relationships between latent variables (fear of crime) and observable variables.
neighborhoods in Korea. As identified by previous studies [20,27], the level of maintenance is correlated with fear of crime; litter, graffiti, and vandalism (physical incivilities) tend to be correlated with higher levels of fear of crime. Finally, the model identifies the gender difference regarding fear of crime; women are more likely to have a higher level of fear of crime than men, which is consistent with previous findings [17,18,20].
We have also examined the environmental and psychological factors that affect residents’ walking behavior. The results indicate the influence of fear of crime on walking frequency; residents who are afraid of crime tend to walk less often. While people are inclined to walk more frequently around well-occupied locations without vandalism, graffiti, or abandoned buildings, most CPTED measures are not significantly correlated with walking frequency levels. Moreover, street lighting is negatively associated with walking frequency. This result is unexpected because street lighting is supposed to make walking easier and safer in the evening. On the other hand, it might be related to the complex effects of street lighting; streetlights are often located around deserted places, and better lighting might also make signs of disorder more visible [38]. However, the SEM did detect indirect and positive effects of CCTV, community parks (albeit weak), and maintenance on walking frequency through the alleviation of the fear of crime.
This study has implications for planning and policy issues regarding CPTED, mental health, and active living. In post-industrial cities, such as Seoul, the environmental degradation of old neighborhoods is a major challenge for urban planners and policymakers. Deteriorating neighborhoods are often accompanied by urban disorder, including economic decline, social segregation, high crime rates, and decreasing quality of life. To resolve these issues, renovation projects have included CPTED measures intended to improve physical environments and surveillance. Restoring physical elements, such as dilapidated walls and streets, using murals, and installing new pavements, are expected to create an impression of well-maintained neighborhoods and thus discourage crime and reduce fear of it. CPTED measures, such as fence removals and transparent fences, are used to improve natural surveillance. Local facilities, including community parks and centers, are also used to encourage social activities and, thus, minimize crime. However, these CPTED measures’ insignificant or marginal effects on the fear of crime and walking frequency, with the exception of CCTV and street lighting, suggest the inadequacy of these current rehabilitation approaches.
While CPTED measures have been widely used in Korea, limited research has empirically examined their effectiveness. As the results indicate that surveillance devices tend to be more effective in reducing fear of crime than urban planning and design approaches, our findings call for a more detailed examination of how CPTED measures influence human perceptions and behavior and how people respond to environmental attributes. Toward this end, a longitudinal investigation of actual crime records in CPTED areas and an evaluation of restoration projects based on residents’ responses are essential for improving CPTED approaches and creating safer and more active neighborhood environments.
6.2. Shortcomings and Future Research
from the former. Therefore, a more systematic and comprehensive data collection process should improve the study’s validity.
Another shortcoming was that the indicators, which were designed to capture perceptual, emotional, and behavioral aspects of fear of crime, were not successfully extracted, with the exception of the emotional dimension. Hence, we could not investigate perceptual and behavioral aspects of the fear of crime. Despite these limitations, our study sheds light on the complex relationships among CPTED measures, fear of crime, and walking activity.
In future studies, more effective indicators would enable researchers to explore different aspects of fear of crime. Moreover, because our research relied on non-randomized samples from low-rise, renovated, and deteriorated neighborhoods, future research in different contexts (for example, medium- or high-density neighborhoods) would improve the validity and generalizability of our findings and provide insights into the effectiveness of CPTED approaches in various settings. Finally, because of our study’s focus on Korean samples, its generalizability is limited to low-rise neighborhoods in Asian cities similar to Seoul. Parallel studies in different contexts should enhance the external validity of the findings.
Acknowledgments:This research was supported by the National Research Foundation of Korea’s (NRF) Basic Science Research Program funded by the Ministry of Science, ICT, & Future Planning (2013R1A1A1057772).
Author Contributions:Jae Seung Lee proposed the original idea and carried out the data analysis. Sungjin Park advised on the theoretical framework and methodological approaches. Sanghoon Jung reviewed and edited the manuscript. All authors have reviewed and approved the final manuscript.
Conflicts of Interest:The authors declare no conflict of interest.
Appendix A
:
References
1. Cozens, P.M.; Saville, G.; Hillier, D. Crime prevention through environmental design (CPTED): A review and modern bibliography.Prop. Manag.2005,23, 328–356. [CrossRef]
2. Kim, D.-K.; Yoon, Y.-J.; Ahn, K.-H. A Study on Urban Crime in Relation to Land Use Patterns.J. Korea Plan.
2014,49, 151–167. (In Korean)
3. Marzbali, M.H.; Abdullah, A.; Razak, N.A.; Tilaki, M.J.M. The influence of crime prevention through environmental design on victimisation and fear of crime.J. Environ. Psychol.2012,3, 79–88. [CrossRef] 4. Oyeyemi, A.L.; Adegoke, B.O.; Sallis, J.F.; Oyeyemi, A.Y.; De Bourdeaudhuij, I. Perceived crime and traffic
safety is related to physical activity among adults in Nigeria.BMC Public Health2012,12, 294–305. [CrossRef] [PubMed]
5. Marzbali, M.H.; Abdullah, A.; Razak, N.; Tilaki, M. Validating crime prevention through environmental design construct through checklist using structural equation modelling.Int. J. Law Crime Justice2012,40, 82–99. [CrossRef]
6. Abdullah, A.; Marzbali, M.H.; Tilaki, M. Predicting the influence of CPTED on perceived neighbourhood cohesion: Considering differences across age.J. Environ. Psychol.2013,36, 54–64. [CrossRef]
7. Kasuya, T.; Tamagawa, H. A study on the relations between criminal behaviors in purse-snatching and urban spaces.Int. J. Urban Sci.2012,16, 279–300. [CrossRef]
8. Sakip, S.; Abdullah, A. Measuring crime prevention through environmental design in a gated residential area: A pilot survey.Procedia Soc. Behav. Sci.2012,42, 340–349. [CrossRef]
9. Jeffery, C.R.Crime Prevention through Environmental Design; Sage Publications: London, UK, 1977. 10. Jacobs, J.The Death and Life of Great American Cities; Vintage Books: New York, NY, USA, 1961.
11. Moffatt, R.E. Crime prevention through environmental design-a management perspective.Can. J. Criminol.
1983,25, 19–31.
12. Newman, O.Defensible space: Crime Prevention through Urban Design; Macmillan: New York, NY, USA, 1972. 13. Wilson, J.Q.; Kelling, G.L. Broken windows.Atl. Mon.1982,249, 29–38.
14. Perkins, D.D.; Meeks, J.W.; Taylor, R.B. The physical environment of street blocks and resident perceptions of crime and disorder: Implications for theory and measurement.J. Environ. Psychol.1992,12, 21–34. [CrossRef] 15. Perkins, D.; Wandersman, A.; Rich, R.; Taylor, R. The physical environment of street crime: Defensible space,
territoriality and incivilities.J. Environ. Psychol.1993,13, 29–49. [CrossRef]
16. Montoya, L.; Junger, M.; Ongena, Y. The relation between residential property and its surroundings and day-and night-time residential burglary.Environ. Behav.2014,25, 1–35. [CrossRef]
17. Warr, M. Fear of victimization: Why are women and the elderly more afraid? Soc. Sci. Quart. 1984,65, 681–702.
18. Schafer, J.A.; Huebner, B.M.; Bynum, T.S. Fear of crime and criminal victimization: Gender-based contrasts.
J. Crim. Justice2006,34, 285–301. [CrossRef]
19. Roman, C.G.; Chalfin, A. Fear of walking outdoors: A multilevel ecologic analysis of crime and disorder.
Am. J. Prev. Med.2008,34, 306–312. [CrossRef] [PubMed]
20. Abdullah, A.; Marzbali, M.H.; Tilaki, M.J.M.; Bahauddin, A. An assessment of the incivilities thesis: Examining gender differences.Int. J. Arts Sci.2014,7, 27–40.
21. Jackson, J. Validating new measures of the fear of crime.Int. J. Soc. Res. Meth.2005,8, 297–315. [CrossRef] 22. Covington, J.; Taylor, R. Fear of crime in urban residential neighborhoods.Sociol. Quart.1991,32, 231–249.
[CrossRef]
23. Austin, D.M.; Furr, L.A.; Spine, M. The effects of neighborhood conditions on perceptions of safety.
J. Crim. Justice2002,30, 417–427. [CrossRef]
24. Kim, J.W.; Schweitzer, J.H.; Kim, M.J. The relationship of community characteristics to actual and perceived crime in urban neighborhoods.Int. J. Urban Sci.2002,6, 119–131. [CrossRef]
25. Tay, R.; Azad, A.; Wirasinghe, S.C.; Hansen, S. Analysis of the influence of urban rail stations on neighbourhood crime.Int. J. Urban Sci.2013,17, 281–289. [CrossRef]
26. Marzbali, M.H.; Abdullah, A.; Tilaki, M.J.M. The effectiveness of interventions in the built environment for improving health by addressing fear of crime.Int. J. Law Crim. Justice2016,45, 120–140. [CrossRef] 27. Medway, D.; Parker, C.; Roper, S. Litter, gender and brand: The anticipation of incivilities and perceptions of
28. Valera, S.; Guàrdia, J. Perceived insecurity and fear of crime in a city with low-crime rates.J. Environ. Psychol.
2014,38, 195–205. [CrossRef]
29. Hallal, P.C.; Reis, R.S.; Parra, D.C.; Hoehner, C.; Brownson, R.C.; Simões, E.J. Association between perceived environmental attributes and physical activity among adults in Recife, Brazil.J. Phys. Act. Health2010,7, S213–S222. [CrossRef] [PubMed]
30. Wallmann, B.; Bucksch, J.; Froboese, I. The association between physical activity and perceived environment in German adults.Eur. J. Public Health2012,22, 502–508. [CrossRef] [PubMed]
31. Miles, R. Neighborhood disorder, perceived safety, and readiness to encourage use of local playgrounds.
Am. J. Prev. Med.2008,34, 275–281. [CrossRef] [PubMed]
32. Weden, M.M.; Carpiano, R.M.; Robert, S.A. Subjective and objective neighborhood characteristics and adult health.Soc. Sci. Med.2008,66, 1256–1270. [CrossRef] [PubMed]
33. Lee, C.G.; Cho, Y. Relationship between perceived neighborhood characteristics and vigorous physical activity among adult Seoul residents.J. Prev. Med. Public Health2009,42, 215–222. [CrossRef] [PubMed] 34. Arango, C.M.; Páez, D.C.; Reis, R.S.; Brownson, R.C.; Parra, D.C. Association between the perceived
environment and physical activity among adults in Latin America: A systematic review.Int. J. Behav. Nutr. Phys. Act.2013,10, 122–130. [CrossRef] [PubMed]
35. Yang, M.J.; Hong, S.Y. Likert type scale construction to fear about crime.Soc. Sci. Stud.2007,46, 191–222. (In Korean)
36. Golob, T.F. Structural equation modeling for travel behavior research.Transp. Res. B Meth.2003,37, 1–25. [CrossRef]
37. Hu, L.T.; Bentler, P.M. Cutoff criteria for fit indexes in covariance structure analysis: Conventional criteria versus new alternatives.Struct. Equ. Model. Multidiscip. J.1999,6, 1–55. [CrossRef]
38. Herbert, D.; Davidson, N. Modifying the built environment: The impact of improved street lighting.Geoforum
1995,25, 339–350. [CrossRef]