The Agilent SurePrint G3 Human Catalog 1x1M, 2x400K, 4x180K, and 8x60K CGH Microarrays contain four times more empirically validated probes for detecting copy number variation than the corresponding legacy 1x244K, 2x10⁵K, 4x44K, and 8x15K SurePrint HD arrays. The SurePrint G3 CGH microarrays utilize the industry’s highest fi delity long-mer probes resulting in the most accurate detection of copy number measurements. The Agilent CGH platform consists of fl exible multi-pack formats for both catalog and custom arrays and enables copy number analysis of most sample types, including FFPE, using the robust DNA Analytics analysis tool. The quality, fl exibility, and complete workfl ow combine to make Agilent CGH microarrays the highest performing copy number solution.
Product Note
Introduction
Agilent has consistently provided powerful catalog and custom arrays for the study of copy number changes using array comparative genomic hybridization (aCGH). The Agilent CGH offering now includes higher density by the introduction of the 1x1M, 2x400K, 4x180K, and 8x60K formats, also known as SurePrint G3 Microarrays. The SurePrint G3 Microarrays continue Agilent’s record for high sensitivity and high specifi city while increasing resolution to map copy number aberration breakpoints, identify smaller gains and losses, and provide more comprehensive whole genome coverage. These newer formats are still printed on 1 in. x 3 in. glass slides and are compatible with the standard hybridization gaskets and chambers. SurePrint G3 CGH Microarrays are scanned at 3 microns using the Agilent SureScan Microarray Scanner (G4900DA). Feature Extraction (part of Agilent CytoGenomics or Agilent Genomic Workbench) then seamlessly translates the resulting image into log ratios and uses advanced statistical analysis to associate these with correlative QC metrics. Results can be further analyzed and displayed for biological interpretation in Agilent CytoGenomics or DNA Analytics (part of Agilent Genomic Workbench).
“The new Agilent 1M CGH ar- ray combines the excellent probe design and performance character- istics of the Agilent aCGH platforms with a million feature microarray resulting in extremely clean data and a functional resolution of 4kb that far exceeds any platform we have tested to date.”
Jonathan Keats, PhD Research Fellow Mayo Clinic Arizona
“We have recently tested the new Agilent one million probe human CGH arrays using genomic DNA isolated from both normal and tumor tissue specimens. The increase in probe density has allowed us to identify precise margins of chromosome aberrations that defi ne specifi c breakpoints, regions of minimal deletion, and tightly focused amplicons. Agilent’s one million arrays provide the benefi t of more genomic content with the same acquisition of high quality data that we have experienced with earlier formats.”
Angela S. Baker, Ph.D., Staff Biologist Laboratory of John D. Carpten, Ph.D. Translational Genomics Research Institute (TGen)
We developed a database of 28 million distinct oligonucleotide probes suitable for aCGH at median spacing of less than 100 bp within the non-repeat masked regions of the genome. Probes were selected using an empirical model that applies scores for homology, thermodynamics, secondary structure and sequence complexity. The catalog 1x1M, 2x400K, 4x180K, and 8x60K arrays were designed from this probe database. The entire database of over 28 million probes, including all catalog probes, are available in eArray, a free web tool provided by Agilent for the design of custom microarrays. Genomic DNA from blood, cells, tissues, and FFPE can be utilized with these arrays to answer your biological questions.
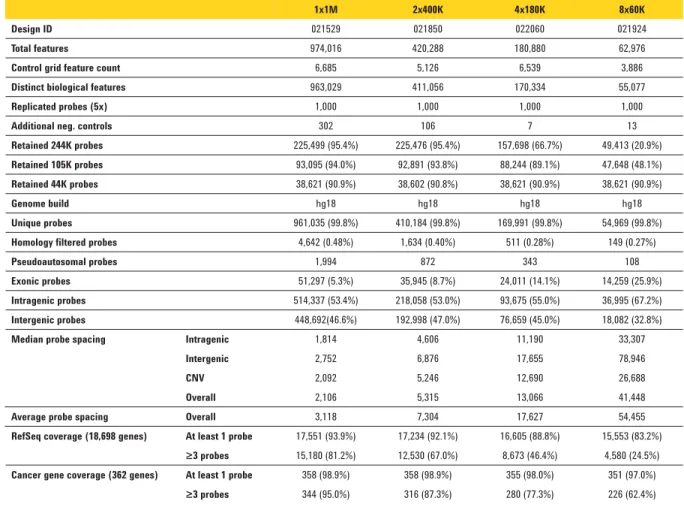
Table 1. Microarray specifi cations
Together with Agilent CytoGenomics or Agilent Genomic Workbench, Agilent SurePrint G3 Human CGH Microarrays allow you to interrogate more of the genome at a lower cost, enabling you to take your research farther.
Microarray Specifi cations
Table 1 lists the microarray specifi cations. These new catalog designs contain new probes in both the coding and non-coding regions of the genome, pseudoautosomal regions, and sub- telomeric regions. In addition, the vast majority of the probes from the 244K and 44K legacy arrays are also present for backwards compatibility. The increased density results in 2.1-kb
median probe spacing on the SurePrint G3 CGH 1x1M Microarray, allowing for the detection of smaller, more focal amplifi cations and deletions (see Biological Results section below). Microarray Performance
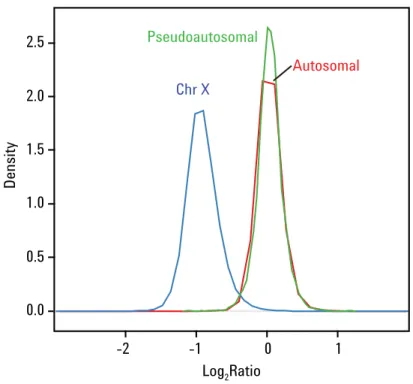
The Agilent SurePrint G3 Human Catalog CGH Microarrays provide accurate copy number measurements, as illustrated in Figure 1. By using a Male/Female model system, the log ratio accuracy and detection sensitivity can be determined. Figure 1 shows the separation between the autosomal and X chromosome probe log2 ratios (Area under ROC curve of 98%). In addition, the log2 ratio distributions are centered on the
1x1M 2x400K 4x180K 8x60K
Design ID 021529 021850 022060 021924
Total features 974,016 420,288 180,880 62,976
Control grid feature count 6,685 5,126 6,539 3,886
Distinct biological features 963,029 411,056 170,334 55,077
Replicated probes (5x) 1,000 1,000 1,000 1,000
Additional neg. controls 302 106 7 13
Retained 244K probes 225,499 (95.4%) 225,476 (95.4%) 157,698 (66.7%) 49,413 (20.9%)
Retained 105K probes 93,095 (94.0%) 92,891 (93.8%) 88,244 (89.1%) 47,648 (48.1%)
Retained 44K probes 38,621 (90.9%) 38,602 (90.8%) 38,621 (90.9%) 38,621 (90.9%)
Genome build hg18 hg18 hg18 hg18
Unique probes 961,035 (99.8%) 410,184 (99.8%) 169,991 (99.8%) 54,969 (99.8%)
Homology fi ltered probes 4,642 (0.48%) 1,634 (0.40%) 511 (0.28%) 149 (0.27%)
Pseudoautosomal probes 1,994 872 343 108
Exonic probes 51,297 (5.3%) 35,945 (8.7%) 24,011 (14.1%) 14,259 (25.9%)
Intragenic probes 514,337 (53.4%) 218,058 (53.0%) 93,675 (55.0%) 36,995 (67.2%)
Intergenic probes 448,692(46.6%) 192,998 (47.0%) 76,659 (45.0%) 18,082 (32.8%)
Median probe spacing Intragenic 1,814 4,606 11,190 33,307
Intergenic 2,752 6,876 17,655 78,946
CNV 2,092 5,246 12,690 26,688
Overall 2,106 5,315 13,066 41,448
Average probe spacing Overall 3,118 7,304 17,627 54,455
RefSeq coverage (18,698 genes) At least 1 probe 17,551 (93.9%) 17,234 (92.1%) 16,605 (88.8%) 15,553 (83.2%)
≥3 probes 15,180 (81.2%) 12,530 (67.0%) 8,673 (46.4%) 4,580 (24.5%)
Table 2. QC results for Agilent SurePrint G3 Catalog CGH 1x1M Microarrays. Average scores are provided along with standard deviations across 4 normal female samples hybridized against normal male samples and a range of tumor and cytogenetic samples labeled with the Genomic DNA Enzymatic Labeling kit (n=18).
0.0 0.5 1.0 1.5 2.0 2.5
-2 -1 0 1
Log2Ratio
Density
Autosomal Chr X
Pseudoautosomal
Figure 1. A representative separation histogram showing the distribution of log2 ratio values for X chromosome probes (blue), pseudoautosomal probes (green) and autoso- mal probes (red) from an XY/XX hybridization on the Agilent SurePrint G3 Catalog CGH 1x1M CGH Microarray (P/N G4447A).
expected values of 0 for the autosomal probes (corresponding to two copies) and –1 for the X chromosome probes (corresponding to one copy). The pseudoautosomal probes are plotted separately so as not to result in false positive values on the X chromosome, since they are represented on both chromosomes X and Y and therefore are expected to have a log2 ratio of 0. The QC metrics from DNA Analytics (part Agilent Genomic Workbench) are listed in Table 2. These results were generated using the Agilent Oligonucleotide Array-Based CGH for Genomic DNA Analysis, Enzymatic Labeling for Blood, Cells or Tissue with a High Throughput option version 6 User Manual. This assay is similar
1x1M Male-Female
(n=4)
All samples (n=18)
DLRSpread 0.17±0.01 0.19±0.03
SignalToNoiseGreen 58.1±10.4 59.0±13.3 SignalToNoiseRed 55.7±3.9 53.8±8.5 SignalIntensityGreen 120.7±7.9 142.3±22.8 SignalIntensityRed 175.8±9.1 192.1±33.6
BGNoiseGreen 2.2±0.6 2.6±1.0
BGNoiseRed 3.2±0.4 3.6±0.8
ReproducibilityGreen 9.8±0.7 9.8±1.0 ReproducibilityRed 10.3±0.9 10.7±1.0
AreaUnderROC 0.98±0.003 na
MedianDiff 0.95±0.014 na
to the legacy assay recommended with the SurePrint HD arrays, with improvements discussed below. The new SurePrint G3 microarrays show a similar performance as the legacy SurePrint HD arrays across a variety of sample types.
Biological Results
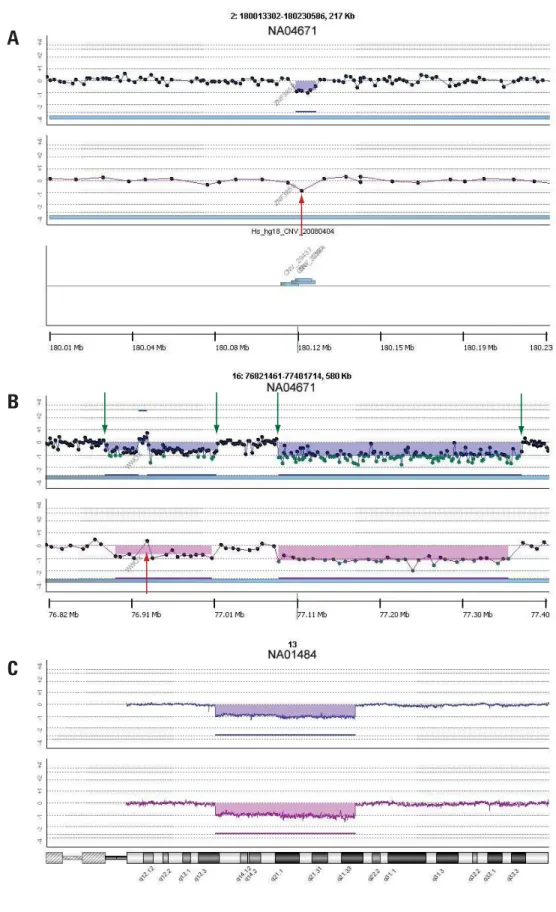
Agilent SurePrint G3 Human Catalog CGH Microarrays can be used for many different types of applications such as cancer biology and cytogenetics. The ability to accurately detect and quantify microdeletions and microamplifi cations is key to understanding the biology in these applications. Using the SurePrint G3 Catalog CGH 1x1M Microarray on a Burkitt lymphoma tumor sample,
a small deletion on chromosome 2 predicted by a single probe on the 244K microarray was confi rmed by six probes clearly delineating the breakpoints (Figure 2A). The complex structure of multiple aberrations within the WWOX gene region in the Burkitt lymphoma sample was clarifi ed on the SurePrint G3 Catalog 1x1M Microarray due to the higher density of probe coverage (Figure 2B). The improvements in density did not compromise performance. As can be seen in the retinoblastoma sample, the response to copy number was maintained in the SurePrint G3 Catalog CGH 1x1M Microarray, such that the log2 ratio for a hemizygous deletion on chromosome 13 was presented as expected at –1 (Figure 2C).
A
B
C
Figure 2. DNA Analytics views of Agilent SurePrint G3 CGH 1x1M and SurePrint HD 244K Microarrays. (A) Confi rmation of single probe call (red arrow) on 244K microarray with a six probe call (~10 Kb) on the SurePrint G3 CGH 1x1M Microarray. Deletion overlaps with a known Copy Number Variant (CNV) region from Toronto Database of Genomic Variants. (B) Refi nement of breakpoints (green arrows) and structure (red arrow) in WWOX gene in a Burkitt Lymphoma sample. (C) A Retinoblastoma sample (NA01484) showing that the response to copy number was maintained in the SurePrint G3 Catalog CGH 1x1M Microarray, 0.2 Mb moving average. DNA Analytics settings: ADM-2, threshold 5, fi lter: 2 probes, 0.25 log2 ratio.
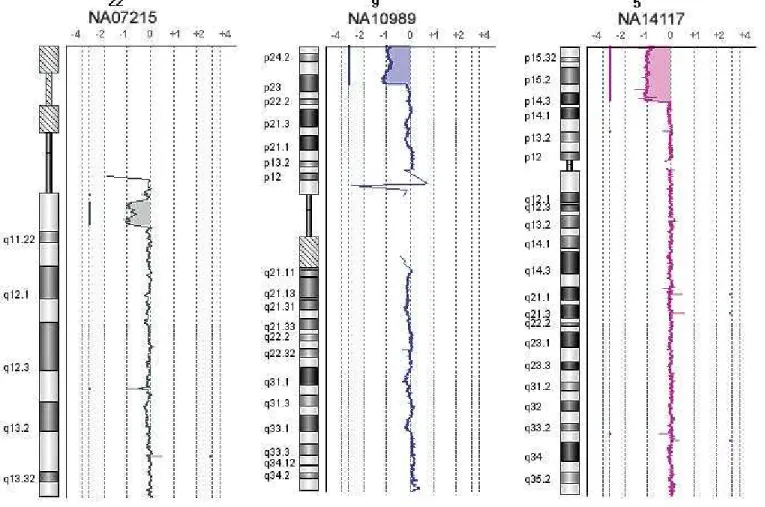
Figure 3. DNA Analytics views of Agilent SurePrint G3 CGH 1x1M Microarrays across a spectrum of cytogenetics samples. From left to right: NA07215, NA10989, and NA14117. All aberrations are consistently and confi dently identifi ed based on published information. DNA Analytics settings: ADM-2, threshold 5, fi lter: 2 probes, 0.25 log2 ratio, 0.2 Mb moving average.
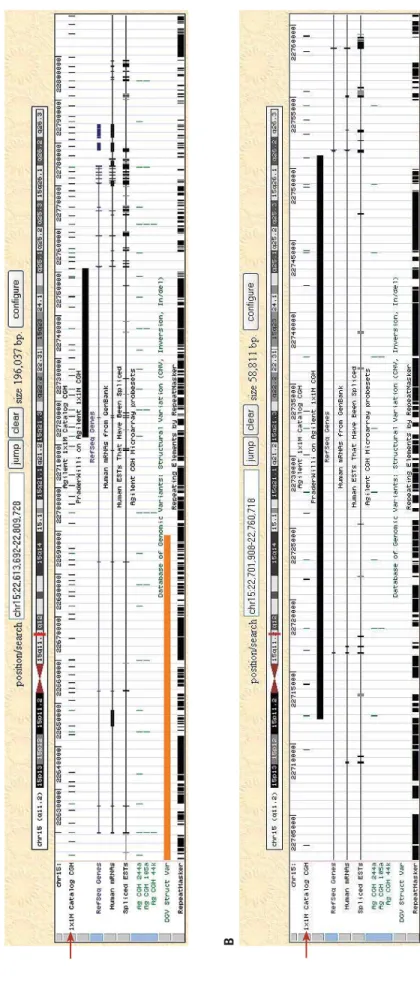
Data from samples containing known cytogenetic aberrations are displayed in Figure 3. The expected gains and losses were consistently and confi dently identifi ed based on published information. Another way to view the results is within the UCSC Genome Browser. Figure 4 (see page 6) shows a Prader-Willi Syndrome sample containing the deletion of an exon in
the SNRPN gene on Chromosome 15 as indicated by the black bar. This focal deletion was undetectable on the 44K array due to lower probe coverage (data not shown). These data illustrate that the SurePrint G3 CGH 1x1M Microarray provides the combined advantage of increased coverage and higher density with consistent and excellent performance.
Figure 4. UCSC Genome Browser views of NA13555. Aberrations were loaded into UCSC browser in BED fi le format. Agilent 1x1M catalog CGH probes are displayed above aberration (see red arrow). Legacy Agilent catalog probes are displayed in green. (A) ~200-kb window show SNRPN gene. (B) Zoomed-in view of deleted region (~60 kb).
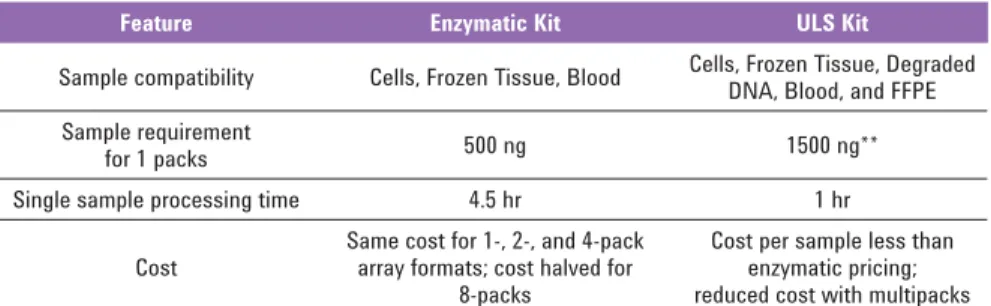
Improved Assay Throughput Agilent offers two genomic DNA labeling options: enzymatic and ULS. The enzymatic option uses a random-primed Klenow fi ll-in based incorporation of Cy-3 or Cy-5 labeled dUTPs. The ULS or Universal Linkage System utilizes a non-enzymatic method to directly label genomic DNA with fl uorescent dyes. Table 3 compares the two methods and researchers can choose between the two based on their experimental needs.
Both User Manuals (Agilent
Oligonucleotide Array-Based CGH for Genomic DNA Analysis, Enzymatic Labeling for Blood, Cells or Tissue with a High Throughput option version 6 or higher and Agilent Oligonucleotide Array-Based CGH for Genomic DNA Analysis, ULS Labeling for Blood, Cells, Tissue, or FFPE with a High Throughput
Conclusion
The SurePrint G3 CGH Microarrays combine the advantages of increased coverage and higher density with consistent and excellent performance. They have been shown to provide performance similar to the legacy SurePrint HD microarrays across a wide range of applications, includ- ing cancer biology and cytogenetics, where accurate detection and quantifi - cation of microdeletions and microam- plifi cations is of key importance. The SurePrint G3 CGH Microarrays contin- ue Agilent’s record for high sensitivity and high specifi city, while increasing resolution to map copy number aberra- tion breakpoints, identify smaller gains and losses, and provide more com- prehensive whole genome coverage. The quality, fl exibility, and complete workfl ow combine to make Agilent’s CGH Microarrays the highest perform- ing copy number solution.
Table 3. Comparison of Enzymatic and ULS Labeling Methodologies*
Feature Enzymatic Kit ULS Kit
Sample compatibility Cells, Frozen Tissue, Blood Cells, Frozen Tissue, Degraded DNA, Blood, and FFPE Sample requirement
for 1 packs 500 ng 1500 ng**
Single sample processing time 4.5 hr 1 hr
Cost
Same cost for 1-, 2-, and 4-pack array formats; cost halved for
8-packs
Cost per sample less than enzymatic pricing; reduced cost with multipacks
* For more detailed information and guidance on the labeling kits, please see the User Manuals.
** 2000 ng input gDNA required for FFPE samples
option version 3 or higher) contain updates for processing the SurePrint G3 CGH Microarrays. In addition, both methods support processing samples in 96-well plates. For the enzymatic method, the SureTag DNA Labeling Kit (5190-3400) is available, and Agilent also recommends the GE Healthcare 96-well plates (AutoScreen-96A part number 25-9005-98) for high-throughput purifi cation of enzymatically labeled gDNA. For the ULS method, there are two kits available: Genomic DNA High-Throughput ULS Labeling kit (5190-0450) and Genomic DNA 96-well Purifi cation Module (5190-0451). The Genomic DNA High-Throughput ULS Labeling kit contains higher volumes to allow for processing of more samples using the ULS methodology. The Genomic DNA 96-well Purifi cation Module contains a 96-well purifi cation plate, wash plate, and collection plate.
www.agilent.com/chem/xxxxx
© Agilent Technologies, Inc., 2008 Published in Country, Month xx, 2008 Publication Number xxxx-xxxxEN
For more information and to learn more: www.agilent.com/genomics
Find an Agilent customer center in your country:
www.agilent.com/genomics/contact U.S. and Canada
1-800-227-9770
[email protected] Asia Pacifi c
[email protected] Europe
This item is not approved for use in diagnostic procedures. User is responsible for obtaining regulatory approval or clearance from the appropriate authorities prior to diagnostic use.
Agilent Technologies shall not be liable for errors contained herein or for incidental or consequential damages in connection with the furnishing, performance, or use of this material.
© Agilent Technologies, Inc. 2011 Published in the U.S.A., December 16, 2011 5990-3368EN
Based CGH for Genomic DNA Analysis, Enzymatic Labeling for Blood, Cells or Tissue with a High Throughput Option, version 6 or higher (Publication No. G4410- 90010) and Agilent Oligonucleotide Array-Based CGH for Genomic DNA Analysis, ULS Labeling for Blood, Cells, Tissue, or FFPE with a High Throughput Option, version 3 or higher (Publication No. G4410-90020) are system guides containing Agilent- recommended aCGH procedures for sample preparation, microarray processing, and data extraction. They are available for download at www.agilent.com/genomics/ microarrays.
SurePrint G3 Human CGH Microarray 1x1M 1 5 G4447A
SurePrint G3 Human CGH Microarray 2x400K 2 5 G4448A
SurePrint G3 Human CGH Microarray 4x180K 4 3 G4449A
SurePrint G3 Human CGH Microarray 8x60K 8 3 G4450A
SurePrint G3 Custom CGH Microarray 1x1M 1 1 G4123A
SurePrint G3 Custom CGH Microarray 2x400K 2 1 G4124A
SurePrint G3 Custom CGH Microarray 4x180K 4 1 G4125A
SurePrint G3 Custom CGH Microarray 8x60K 8 1 G4126A
NOTE: Microarrays are shipped with foil seal. After breaking the foil, store microarrays at room temperature, in the dark, under a vacuum desiccator or in an N2 purge box. Do not expose microarrays to open air during storage.
Required Agilent CGH Processing Components
Description Part Number
SureTag Complete DNA Labeling Kit 5190-4240
Human Cot-1 DNA 5190-3393
Genomic DNA ULS Labeling Kit 5190-0419
Genomic DNA Purifi cation Module (for ULS labeling) 5190-0418 Genomic DNA High-Throughput ULS Labeling Kit 5190-0450 Genomic DNA 96-well Purifi cation Module
(for ULS labeling) 5190-0451
Agilent Oligo aCGH Hybridization Kit (25) or (100) 5188-5220 or 5188-5380 Agilent Oligo aCGH Wash Buffer 1 and 2 Set 5188-5226
Hybridization Chamber, stainless G2534A
Hybridization Chamber Gasket Slides Part number varies by array format and quantity
Hybridization Oven G2545A
Hybridization Oven Rotator Rack G2530-60029
SureScan Microarray Scanner G4900DA
Agilent CytoGenomics G1662AA–G1667AA
DNA Analytics G4172AA
* Feature Extraction software can be purchased separately.
Optional CGH Processing Components
Description Part Number
Agilent Oligo aCGH Wash Buffer 1, 4L 5188-5221 Agilent Oligo aCGH Wash Buffer 2, 4L 5188-5222 Stabilization and Drying Solution, 500 ML 5185-5979
AutoScreen-96A Well plates GE Healthcare p/n 25-9005-98