Spectroscopic study
on forbidden magnetic dipole transitions
in LHD
Ryuji Katai
Doctor of Science
Department of Fusion Science
School of Physical Science
The Graduate University for Advanced Studies
2006 School year
Abstract
Forbidden lines arising from magnetic dipole (M1) transitions among fine-structure levels of highly charged ions have been observed for Al, Ar, Ti, Fe, Kr, Mo and Xe in Large Helical Device (LfD). A space-resolved 3m normal incidence VIJV spectrometer and newly designed double-structure impurity pellets for an impurity pellet injector have been developed for this purpose. The Ml transitions are identified by analyzing their Doppler broadening, temporal intensity behavior and spatial intensity distribution. Wavelengths of these Ml transitions are determined with high accuracy and compared with previous experimental and calculated values with detailed spectroscopic analysis of C, Ne and Ar emission lines in range of 250 to 2300A. The Ml transitions from heavy elements observed here are expected to be useful for visible impurity diagnostics of D-T burning plasmas in the future.
The line intensity ratios of the Ml transition to the allowed (El) transition such as 2s22ps 'Pr,r-'Pr,, I 2s22ps 2p3p-2s2pu 'sr,, (Arx 5fi3L/l6sA, tixry 2lni\/122i^ and, FeXVII
975N94A) and 2s2p'P,-'P, I 2s2 tso- 2s2p tp, lArxv 5944A/221A) are measured as a function of electron density. Results on the ArX and ArXV are compared with a simple level-population calculation. As a result, the density dependence of the ratio is well explained mainly by a competition between two decay processes of the collisional de-excitation and the radiative decay due to the forbidden line emission. The effect of fast ions on the Ml transition is also considered.
Contents
l. Introduction... ... I
I .1. Importance of impurity study in controlled thermonuclear fusion research ... I
1.2. Transition probability and selection rules for allowed and forbidden fansitions ... 2
1.3. History of forbidden lines study ... 5
1.4. Application of magnetic forbidden dipole ffansitioris to plasma diagnostics ... 8
References... ... l0 2. Experimental setup ... .... 12
2.1. 3m normal incidence spectrometer ... ... 12
2.1.1 Introduction ... ...l2 2.1.2. Space-resolved 3m VUV spectrometer... ... 13
2.1.3. Radial profile measurement 2.1.4. Summary ...22
2.2. Heary element impurity pellet injection ... 25
References ... ...32
3. Observation of spectra ...34
3.1. High-resolution VUV specfta of carbon, neon and argon ... 34
3.1.1. Introduction ... ... 34
3.1.2. Line identification of C, Ne andAr ... 36
3.1.3. Ion temperature from Doppler broade,ning ... ... 37
3.1.4. Line profile analysis of absorption spectra ... 39
3.1.5. Summary ... 44
3.2. Identification of Ml lines ofAl, fu, Ti and Fe ... 71
3.2.1. Introduction ... ...71
3.2.2. Instrumentation ... ...: ...72
3.2.3. Identification of Ml transitions ... ...73
3.2.4. Summary ...78
3.3. Ml lines ofhrgh-Z elements (Ik, Mo and Xe) ... 82
3.3.1. Introduction ... ...82
3.3.2. Experimental setup ... 83
3.3.3. Results and discussion ... 84
3.3.4. Summary ... 88
References... ... 90
4. Intensity analysis on Ml transitions ... ... 95
4.1. Introduction... ... 95
4.2. Analysis of line intensity ratios ...97
4.3. Line ratio of Flike ions (ArX, TiXIV and FeXVIID ... ... 99
4.4. Line ratio of Belike ion (ArXV) ... ... 109
4.5. Summary ... ll2
'tll-
Ref er enc es . . . ¨. . ¨“ ・・¨ ¨¨ ¨ ¨ ¨・・・・¨ ¨ ¨ ・・¨ ・・・・¨ ¨ ・・¨ ¨ ¨ ・・¨ ・・・・“ ¨ ・・¨ ・・" " ・・¨ ¨ ¨ ¨ ・・¨ ・・¨ ¨ ¨ ¨ ¨ ¨ ¨ ¨ ・・・・¨ ¨ ¨ ・・¨ ・・115 5。 Sul l unar y and c onc l us i bns . ¨ ¨ ¨ " ¨ “ ・・¨ ¨ ・・¨ ¨ ¨ ¨ ・・・・・・・・・・" ・・¨ ¨ ¨ ¨ ¨ ・・・・¨ ¨ ¨ ¨ ・・・・¨ ¨ ・・・・・・¨ ¨ “ “ “ ¨ ∴・。116 Ac k nowl edg ement s . … … … … 120 Li s t of publ i c at i ons . “ . . . . ¨¨ ¨ ¨ ・・¨ " ・・・・¨ ・・・・・・・・・・・・¨ ・・¨ ・・¨ ¨ ・・¨ ¨ ¨ “ ¨ ¨ “ ・・・・・・¨ ¨ ・・・・¨ ・・" ¨ ¨ ¨ ¨ ・・・・¨ ¨ ¨ ・・・・・・¨ ¨ 。121
・ l V‐
List of figures
1.1 Z dependence of wavelengttt for FJike El, F-like, Si-like, Tilike Ml transitions ...7
1.2 Z dryndence of transition probability for El and Ml transitions ...7
2.1 Schematic view of space-resolved 3m VUV spectrometer system in LHD ... 14
2.2 Optics of space-resolved VUV spectroscopy and Pt-coated mirror arrangement ... 15
2.3 Schematic drawing of magnetic surfaces, external form of ergodic layer and so on ... l6 2.4 Full vertical profiles of impurity emissions ... ... 18
2.5 Radial profiles of CIV 15484 emissions ... 19
2.6 Time development of carbon vertical profiles ... 23
2.7 Vertical profile of CIV emission and ion temperature ... 24
2.8 Cylindrical carbon pellet wittr tin (Sn) coating ... ...26
2.9 Co-axial impurity pellet inserted tungsten (W) wire into polystyrene tube ... ...26
2.I0 Amount of heavy element for three kind of impurity pellets ...27
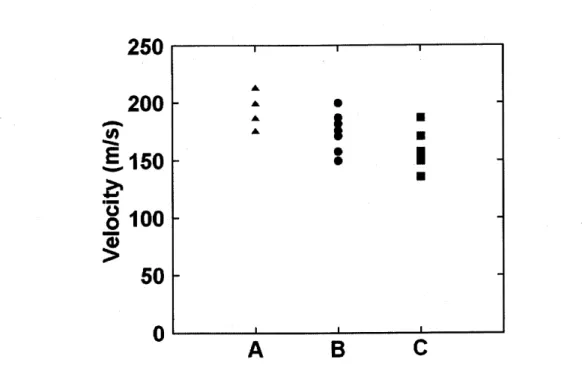
2.ll Velocities of impurity pellets shot with l5atrn helium gas ... ...,. 28
2.12 Temporal behaviors of the elecfion density and temperafire for pellet injections ...29
2.13 Temporal behavior with cylindrical Sn-coated carbon pellet ... 30
2.14 Temporal behavior with Mo-inserted co-axial impurity pellet ... 31
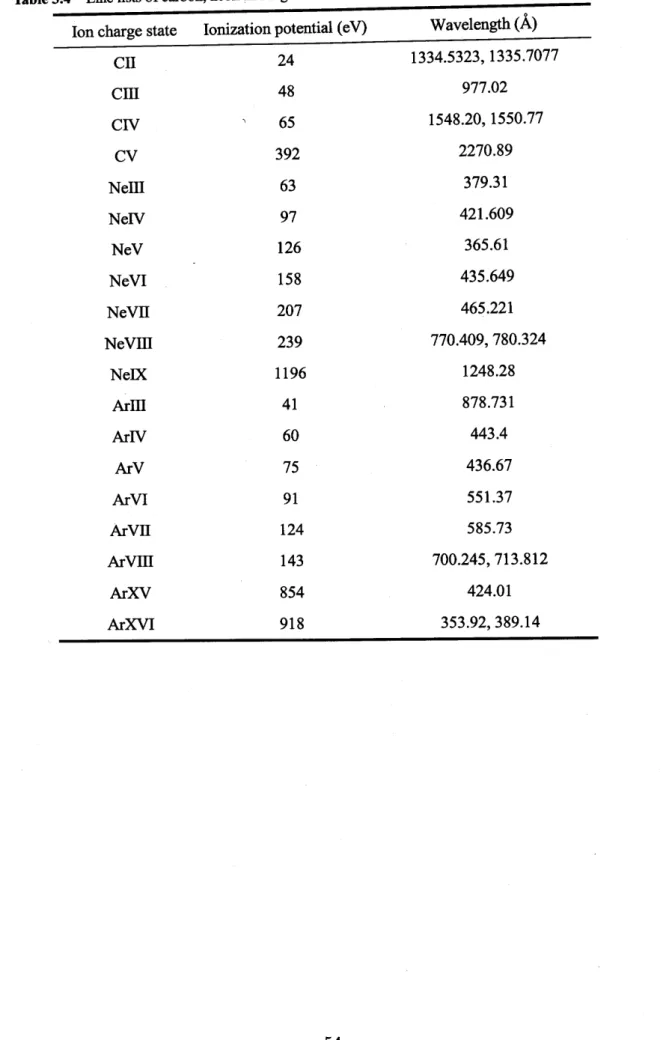
3.1-l to l-7 VUV spectra from neon discharges ... ... 55-61 3.2-l to 2-9 VUV spectra from argon discharges ... ... 62-70 3.3 Ionization potential of carbon, neon and argon ions ... ... 38
3.4 Ion temperature evaluated from Doppler broadening of neon and argon lines ...39
3.5 Spectral profiles of CIV and CV with Doppler broadening ... 40
3.6 Line profiles of hydrogen Lyman-a with self-absorption ... ...43
3.7 Line profile of hydrogen Lyman-p with self-absorption ... ...4
3.8 Partial energy level diagram of Ml andE2 transitions ... ...73
3.9 VUV spectra from argon plasmas measured with 3m normal incidence spectrometer ...74
3.10 Spectral profiles of ATVII, ArXII and ArXVI ... ...75
3.11 Visible and EUV spectra from argon plasmas ...77
3。12 VLI V s pec t r a k) m i mpur i t y pel l et 珂
∝ t ed pl as mas . … … … … …… … … … … …… … ¨ 79 3. 13 Zd" endel l c e Of wav el engt h f Or Si _ and Ti ―
l i ke Ml t r ans i dons . … …… … … … … … … 82 3. 14 Spec m wi t h Kr XXI I Ml t r ans i t i on. ¨
¨ . . ¨¨ ¨ ¨ ・・¨ " ¨ ¨ ¨ ・・¨ ・・" ¨ ¨ ・・¨ ・・¨ ¨ ¨ ・・¨ “ ¨ ¨ ¨ ・・・・¨ ・・・・¨ ¨ 。84 3. 15 Spec ― wl t h Kr XXI I I Ml t r ans i t i On。 ¨ ¨ . . " ¨¨ ・・・・・・・・¨ ・・¨ " ¨ ¨ “ ・・¨ ・・・・¨ ・・¨ ¨ ・・" ・・¨ ¨ ¨ ・・・・・・¨ 。・¨ ・86 3. 16 Spec t t ut t a wl t h MOXXI x Ml t r ans i t i on. . . ¨
" ¨ . . “・・・・・・¨ ¨ ¨ “ ¨ ・・・・¨ " ¨ ¨ ・・¨ ¨¨ ・・・・¨ ¨ ・・¨ “ ¨ ・・“ " ¨ . . 87 3. 17 Spec m wl t h xc ― I I I M
l t r ans i t i on. ¨. . . . ¨¨ ¨ ¨ ・・“ ・・¨ ¨ ¨ " ¨ “ " ¨ ¨ ¨ ¨ ¨ ¨・・“ ¨ ¨ ・・¨ ・・¨・・・・・・¨ ¨ 87 4. l TempOr al beha宙 or s of i nt ens i t y of ar gon. … … … … 。96 4. 2 Cal c ul at ed el ec t r on andpr ot on mac t exc i t at i on c Ю
s s s ec t i ons . …… …… … … … … …。98 4。3 Ver t i c al di s t r i but i ons of l i ne…i nt egr at ed ar gon enl l s s i ons . “ “ ¨ ¨“ ¨ ¨" ¨ ¨・・¨ " ¨ ¨・・・・¨ ¨ ¨ ¨ ・・¨ ¨ 。99 4. 4 Par t i al ener gy di agr am of Ar X. ¨ . . " ¨¨ ¨ ・・¨ ・・¨ ・・¨ ・・" ¨ ・・" 。・・・・・¨ ・・¨ ¨ ¨ ・・・・・・・・¨ ¨ ¨ ・. . . ¨. ・" ¨ ¨ ・・¨ ・・¨ ・・100 4. 5 E l ec t r On dens i t y d" endenc e of l i ne r at i Os on F ¨l i k e i ons . …… … … … …… … … … … … 103 4. 6 1ont emper ame d" endenc e of l i ne r at i os on F¨ l i ke i ons . …… … … ・… ・… … … … 104 4. 7 1i ner at i Os of Ar X M1/ El as a mc t i on of el ec t r on dens i t y. . . ¨
・・¨ ¨ ¨ ・・" ¨ ・・¨ ¨ ¨ ・・・・・・¨ ¨ ¨ ・105 4 .8 L in e r a ti Os (M1 / E l )o fl iF ‐k e i o n s 宙th fa s t p r o to n i mp a c t e x c i ta tio n …
. .. …. .……… ・・・・… 1 0 6 4 。9 E x p e r i me n ta l r e s u lts o fli n e r a tiOs fa n d o r T iF e X ⅥX ⅣII. …… … … …・… ・・¨ ・… … …・・。1 0 8 4. 10 Par t i al ener g y di ag r am of Ar XV。… … … ・: . …… … … ¨ 109 4。1l Li ne r at i Os Of Ar XV M1/ El as a f unc t i on of el ec t r on dens i t y. . . ¨ ¨ . ・¨ ¨ ¨ ¨ ・・・・・・・・¨ ¨¨ ¨ ¨ ¨ ・。111
‐
Ⅵ
・
List of tables
1.1 Selection rules for El, Ml and E2 transitions ... ... 5
3.1 Wavelength list of carbon lines 4547
3.2 Wavelength list of neon lines 4g-50
3.3 Wavelength list of argon lines 51-53
3.4 Line lists of carbon, neon and argon lines useful to spectroscopy ...54 3.5 Wavelength ofAr Ml tansitions determined from the present work ... 80 3.6 Wavelength of Ml transitions ofAl, Ti and Fe ... ... 8l 3.7 Ml ransitions of heary impurity elements ... 89 4.1 Atomic data of F I isoelectronic sequenceArX, TiXIV and FeXVIII ... .... 113 4.2 Atomic data of Be I isoelectronic sequenceArxv ... ll4
'vll'
Chapter 1
Introduction
1. 1. I mpor t anc e of i mpur i t y s t udy h c ont Ю Ⅱed t her monudear f us l on r es ear c h 、
F u s i o n r e a c t io n b e t wc e n h y d r o g e n i s o t o p e s o f D a n d T is e x p e c t e d mi s mg a s t h e mo s t p Ю nuc l ear r eac t i on f or al t emat i ve el ec t r i c power s our c ё i n or der t o over c ome t he pr es ent
enc ount er ed ener gy pr obl ems ;
D + T -> oHe (3.52MeV) * neutron (la.06MeV).
In order to realize the fusion reactor a high-temperature and high-density plasma (>10keV) has to be confined for a certain time. The plasma has to be sustained by the cr (aUe) heating with satisfoing the following condition;
niTrB > Jx102l m-3kevs,
where r\ and T are the ion density and plasma temperature, ffid TB is the energy confinement time expressed as follows;
‐
1‐
篭
= Wp / P h ,
where wo is the plasma stored energy and p;o the heating power.
Hightemperature fusion plasmas are contaminated by impurities such as carbon, oxygen and metallic elements, because of the existence of plasma facing components. When the impurities exist in the plasma, it gives rise to the increase in the radiation loss in addition to a dilution of the fuel ions. The net input power, Pio o.u is reduced by the radiation loss as
The,n, the impurity control becomes an important issue for realizing the fusion reactor. Especially, the control of healy impurity elements is essentially required, since the radiation loss from the impurity is much bigger when the nuclear number increases. The radiation loss from a specific impurity element is expressed by
Prad:Ileni-pR,
where R is the radiation coefficient as a function of electron temperature. The radiation loss is the sum of line emissions from impurities if the bremsstrahlung is ignored. Thus, it becomes very important to measure the line emission from impurities for the ptrrpose of impurity control in fusion plasmas.
1.2. Transition probability and selection rules for allowed and
f or bi dden t r ans i t i ons
The t i me…dependent S山 面 山
鴨er equat i on i s wnt t en as
滋
挙
=l 「 0+″ 竹 刀 Ψ , oo
wher e五らi s t he t i l r l e‐i ndependent Hami l t oni an i n t he abs enc c of ext emal f l el ds and
Pi n net 一Pi n¨Pr ad・
‐ 2・
ダ
′ ← ) 一
子 A・ ▽ +岳 A2,
( 1. 2)(1 。 3 )
(1.5)
(1 .8 ).
is a pertrnbation of electromagnetic field which explicitly depends on the time through the vector potential A. Here, we drop the term of A2 in the weak field case, in the following discussions [1].
Using the time-independent eigenfunctions fi, and eigenvalues Ep, the solution of the time-dependent unperturbed Schr<idinger equation
滋
拳
=島 │・ ,
c an be expr es s ed as
Yr = tyo$)exp(-iEktltt), (1.4).
The general solution, Y, of the time-dependent Schrodinger equation eq.(l.l) can be expanded as
where the sum is over the complete set of eigenfunctions, rp2.
The coefficient cdr) of the first order in the perturbation.I/ is known to be expressed as
"P Q)=-: IVil l.vl v,)exp(ia4t',)dt" (1.6)
m q '
where a and D stand for the initial and final states of the transition and o4,:(Eb-8")lhr. Here, we introduce the classical vector potential of
A(r,/) -
L,4(ar)G{exp(ik.r -iar)+exp(-ik .r+ia)} dat, (1 。 7 )
Y = I cuQ)Y o(r,l) =Z"o!)V*(r)exp(-iEkt /tt),
k k
"P Q) = -; L,ur'no@)l@rlexp(rk 'r)G ' vlv"l fexp(iat*t' - iox)dt'
+ (vul exp(-ik' r)G' v lv,l f,exp(ico*t * irn)aflt,
where e is the unit vector for polarization of radiation and k is the propagation vector of radiation. Eq.(1.7) is substituted for eq.(l.6) as follows;
When the dtration of the pulse t is much larger than the periodic time 2n/a6, the integral
・ 3‐
over ノ i n eq。
( 1. 8) wi l l be negl i gi bl e. The f l r s t i nt egr al over ノi n eq。
( 1. 8) wi l l be nOt negl i J bl e i f ω
baミω cwhen巳 シEQ, ωba>O andこ駆 ヽ+力ωba) 。h t hi s case t he f l nal st at e of t he at om has gr eat er ener gy t han t he i ni t i al s t at e and one phot on Of ener gy力
αンhas bec n a b s o r b e d h m t h e r a d i a t i o n .Θ
n t h e o t h e r h a n d , t h e d is e c “n t e g r a l o v e r ノi n e q 。
(1 .8 ) wil l be not negl i gi bl e i f ω
滋%_ ω ( when t t s t , ω ba<O andこド Qt t ωba) . h t hi S cas e t he i ni t i al s t at e of t he at Om has 3TCat er ener gy t han t he f mal s t at e and one phOt On Of ener gy力
ω i s emi t t ed by de‐exci t at i On.
We s t ar t wi t h t he f l r s t t em eq。
( 1. 8) , des Cr i bi ng abs oTt i ono We obt ai n
Thus the probability I co!) 12 increases linearly with time and a transition probability for absorption W6a canbe defined as
r ) 。 12T2π
[ 屏 ] 2K‰ l ex p( な
。 r ) e・ ▽
│‰ 】
2′
,
‰ =希 「 P( ′ 12=2π
[ 4( % ) ] 2K‰ l expCk・
r ) e・ ▽ 1降
】
2,
a nd t he t r a ns t t i on r a t e f or s t i nl l l l a t e d e mi s s i on″ らbi S g i v e n by
鴫 =子
( 岩 ) 考 Kち い 。
L → 卜 Ⅵ ‰ 】 2x ω _ り ,
(1 .9 )。
( 1. 10)
( 1. 12) 。
(1 .1 3 )。
乙ら
= ‰
,
( 1 . 1 1 〉
We need quantum electrodynamics to explain the spontaneous emission. Therefore, we note only the result of the spontaneous emission of a photon Wou is given by
The matrix element defined as (frl"*p(ik.r)G.VlV"l can be simplified by expanding the exponential exp(fk.r) as
響 c i o r ) = 1 + 〔 k o r ) + ; ( な 。
→
2 + ¨
ち
If the quantity (frr) is small (le2n/l,b, the Aa6 ranges 4000-80004 in visible and the distance from nucleus t'<104 in general atom), we can replace exp(ik.r) by unity in eq. (1.10) and (1.12). This is known as the electronic dipole (allowed, El) transitions. When the transition is forbidden, higher terms in the series (1.13), which correspond to magnetic dipole (Ml), electric quadrupole (82) transitions, n?y not be vanished, although the
Ⅲ 4・
t r ans hi on r at e i s gener al l y muc h s mt t l er t han f or al l owed t r ans ■
i ons . h gener al , t he
l nagnet i c i nt er ac t i On i s s n■■l er t han t he el ec t r oni c i nt er ac t i on i n t he f me s t mc t ur e c ol l s t ant , 137. Exac t under 飩 狙 山
唯 Of s uc h hi gher t er m i n eq。
( 1. 13) i s v er y i mpo■ant t o es t abl i s h a c ompl et e at omi c s t mc t ur e model f Or al l dement s , c s p∝
i al l y f or heav y dement s . Thus , t he St uウ Of t he Ml t r ans 量l on i n heav y el ement s bec omes al s o mpomnt and c an gl v e v al uabl e i nf o― t i On t O bui l d a c ompl et e s et of t he at or nl c s t mc t ur e c al c ul at i On。
The el ec t r on t r ans i t i ol r l s whi c h ar e not El t r ans i t i Ons ar e c al l ed i f or bi dden t r ans i t i ons ' . The ki nd Of t he t r ans i t i ons i s di s t i ngui s hed by s dec t i on l ■
l es . The s el ec t i On l ul es f or El
( a110W ed, el ec t Ю ni c di pol o, M l ( f or bi dden, m agnet i c di pol o and E2( f or bi dden, dec t Ю
ni c
q u a 山 叩o l o t r a n s 辻 l o n s a r e l i s t e d i n T a b l e l . 1 .
Tabl e l 。l Sel ec t i on ml es of El , Ml and E2 t r ans i t i ons
Transition El Ml E2
with negligible configuration
interaction (like hydrogen)
One electron jumping with;
An arbitrary, L , l , : + 1
l n t he s al ne c onf l t t at i On;
△ n=0,
△′ = 0
jumping or in the same; An arbitrary,
L,I, :0, +2
△ S f or L S c oupl i ng onl y
△ L f or L S c oupl l ng onl y
0, ± 1
( eXCept L=0⇔ 0)
0 , with △ J= ± 1
0, ± 1, ±2
( eXCept I ■ 0⇔ 0, 0 ⇔1 )
△J 0 ,± 1
( eXCept 卜 0⇔ 0)
0 , ± 1 ( eXC" t 卜 0⇔ 0)
0, ± 1, ±2
( eXCept 卜 0⇔ 0, 1/ 2⇔1/ 2, 0⇔ 1)
△M 0 , ±1
( eXCept 卜 0⇔O when
△ 卜 0)
0 , ± 1
( eXCq“ 卜 0⇔ 0 whe n Δ 「= 0 )
0, ± 1, ±2
Par i t y Change (even++edd)
‐ 5‐
No change No change
1.3. History of forbidden lines study
Line emissions from highly charged ions present important materials for studies in laboratory and astrophysical plasmas 1241. For the purpose resonance lines from such highly charged ions are generally used because of the high brightness, and those exist in the X-ray and VUV regions. On the other hand, forbidden transitions from highly charged ions frequently appear in the visible range (see Fig.l.l). Compared to conventional X-ray and VW techniques, standard optical methods offer several advantage such as higher spectral resolution and easy access to spatial resolution, larger solid angles for visible light collection and existence of several detectors. For astrophysics, the visible spectroscopy becomes more important, i.o., low absorption by the interstellar medium and long-distance accessibility for observation of stellar objects.
Earth-based telescopes can be used to detect the visible radiation from highly charged ions without the need of space-based instruments in the X-ray and EUV-VW regions. In 1927 , Bowen first identified the forbidden line in several prominent lines from galactic nebulae spectra as transitions between levels belonging to the normal configrnations of various atoms and ions, e.g. NII 65844 and OIII 4959,5007A I5l. However, those had previously been conjectured as transitions in an extraterrestrial element, nebulium in 1864. Forbidden optical transitions from highly charged ions had been detected in the SrHr before X-rays measurements were performed. So-called coronal visible lines thus gave the first evidence for the presenoe of such highly charged ions in the Sun. A well-known example is the FeXIV forbidden lines at 5303A in 1939 as the first obseryation of this strong line in the solar corona. In 1869, however, those had been also conjectured as an extraterrestrial element, coronium f6].
Forbidden lines arising from magnetic dipole (Ml) transitions in highly charged ions have been thus observed not only in astrophysical sources, but also in magnetically confined plasmas and in electron beam ion trap (EB[D [7, 13]. In the fusion plasmas the Ml transitions from highly charged iron was obsenred in PLT tokamak by Hinnov et a1., for the first time |l4l. After that the Ml transitions have been observed in tokamals [8, l5-28].
‐ 6‐
8000
く 6000
=
‐
0
54000
0
>
菫 : 2000
01
Z
tr'ig. 1.1 Z dependence of wavelengths for F-like Bl Q{2ps 2P312-2s2p6'5,.n:
solid squares) [7], F-like 12s22p5 2P312-2Py2:
solid circles) [8], Si-like 13s23p2 3P1-3P2: solid triangles) [8, 9] and Ti-like (3d4 sDr-5D2: solid diamonds) t10-121 Ml transitions.
r 一 o ︶ く
1 ( 〕
1 1
1 0 9
1 。 7
1 。 5
1 0 3
1 0 1
1( ) ‐ 1
1 0 ‐ 3
10 20 30 40 50 60 70 80 90
Z
F ig . 1 。2 Z d e p e n d e n c e o f t r a n e it io ■
p r o b a b i li t y f o r l ik e F ―E l (s o li d S q u a r e s )l i[k e (7 ],s o lF ―i d C i r c le s ) [ 8 ] ,S il―ik e ( S 0 1 id t r ia ng le s ) [ 8 ,9 ] a nd lik e ( s 0 1 iT i‐ d dinmonds ) [ 1 0 - 1 2 ] Ml t r a nnit ions .
‐ 7‐
Mo r g a n e t a l . , i d e n t i n e d e x p e r i me n t a ■
y s o me p r e d i c t e d l i n e s [l1 0 ]i k e i n i o n T i ‐X c ―Ⅲ
(x e 3 2 + ) h m t h e E Br r a t t h e Na t i o n a l h t t i t u t e o f S c i e n c e a n d T e c h n o l o g y o Nt t S l )i n 1 9 9 5 [ 29] . They s l Юwed f or t he f r s t t i me t he pos s i bi l i t i es of t he EBHf or t he s 如『 む of 宙 Si bl e
t r a n s t t i o n s h m i o n s i n e x t r e lc h a r g e l l e l y t t a t e s .h i ま T h e o f t h e s t u け Ml t r a n s i t i o n s h a v e
b e e n e n e r g a i c d l y c o n t i n u e d a l s o i n E Br u p t o t h i s d a y [1 1 , 1 2 1 ( s e c S e c t i o n 3 . 3 . 1 ).
1.4. Application of magnetic forbidden dipole transitions to
plasma diagnostics
Wavelengths of spectral lines from impurities in fusion plasmas move from visible range to VUV or x-ray range when the ionization stage of the impurity increases. Therefore, the x-ray line emission is mainly dominant in the central column of the high+emperature fusion plasmas. The visible spectroscopy has been limited to the plasma edge diagnostics if charge exchange spectroscopy is excluded. On the other hand, the Ml line has a transition among the ground state of highly charged impurity ions. The wavelength of the Ml transition moves toward longer wavelength side as compared to allowed lines (El) usually measured in EUV and x-ray ranges, and therq the Ml transition is mainly emitted in the visible range (see Fig.l.l). The transition probability of the Ml transition is quicHy increases with nuclear number as shown in Fig.l.2. Therefore, the Ml transition becomes very bright for high-Z elements.
The high-Z elemerfis such as Ne, Ar, Kr, Xe, Mo and W recently become important in fusion research. In the next-generation firsion device the element of Mo or W is a candidate of the plasma facing material 1301. The elements of Ar and Kr are planned for diagnostic use and the elements of Ne and Ar are used for divertor cooling. The impurity spectroscopy of such hrgh-Z elements is thus important in the next-generation fusion device. The VUV and EUV spectroscopy usually used for the impurity diagnostics requires the vacuum and the instruments have to be directly connected to the fusion device. If the D-T operation is carried out, the grating and detector will be damaged by the neutrons and the
・ 8‐
detector itself will be influenced by the tritium. Therefore, if the line emissions from the l"gh-Z elements are measured in the visible range using optical fibers, the difficulty of the impurity spectroscopy in burning plasmas can be much reduced. The Ml transition is a possible candidate to overcome the present situation of the VW spectroscopy in the next-generation fusion device. The search of the Ml transitions from such heavy elements for plasma diagnostics is one of the motivation of this thesis in addition to spectroscopic study on the Ml transition and VUV line emissions and contribution to atomic physics.
¨ 9‐
Ref er enc es
[1 ] B.H. Br a l ls d e n a n d C o J . J o a c h a in , P h y s ic s o f a t o r t t u le s , L o n Ma n d a n l n o l1 9 8 3 .∝ [ 2] Ro C. I s l et Nuc l . Fus i on 24, 1599…1678( 1984) .
[3 ] C .De Mic h e l i s a n d M. Ma t t io li , R e p .P r o g o P h y s .1 3 4 6 (4 7 ,1 9 8 4 )1 2 3 3 ‐. [4 ] Bo De me a n d E .Hi mo v 9 P h y s .S c r . 3 5 , 8 H- 8 1 8 (1 9 8 7 ) 。
[ 5] I o S. BOWen, Nat we c Londo→ 120( 1927) .
[6 ]Bo E d l 伍, Ar k i v Ma t e mo As i o c h F y s . 2 8 , B No . 1 (1 9 4 1 )。 [ 7] K。 ■ Cheng and Y‐ K. KhЪ At o Dat a Nuc l . Dat ao Tabl es 24, 111‐189( 1979) 。 [ 8] V Kauhan and J o Suger 9J o Phys . Chemo Re■ Dat a 15, 321… 387( 1986) 。 [ 9] K. =N. Huang, At o Dat a Nuc l . Dat a. Tabl es 32, 503‐ 566( 1985) .
[ 10] U. Fel d― , R hdel i c at o and J o Sugar 9 J . Opt e Soc . Am. B8, 3‐ 5( 1991) . [ 11] E. Bi emont , E T r aber t and C` J . Zei ppt t J . Phy s . B34, 1941- 1951( 2001) 。
[ 12] S . B. Ut t er 9 R Bc i er s dor f er and E T ぬb( 滋, Phy s . Rt t A 67, 012508- 1…5( 2003) 。 [ 13] M. Ho P五 〇r 9J o Opt o S oc . Am. B4, 144…147( 1987) .
[ 14] S e S uCk ewer and Eo Hi mov 9 Phy s . Rt t L et t . 41, 756… 759( 1978) .
[1 5 ]S .S u C k e we r 9 Ho R E u b t t ααλ P h y S .R t t L e t t .4 3 , 2 0 7 -2 1 0 (1 9 7 9 ).
[ 16] So SuCk ewer 9 J o Cec c hi , ι′ αちPhy S. L c t t . 80A, 259‐261( 1980) , [ 17] S . S uCk e we r 9 R. F onc k a nd E . Hi mov 9Phy s Re v A 21, 924‐927( 1980) . [ 18] S . S uё k e we r 9 R. F onc k a nd E . Hi mov 9 Phy s Re v A 22, 2278( 1980) 。 [ 19] S . S uc k ewer 9 E . Hi mov 9 α αちPhy s Rev A26, H61…H63( 1982) 。 [ 201 B. Deme, E . Hi mov 9 θ′ αちPhy s Rev A28, 206…208( 1983) .
[2 1 ] No J . P c a c o c k , Mo R S t a mp a n d J . Do S i l v e r 9 T 8 , 1 0 …P h y s .2 0 (1 9 8 4 )S c ■ 。 [ 22] S. SuCkewer 9 θ′ αちNuc l . Fus i on 24, 815- 826( 1984) .
[ 23] K. H. Bl l r r el l , Ro J . Gr oё l mq, ι ′ αムPhys RevA29, 1343‐ 1347( 1984) 。 [ 24] B. Dennc and E. Hi mov9Phys RevA 29, 3442¨ 3443( 1984) 。
[ 25] Uo Fel dman, J . R Seel y9 α αちJ : Opt o Soc . Am. Bo, 1605- 1608( 1986) 。 [ 26] J o Rc ader 9 Co M. Br own, α α ′, J . Qpt o SOCo Am. B3, 1609‐ 1611( 1986) .
[ 27] B. Deme, E . Hi mov 9θ ′ αちPhy s Rev A40, 1488‐1496( 1989) 。
‐ 10‐
[ 2 8 ] U.F e ldma n,J。0 .E k be r g ,α αJ,J.o pt e S OC.Am.B6 ,1 6 5 2 ‐1 6 5 5 ( 1 9 8 9 ) 。 [ 2 9 ]C . A .Mo r g a n , θ′a ム,P h y s R t t L c t t 。7 4 , 1 7 1 6 ‐1 7 1 9 (1 9 9 5 )。
[ 3 0 ]T P t t e r ic h , I P P ‐R e p o ■ 1 0 / 2 9 (2 0 0 6 )。
¨
11¨
Chapter 2
Experimental setup
2.1. 3m normal incidence spectrometer
2.1.1. Introduction
Magnetic field topology in LIID is characterizd by the presence of ergodic layer surrounding the closed magnetic surfaces. Magnetic field line structtres are stochastic in such an ergodic layer, having no poloidal uniformity. The thickness of the ergodic layer tlpically ranges from 3 to SOcrru which largely changes according to each poloidal and toroidal position of the LHD edge plasmas. The ergodic layer plays an important role for confinement properties in LHD, because the ergodic layer is much thicker than ionization lengths of neutrals and the connection lengths of magnetic field lines are much longer than the ion-ion collision mean free path. Then, it becomes important for LHD to study the particle/impurity behaviors in the ergodic layer. Since electron temperatures are high enough at Last Closed Flux Surface (LCFS), typically 100-500eV spectral lines of impurity ions stayed in the ergodic layer are mainly radiated in VW region. VW spectroscopy has been thus developed in LIID to measure the impurity distribution in the ergodic layer.
A space-resolved VW spectroscopy was originally developed in the Compact Helical System (CHS) using a lm normal incidence VW monochromator equipped with a secondary electron multiplier and eight concave mirrors U, 91. Radial profiles of VUV
‐ 12¨
lines emitted in a wavelength range of 400-16004 were measured by rotating an octagonal disk mounted on the eight concave mirrors with a time interval of 20ms. In the ASDEX-U, a similar system was constructed using a rotating mirror, a lm normal incidence spectrometer with an ellipsoidal mirror and MCP-intensified photodiode detectors 12-31. Radial profiles of the ion temperature were measured in the Advanced Toroidal Facility (ATF) from Doppler broadening of carbon, oxygen and nitrogen lines using a lm vacuum Czerny-Turner spectrometer t4]. In LHD, a space-resolved 3m normal incidence spectrometer system has been constructed to observe vertical profiles of impurity lines emitted in a wavelength range of 500-31004 in addition to radial profiles of the ion temperature and poloidal rotation t5l. A final goal of this system is to observe a three-dimensional distribution of impurity radiation in the ergodic layer by scanning a toroidal slit during a discharge. Recently, the vertical profiles of impurity emissions have been successfully obtained with the ion temperature profiles. h this chapter, the preliminary results are presented with an explanation on the space-resolved VW spectroscopy in LHD.
2.1.2. Space-resolved 3m VIIV spectrometer
Figure 2.1 shows a schematic view of the space-resolved 3m VUV spectrometer system in LHD. A back-illuminated CCD detector (Andor model 435) is set at the exit slit position. The size of the CCD exposure area is 13.3x13.3mm2 (llx lZpr*lpixel) and the total number of charurels are 1024x1024. The CCD is operated at a moderate temperature of -20oC to reduce the thermal noise, which can be reduced to a negligible level. The frame transfer mode is used as a CCD operation method to reduce the transfer time of electric charges and to take clearer images. Using the frame transfer mode, a radial profile with 51 radial points can be recorded in a time interval of 125ms. Two gratings (1200grooves/mrn, 65x150mm2,
14004 blazewith ft-coating and 30004, blaze with A-Mgfr-coating) are installed in the 3m VW normal incidence spectrometer (Mcpherson model 2253). The grating with 14004
‐ 13‐
b l a z e is u s e d in t h e p r e s e n t T h e s t u `S p e c t r a l与 r e s o l u t io n i江 a n s O. 0 5 Åe n t r a n c e wis ld t h■ of 20μ n and t he r eCi pr oc al l i nc ar di s per s i on i s 2. 75編. Thi s r es 01ut i On i s hi まenou」
t o me a s t l r e t h e Do p p l e r wi d t h o f imp u r i t y li n e s o Wh e n I I l o r e p r e c ile s a r es e s p e c t r a l p r o ■ r e q u i r e d f o r t h e Do p p l e r t e mp e r a me me a s u r me n t , t h e s e c o n d o r t h i r d o r d e r lig h t is u s e d 。
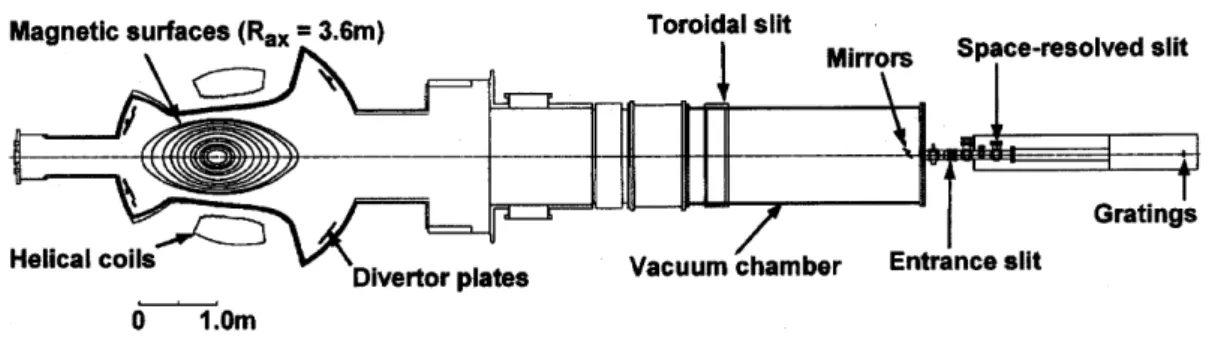
Magnet i c s ur f ac es ( Rax T 3. 6m) Tor ol da: s : i t
Space-resolved slit θ
陥 L Jc :評
Gratings Vac uum t hamber Ent r anc e s i l t
Divertor plates
0 1.0m
Fig. 2.1 Schematic view of space-resolved 3m VUV spectrometer system in LHD.
A space-resolved slit is placed between the entrance slit and the grating of the spectrometer to observe a vertical image of VUV emissions. The space-resolved slit with the width of 267pm is used in most of the cases, which gives vertical resolution of 20mm. The brightness of the spectral image decreased to 1/60 in comparison with the fully opened case. Therefore, the entrance slit is opened up to 2nn in order to increase the signal intensity. Changing the e,ntrance slit width from 20pn to 2mnr, the signal intensity of spectral lines increases up to 100 times.
TWo platinum-coated mirrors for view-angle adjustment are set in front of the entrance slit with an incidence angle of 60o. The minimum limit of observable wavelength range is determined by the reflection efficiency of the VUV emissions on the mirrors. The practical limit was 500A whereas it was originally 300^4. when the two mirrors were removed. The signal intensrty is decreased by l0% when the mirrors are usd. The optics is traced with flat and convex cylindrical mirrors in Fig. 2.2. The view-angle is essentially determined by the grating and CCD vertical sizes, the focal length of the spectrometer and the distance between the spectrometer and plasma positions in addition to the curvature of the convex cylindrical mirror. Three convex cylindrical mirrors with curvatures of R : 500, 750 and
‐ 14Ⅱ
l050mm have been tested so far. We confirrred that the view-angle and the vertical image were adjustable by changing the curvatures. The observable vertical range is l200mm at the plasma center when the cylindrical mirror of R = 750m is used. This curvaftre of the cylindrical mirror is good e,nough for the present profile observation.
Eig.2.2 Optics of space-resolved VUV spectroscopy and Pt-coated mirror arrangement.
A flat mirror is used for high-spatial-resolution measurement of edge plasmaso although the vertical obsernation area is limited to 200mm. By replacing the cylindrical mirror to the flat mirror with a rctary holder, the spatial resolution increases up to 4mm. The brightness of spectral lines also increases up to ten times compared with the cylindrical mirror case.
A toroidal slit is set at a diagnostic port between the spectrometer and the plasma. A three-dimensional measurement of impurity line emissions becomes possible by moving the toroidal slit during a single discharge. The vertical profile integrated toroidally over a length of 30mm is obtained when the toroidal slit width is fixed to l0mm. The elliptical LHD plasma rotates five times during a single toroidal turn. Then, a small exte,nsion of the toroidal view area easily reduces the vertical spatial resolution" especially at the edge region. The full toroidal observation length is 300mm.
All the parts including the wavelength scan of the spectrometer can be externally controlled by a desktop computer located in the LIID diagnostic room. The optical modem is used for the linkage between the experimental room and the diagnostic room using an
-15-
optical fiber of 200m in length. An interactional communication is provided by the RS-232C system. A computer for the CCD operation is located in the LIID experimgntal room and remotely accessed by a keyboard-video-mouse (KVlvI) extender from the diagnostic room with a LAN-cable of 200m in length. Data of the CCD are also transferred by the LAN-cable to a data-seryer set in the diagnostic room.
2.1.3. Radial profile measurement
Fig. 23 Schematic drawing of magnetic surfaces (Ro:3.75m), external forrr of ergodic layer, divertor legs and carbon divertor plates.
Figrre 2.3 shows a poloidal cross-section at horizontally elongated plasma position of LHD (Ro:3.75m case). Ten magnetic surfaces are traced in the figure as a function of normalized plasma radius, p (=la). Here, r and a are the radial position and the plasma radius, respectively. The LCFS locates at the p:1.0 position. The contour surrounding
LCFS (P = 1.0)
Ergodic layer divertor plates
‐ 16‐
the LCFS traces an outside boundary of the ergodic layer. The outside boundary of the ergodic layer in the present expression is defined by aregion where the connection length of magnetic field lines to the vacuum wall is -50m. This region does not form a clear magnetic surface, but has a considerably high temperature because of those long connection lengths. Tlpical electron temperature of the ergodic layer ranges between l0 and 500eV depending on electron density, magnetic field strength and input heating power. The electron densrty of the ergodic layer is high enough and has normally a similar value to the central electron densrty. The divertor legs directly connect the edge plasma to the carbon divertor plates, which is a unique route for plasma particles coming out of the core plasma.
Tlpical examples on fulI vertical profiles of externally ir:$ected aluminurrU argon and neon are shown in Fig. 2.4, where Z denotes the vertical distance from the equatorial plane. A cylindrical aluminum pellet with a size of 0.8mm in diameter and 0.8mm in length is injected by an imptrity pellet iqiector[6]. The velocity of the impurity pellet accelerated by pressurized helium gas (lSatoms) is 100-300m/s. The injected pellet is fully ablated within a few milliseconds and ionized toward higher ionization stages. The aluminum ions are confined in the core plasma of LHD with a particle confinement time of -0.5s, which is much longer than the CCD exposure time (125ms). The rare gases of argon and neon are puffed by a piezoelectric valve during a discharge to maintain the amount of lo/o to the electron density of 2-5xl013cm-3. The AIXI profile in Fig. 2.a@) is taken io R*=3.60m configuration having a maximum plasma size in LHD, and the ArVm and NeVIII are recorded in R*:3.70m configuration as shown in Fig. 2.4(b) and (c). Then, the AIXI profile is wider than the other two profiles. It is clearly seen that the vertical profiles have a symmetric feature at upper and lower positions, indicating no existence of a vertical asymmetry as seen in tokamaks [7, 10-16]. These symmetric profiles suggest that all such spectra are emitted inside the LCFS. If the emissions are located in the ergodic layer at p>1.0, the profiles change to a complicated shape as will be shown later. The locations where the AXI, ATVIII and NeVItr exist are compared with the electron temperature profiles. The result shows that these ions are located at a radial position where l<tJX#z Q6: ionrzation potential).
‐ 17‐
( a) AI Xl
(c) NeMll
oO: 4 30。
2 0 0. 2 0. 4 0. 6 Z ( m)
Fig.2.4 Full vertical profiles of impurity emissions: (a) AIXI 550A (R .:3.60m), (b) ATVIII 7004 (Ro:3.70m) and (c) NeVIIITTO]\ (Ro:3.70m)
︵バ﹂こお覇E■ニ 8 4
0 0
→0﹄“︶ゝ〓∽〓g〓一 8 4
0 0
今避こお一o〓■三 Oo 2020 ︲
.
. 6
( b)
‐ 18‐
3 2 1
︵三﹂こむ一oEg菫
( a) Rax=3. 60m
( b) Ra) F3. 65m
( c ) Rax・ 3. 75m 020 8 6 4 2 04 3 2 1
︲ ︲
︵至﹂ユむちE騨二 ︵三﹄二お覇〓●一三
0
‐1. 2 ‐ 0。8 80。4 0. 8 1. 2
Fi g. 2。5 Radi al pЮ ■ l es of CⅣ 1548Å emi s s i Ol l s f bm( → F曝皇3. 60m, o) F曝 =3, 65m and( C)
聴
=3. 75m。
0 0 4 p
Ⅲ 19‐
Vertical profiles of CIV (154SA) are measured in plasmas with three different magnetic il(es (fu.:3.69, 3.65 and 3.75m), as shown in Fig. 2.5. The vertical positions of the profiles are converted into p for the comparison. The profiles are much different from the case of Fig.2.4. In total four peaks (two weak edge peaks and two strong central peaks) appeared in the profiles. Two small peaks at the plasma edge near p-1.0 and p=-1.0 are formed by the chord integration of edge CIV emissions at the top and bottom edges of the elliptical plasma (see Fig. 2.3). However, two other strong peaks arE see,lr near p:0 originating from a different reason. In LHD, the particle recycling is enhanced at the inboard side [8]. The particles coming form the core plasma are collected on the carbon divertor plates through the inboard X-point and the carbon atoms are sputtered by such plasma particles at the inboard side. Thus, the carbon source is localized only at the inboard side divertor plates. However, the carbon emissions are weak at the inboard X-point where enough density cannot buitd up, since the connection length between the divertor plates and the inboard X-point is 2m. The densrty of CIV then increases at the area surrounding the inboard X-point and the resultant chord-integrated CIV profile is split into two peaks. The structures of carbon emissions at the inboard side change when the magnetic axis is moved as seen in Fig. 2.5. This change of the CIV profile reflects the simulated result that the poloidal location of the particle coming from the core plasma changes to upper side X-point at vertically elongated plasma position when the magnetic axis shifts outside. However, the detailed mechanism is not clear at present, because the magnetic field line strrcture and the related particle motion are very complicated in the ergodic layer. In order to understand these emission structures in detail, the three-dimensional image of the errissions is really required in addition to more detailed edge particle simulation in the ergodic layer.
Radial profiles of CIII-CV are measured from discharges with a Local Island Divertor (LD) as shown in Fig. 2.6. In the LID experiment, a carbon plate (l-' in size) with crescent surface structure is inserted into a large m/n=l/l island which is created by external resonant coils. The amount of carbon impurity in such discharges becomes high, then, it leads to a large improvement of signal-to-noise ratio in the present diagnostics. The profile
‐ 20‐
of Cm in Fig. 2.6(a) indicates that the carbon source is located at some poloidal positiono also suggesting an interaction with the LID carbon plate. The toroidal location of the 3m normal incidence spectrometer is l80o from the LID position. Therefore, the image of the carbon sogrce is shaded off by the poloidal transport during the half toroidal turn of carbon ions. The profile of the CIII, of course, does not reflect the magnetic surface information. The CIV profile shown in Fig. 2.6(b) becomes much different from the CIII profile. The major emission of the CIV is located on the top side of the plasma edge and the asymmetric feattre is still in the profile. On the other hand, this asymmetric feature completely disappears in the profile of the next ionization stage of CV as shown in Fig. 2.6(c). The location of the CV moves considerably inside the LCFS because of its high ionization potelrtial of 392eV, and the profile becomes a function of magnetic surface. From the CIV profile measurement it is made clear that the carbon source location moves to the opposite position when the magnetic field direction is inverte4 as shown in Fig. 2.6(d). The beam orbit of tangentially injected neutral beams with an energy of l80keV is very sensitive to the direction of the magnetic field because of the different direction of grad-B drift. The difference in the interaction between the beam and the LID plate is considered to be a possible reason.
Vertical profiles of the ion temperature are also measured simultaneously with the emission profile ll7-201. A typical result on the CIV is shown nEig. 2.7. The entrance slit width of the spectrometer is 20[rm and the second order light of CIV 1ZxtS48A) is used for the low ion temperafure measurement. It can expand the lower limit of the ion temperature measurement down to a few eV. The CIV profile shown in Fig. 2.7 is obtained from a high-densrty (> 5-l0x10r'*-') discharge with a repetitive hydrogen pellet injection. The plasma size shrinks a little because of the low edge temperature. The ion temperattre profile is plotted at steady phase of the discharge (t:0.675s) and at decay phase after several pellet injectiorrs (t:1.05s). The edge ion temperature during the steady phase has a complicated structure, suggesting a three-dime,nsional structure of plasma parameters in the ergodic layer of LHD. In the decay phase after the pellets, the ion temperature becomes low because of the rapidly increased density. The three-dimensional distribution of the ion
‐ 21‐
temperature is also necessary in order to understand the structure of the ergodic layer in LIID.
2.1.4. Summary
Radial profile measurement of impurity line emissions has been developed in LIID using a space-resolved 3m VUV spectrometer for the study of edge plasma behavior, espeially the impurity behavior in the ergodic layer having no magnetic surface. Full vertical profiles and time behaviors of an intrinsic impurity of carbon and externally injected impurities of neon, aluminum and argon are successfully obtained. Vertical profiles of CItr and CIV show asymmetric features reflecting a structure of the ergodic layer plasma. Vertical profiles of the ion temperattre are also measured from the CIV line with a complicated structure. Three-dimensional image of VUV line emissions, which are really required for understanding the structtre of the ergodic layer plasma, has been measured preliminarily by scanning a toroidal slit. However, there remain a few technical problems such as VUV reflection from the facing vacuum wall, precise adjustment of optical axis and uniformity of diftaction efficiency on the grating. h the near fuflre, the three-dimensional image of VtfV fine emissions will be well observed and such a result will be greatly helpful for understanding the ergodic layer plasma in LHD.
¨ 22‐
今●﹄“︶ゝ〓OC,c¨
1 0
一●﹄●︶、〓“E,c¨ 2 1 0
今0﹄”︶、〓切E●“ε一
086420
.
︵Besむ¨●c,三
3
2 t(3 )
4 3
2 t ( = )
0 Z ( m)
0 Z( m)
F増 . 2. 6 ThЮ devel opment s of c ar bon ver t i c al pお i l es of ( → CⅡ 1 977Å ( I oni z at i On Pot ent i al
先i ―
- 48eV) , o) and( O CI V 1548A α
F 65eD and( C) CV 2270A α F 392eV) . Dat a ar e t ak en hm
NBI di s c har g es wi dl L I D c oni F at i on and di r ec do■of t or oi dal mag net i c 8ol d i s i nv er t ed i n t he c as e Of ( 0.
( d) Ci V
‐ 23‐
1。 5
0 5 1 0
今 O L ” ︺ ゝ 〓 O E ■ 〓 ︼
005052 1 1
9 o ︶ ﹂ ト
( b) 0. 675s
I 1. 05s
‐ 0. 6 ■ . 4 H O . 2 0 0. 2 0. 4 0. 6
Z( m )
Fi g。2. 7 Ver t i c al pr ot t l es of ( →CⅣ emi s s i on( s ol i d l i ne: 0. 675s and das hed l i ne: 1. 05s ) and O) i On
t e mp e r a n c (S 0 1 id c ir c ic s :0 .6 7 5 s a n d s o lid 1 .d a n g l0 5 s ).e 鋭
‘ ¨ ︻ ・ ︲ ︲ . . . 。 ﹂ 嗜 . ︼ Ⅳ r r ′ ´ . J a ‘ J ・ 8 1 ・ ´ J
﹂ ︵
5/
( a} 0
・ 6 7 /
r l . 0
‐ 24‐
2.2. Heavy element impurity pellet injection
A variety of emissions from nulny kinds of elements are necessary for development of high+emperature plasma spectroscopy. Impurities which do not infinsically exist in plasmas are generally used for this purpose. The use of rare gas is one of the methods. kr case of the rare gas, however, the source term of the injected gas can not be defined clearly due to the high-recycling rate of the rare gas. The laser blow-off technique, which is a method to inject metallic impurities into the plasma by focusing a pulse laser beam on a thin metallic layer deposited on a glass substratel2ll, is widely used for impurity transport study and spectroscopic use because of the well defined source term and the easy method for observing metallic elements. It is possible to adjust the impurity amount by selecting the thickness of the metallic layer and the laser condition. However, it is difficult for plasmas with thick scrape-off-layer or ergodic layer to use the method, since the ablated impurity cloud is easily shielded by the outside layer surounding the core plasma and does not penetrate into the plasma core. This effect becomes very typical in Large Helical Device (LfD). Therefore, an impurity pellet injector has been developed for spectroscopy of LHD
1221.
The impurity pellet iqiection has been successfully operated for various purposes of the study. The cylindrical impurity pellet made of pure material such as carbon and aluminum has been generally used for the study. The size of the usually used impurity pellet ranges between 0.4-0.8mm. The pellet with size smaller than 0.4mm is not used because the treatment and injection are not easy technically. Therefore, an alternative design is required for the present impurity pellet in order to avoid the thermal collapse of discharges.
TWo kinds of double-structural designs have been developed for the heary element pellet injection. One of the designs is a cylindrical pure carbon pellet coated by heavy elements. The thickness of the coating is 5-15pm and the carbon pellet size is 0.54.8mm. A photograph of the Sn-coated carbon pellet is shown in Fig.2.8 as an exarnple. The surface
‐ 25‐
F i g 。2 。8 C y l i n d r i c a l c a r b o n p e l l e t c o a t iwi t h n g o t iT o t a ln (S ⇒ s i z o o f t h p e l l e t i s O. 9 mm i n
di amet er and O. 8nl l l l i n l em。
Fig. 2.9 Co-orial impuriry pellet inserted tungsten (W) wire into polystyrene tube. Diameter of wire is 150pm and diameter of the tube is 0.8mm. Division of scale is 0.5mm.
‐ 26‐