arXiv:1211.3284v1 [astro-ph.SR] 14 Nov 2012
S. Mayama1,2, J. Hashimoto3, T. Muto4, T. Tsukagoshi5, N. Kusakabe3, M. Kuzuhara3,6, Y. Takahashi3,7, T. Kudo8, R. Dong9, M. Fukagawa10, M. Takami11, M. Momose5, J. P.
Wisniewski27, K. Follette15, L. Abe12, E. Akiyama3, W. Brandner13, T. Brandt9, J. Carson14, S. Egner8, M. Feldt13, M. Goto29, C. A. Grady16,17,18, O. Guyon8, Y. Hayano2,8,
M. Hayashi2,3, S. Hayashi2,8, T. Henning13, K. W. Hodapp19, M. Ishii8, M. Iye2,3, M. Janson9, R. Kandori3, J. Kwon2, G. R. Knapp9, T. Matsuo20, M. W. McElwain18, S. Miyama21, J.-I. Morino3, A. Moro-Martin9,22, T. Nishimura8, T.-S. Pyo8, E. Serabyn23, H. Suto3, R. Suzuki3, N. Takato2,8, H. Terada8, C. Thalmann24, D. Tomono8, E. L. Turner9,25,
M. Watanabe26, T. Yamada28, H. Takami2,8, T. Usuda2,8, M. Tamura2,3
mayama [email protected]
1The Center for the Promotion of Integrated Sciences, The Graduate University for Ad- vanced Studies (SOKENDAI), Shonan International Village, Hayama-cho, Miura-gun, Kana- gawa 240-0193, Japan
2Department of Astronomical Science, The Graduate University for Advanced Stud- ies (SOKENDAI), 2-21-1 Osawa, Mitaka, Tokyo 181-8588, Japan
3National Astronomical Observatory of Japan, 2-21-1 Osawa, Mitaka, Tokyo 181-8588, Japan
4Division of Liberal Arts, Kogakuin University, 1-24-2, Nishi-Shinjuku, Shinjuku-ku, Tokyo, 163-8677, Japan
5College of Science, Ibaraki University, 2-1-1 Bunkyo, Mito, Ibaraki 310-8512, Japan
6Department of Earth and Planetary Science, The University of Tokyo, Hongo 7-3-1, Bunkyo-ku, Tokyo 113-0033, Japan
7Department of Astronomy, The University of Tokyo, Hongo 7-3-1, Bunkyo-ku, Tokyo 113-0033, Japan
8Subaru Telescope, 650 North A’ohoku Place, Hilo, HI 96720, USA
9Department of Astrophysical Sciences, Princeton University, NJ08544, USA
10Department of Earth and Space Science, Graduate School of Science, Osaka University, 1-1, Machikaneyama, Toyonaka, Osaka 560-0043, Japan
11Institute of Astronomy and Astrophysics, Academia Sinica, P.O. Box 23-141, Taipei 106, Taiwan
12Laboratoire Hippolyte Fizeau, UMR6525, Universite de Nice Sophia-Antipolis, 28, av- enue Valrose, 06108 Nice Cedex 02, France
13Max Planck Institute for Astronomy, Koenigstuhl 17, 69117 Heidelberg, Germany
14Department of Physics and Astronomy, College of Charleston, 58 Coming St., Charleston, SC 29424, USA.
15Department of Astronomy and Steward Observatory, The University of Arizona, 933 North Cherry Avenue, Rm. N204, Tucson, AZ 85721-0065, USA
16Goddard Center for Astrobiology, NASA’s Goddard Space Flight Center, Greenbelt, MD
Received ; accepted
Not to appear in Nonlearned J., 45.
20771, USA
17Eureka Scientific, 2452 Delmer, Suite 100, Oakland CA 96002, USA
18ExoPlanets and Stellar Astrophysics Laboratory, Code 667, Goddard Space Flight Cen- ter, Greenbelt, MD 20771 USA
19Institute for Astronomy, University of Hawaii, 640 North A’ohoku Place, Hilo, HI 96720, USA
20Department of Astronomy, Kyoto University, Kitashirakawa-Oiwake-cho, Sakyo-ku, Ky- oto, 606-8502, Japan
21Office of the President, Hiroshima University, 1-3-2 Kagamiyama, Higashi-Hiroshima, Hiroshima 739-8511, JAPAN
22Departamento de Astrofisica, CAB (INTA-CSIC), Instituto Nacional de T´ecnica Aeroes- pacial, Torrej´on de Ardoz, 28850, Madrid, Spain
23Jet Propulsion Laboratory, California Institute of Technology, Pasadena, CA 91109, USA
24Astronomical Institute ”Anton Pannekoek”, University of Amsterdam, Science Park 904, 1098 XH Amsterdam, The Netherlands
25Institute for the Physics and Mathematics of the Universe, The University of Tokyo, Kashiwa 227-8568, Japan
26Department of Cosmosciences, Hokkaido University, Sapporo 060-0810, Japan
27H L Dodge Department of Physics & Astronomy, University of Oklahoma, 440 W Brooks St. Norman, OK 73019, USA
28Astronomical Institute, Tohoku University, Aoba, Sendai 980-8578, Japan
29Universit¨ats-Sternwarte M¨unchen Scheinerstr. 1, D-81679 Munich, Germany
ABSTRACT
We report high-resolution (0.07 arcsec) near-infrared polarized intensity im- ages of the circumstellar disk around the star 2MASS J16042165-2130284 ob- tained with HiCIAO mounted on the Subaru 8.2 m telescope. We present our H-band data, which clearly exhibits a resolved, face-on disk with a large inner hole for the first time at infrared wavelengths. We detect the centrosymmetric polarization pattern in the circumstellar material as has been observed in other disks. Elliptical fitting gives the semimajor axis, semiminor axis, and position angle (P.A.) of the disk as 63 AU, 62 AU, and -14 ◦, respectively. The disk is asymmetric, with one dip located at P.A.s of ∼85◦. Our observed disk size agrees well with a previous study of dust and CO emission at submillimeter wavelength with Submillimeter Array. Hence, the near-infrared light is interpreted as scat- tered light reflected from the inner edge of the disk. Our observations also detect an elongated arc (50 AU) extending over the disk inner hole. It emanates at the inner edge of the western side of the disk, extending inward first, then curving to the northeast. We discuss the possibility that the inner hole, the dip, and the arc that we have observed may be related to the existence of unseen bodies within the disk.
Subject headings: stars: pre-main sequence — planetary systems — protoplanetary disks — techniques: polarimetric
1. Introduction
Planets are believed to form in protoplanetary disks. To study the structures of protoplanetary disks, multi-wavelength observations have targeted such disks around young stellar objects located in nearby star forming regions such as the Taurus, ρ Oph, and Upper Scorpius regions (e.g., Kenyon & Hartmann 1995; Preibisch & Zinnecker 1999; Furlan et al. 2006; Andrews et al. 2009; Dahm & Carpenter 2009; McClure 2009; Andrews et al. 2011; Mathews et al. 2012). Among such nearby star forming regions, Upper Scorpius, which is located at a distance of 145 pc (de Zeeuw et al. 1999), provides a unique environment, particularly in terms of its age. While the age is only ∼5–10 Myr(Pecaut et al. 2012; Song et al. 2012), the lack of dense molecular material and embedded young stellar objects indicate that the star formation process in Upper Scorpius is over. The area is essentially free of dense gas and dust clouds, and the association members show only moderate extinctions (AV < 2 mag). In fact, there are only two K and M stars (1.5%), including the star discussed here, in the Upper Scorpius region which exhibit a K-band excess, although about half of the stars in Taurus exhibit a K-band excess (Strom et al. 1989). This implies that there are very few stars still hosting protoplanetary disks in Upper Scorpius star forming region.
Here, we introduce our target 2MASS J16042165-2130284 (hereafter J1604-2130) in Upper Scorpius. J1604-2130 was first identified as a member of the Upper Scorpius OB association in the spectroscopic survey of X-ray selected sources of Preibisch & Zinnecker (1999), who found: stellar age 3.7 Myr, spectral type K2, stellar mass 1 M⊙,
log Teff[K]=3.658, and log[L/L ⊙] = −0.118. The spectral energy distribution (SED) of J1604-2130 has the features of a transitional disk (Dahm & Carpenter 2009), in which
1Based on data collected at the Subaru Telescope, which is operated by the National Astronomical Observatory of Japan.
small dust grains have been partly cleared from the inner disk but are still abundant at larger radii. Recently, Mathews et al. (2012) presented the Sub-Millimeter Array (SMA) 880 µm images, which directly resolved a face-on protoplanetary disk around J1604-2130, and derived a dust mass of 0.1 MJup. The availability of radio data was one advantage to selecting this target, however other advantages abound and are as follows: 1. J1604-2130 is located in a nearby star forming region, Upper Sco; 2. it hosts one of the largest inner holes in transitional disks discovered to date; 3. it hosts the most massive disk in Upper Scorpius; 4. the inclination 6◦ ± 1.5◦ (Mathews et al. 2012) is very close to face-on.
Infrared photometry and spectroscopy with Spitzer has shown that less than ∼10% of stars with disks show some degree of inner disk depletion yet still retain massive outer disks (e.g., Cieza et al. 2010; Muzerolle et al. 2010; Luhman et al. 2011). Although there have been several transitional disks detected with radio observations with SMA around single young solar mass sources (e.g., Pi´etu et al. 2006; Andrews et al. 2011), only a handful of transitional disks have been detected in the near-infrared (e.g., Fukagawa et al. 2006; Thalmann et al. 2010; Hashimoto et al. 2011). This is mainly because it is difficult to resolve structures with only few 10 AU scale close to a bright central star. Furthermore, structures inside the hole of disks have rarely been directly imaged or resolved to date. To gain a better understanding of the morphological structures at radii where planets are expected to form, we conducted high-resolution near-infrared polarimetric observations of J1604-2130.
2. Observations and Data Reduction
We carried out polarimetry in H-band (1.6 µm) toward J1604-2130 using the high resolution imaging instrument HiCIAO (Tamura et al. 2006; Hodapp et al. 2006) with a dual-beam polarimeter at the Subaru 8.2 m Telescope on 2012 April 11. These observations
are part of the ongoing high-contrast imaging survey (SEEDS; Tamura 2009). The polarimetric observation mode acquires o-rays and e-rays simultaneously, and images a field of view of 10′′×20′′ with a pixel scale of 9.53 mas/pixel. J1604-2130 was observed without an occulting mask in order to image the inner most region around the central star. The exposures were performed at four position angles (P.A.s) of the half-wave plate, with a sequence of P.A. = 0◦, 45◦, 22.5◦, and 67.5◦ to measure the Stokes parameters. The integration time per wave plate position was 15 sec and we obtained twenty-five waveplate cycles. The adaptive optics system (AO188; Hayano et al. 2010) provides a diffraction limited and mostly stable stellar PSF. The total integration time of the polarization intensity (hereafter P I ) image was 750 sec after removing low quality images with large FWHMs by careful inspections of the stellar PSF.
The Image Reduction and Analysis Facility (IRAF2) software was used for all data reduction. The polarimetric data reduction technique is described by Hashimoto et al. (2011) and Muto et al. (2012), using the standard approach for polarimetric differential imaging (Hinkley et al. 2009). By subtracting two images of extraordinary and ordinary rays at each wave plate position, we obtained +Q, −Q, +U, and −U images, from which 2Q and 2U images were made by another subtraction to eliminate remaining aberration. The P I was then calculated by P I =pQ2+ U2. The instrumental polarization of HiCIAO at the Nasmyth platform was corrected for by following Joos et al. (2008).
2 IRAF is distributed by National Optical Astronomy Observatory, which is operated by the Association of Universities for Research in Astronomy, Inc., under cooperative agreement with the National Science Foundation.
3. Results
The H-band P I image of J1604-2130 is presented in Figure 1(a). The emission arises from dust particles mixed with gas in the circumstellar structures, scattering the stellar light. Details of the near-infrared disk around J1604-2130 have for the first time emerged at 0.07 arcsec. The disk has a dip D, located around a position angle ∼85◦, making this transitional disk asymmetric. Inside the bright disk, we see a region where the surface brightness drops by a factor of ∼5 compared with the disk. We call this inner lower-brightness region the “hole” throughout the remainder of this paper. Figure 1(b) shows H-band polarization vectors. The disk with its centrosymmetric polarization pattern surrounds the central source J1604-2130 as previously observed in other disks using the technique of near-infrared imaging polarimetry (e.g., Hashimoto et al. 2011).
Elliptical fitting was performed to measure several disk parameters including the angular separations of the major and minor axes, the position angle, inclination, and the position of the ellipse center. We first measured disk radial profiles in 5◦ position angle increments, and then extracted coordinates of the brightest peak area. Those coordinates were used to fit an ellipse. The nonlinear least-squares Levenburg-Marquardt algorithm with the above five free parameters was performed and its result is displayed in Table 1. Its shape is superimposed on Figure 1(a). The derived semimajor and semiminor axes are called “NIR peak radii” in this paper. The geometric center of the disk is consistent with the position of the star within errors. The disk position angle has a relatively large error because the disk is close to circular.
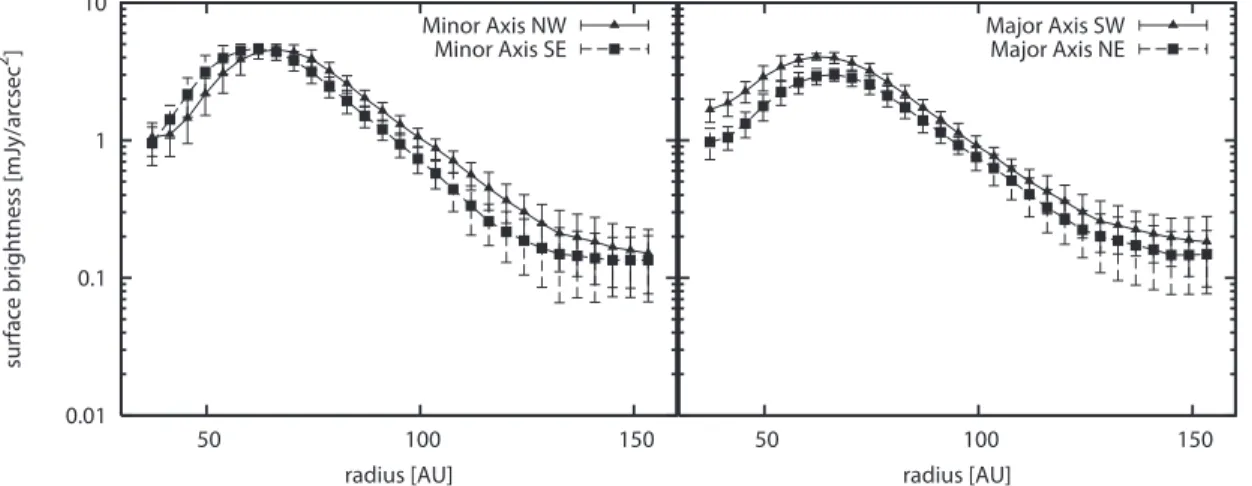
Figure 2 shows the azimuthal surface brightness at r = 33, 63, 145 AU, which are illustrated in figure 1(c), with the position angle measured from north to east. The error bars shown in figure 2 represent the calculated standard deviation. The left panel of figure 3 shows the radial surface brightness profile of J1604-2130 along the minor axis. The error
bars shown in figure 3 represent the calculated standard deviation. In the north, the surface brightness along the minor axis increases as r3.6±0.2 from 40 to 62 AU, and decreases as r−4.7±0.1 from 74 to 124 AU. In the south, the surface brightness along the minor axis increases as r3.0±0.4 from 40 to 62 AU, and decreases as r−4.7±0.2 from 74 to 124 AU. The right panel of Figure 3 shows the radial profile of the surface brightness along the major axis. In the east, the surface brightness along the major axis increases as r2.6±0.2 from 40 to 62 AU, and decreases as r−4.7±0.1 from 74 to 124 AU. In the west, the surface brightness along the major axis increases as r1.9±0.2 from 40 to 62 AU, and decreases as r−4.0±0.2 from 74 to 124 AU. The profiles along both the major and minor axes show a change of slope beyond 63 AU, thus reconfirming the NIR peak radius to be 63 AU. Along all four axes, the counts drop to half of the peak counts at around 50 AU from the central star. The width of the brightest region where counts exceeds half of the peak counts in the disk is around 30 AU.
A salient feature inside the hole is an elongated arc extending over the disk inner hole. It begins at the inner edge of the western side of the disk, extending inward first, then curving to the northeast. The whole arc extends at least 50 AU. This arc is equivalent in brightness to the inner edge of the disk and to the dip D region. This arc consists of a real feature and is not an artifact because in contrast to the inner hole errors (shown as squares in Figure 2), the surface brightness difference between the arc and the other regions in the inner hole has a 6σ significance, whereas the other directions show small fluctuations in emission. Furthermore, the polarization vectors in the region of the arc mostly face the central star as well as the region of the bright disk, indicating that the arc is also illuminated by central star and is physically connected to inner edge of the disk.
In the same way, the dip D is a real dip feature and is not an artifact because the difference in surface brightness between D and the rest of the disk is statistically significant
and not within errorbars. In addition, the polarization vectors in the region of the dip mostly face the central star.
There appears to be another dip located around a position angle ∼255◦, which is not azimuthally symmetric with D in terms of location and surface brightness. However, this another dip is not significant outside of the uncertainties of the observations, thus follow up future observations are required to confirm its presence.
4. Discussion
4.1. Comparison with the SMA Imaging
Mathews et al. (2012) present SMA 880 µm continuum and CO (3-2) line observations of this source with a resolution of 0′′.34 and resolve the disk (Figure 1(d)). They determine the surface density distribution of the disk with inner cavity whose radius is 72 AU based on the model fitting to the visibility at 880 µm. They also suggest that sparse matter still remains inside the cavity (20 - 72 AU) because of the dust emission indicated by mid-infrared (Carpenter et al. 2009) excesses and their model fitting. The NIR peak disk radius of 63 AU derived from our H-band image roughly agrees or may be slightly smaller than their measurement and can be explained by scattered light reflected at the inner edge of the disk.
Based on their CO peak velocity map, Mathews et al. (2012) derive the position angles of the major and minor axes to be 85◦ ± 10◦ and −5◦± 10◦, respectively. Their derive disk parameters, including the position angle and inclination, are in a good agreement with values derived from our near infrared observations.
Mathews et al. (2012) point out that the relatively high mass of the gas-dust disk, its sharp inner edge, and the lack of gas accretion onto the star together point to a dynamical
origin for the inner hole. No companions have been found down to brown dwarf masses (Kraus et al. 2008; Ireland et al. 2011). Based on their analysis, they suggest that the origin of the hole can be attributed to the unseen presence of one or several giant planets within about a 40 AU.
The width and depth of the hole depend on the planet mass, disk viscosity, and disk thickness (e.g., Takeuchi et al. 1996; Crida et al. 2006). As discussed by Dong et al. (2012)b, the radius of the inner hole is on the order of ∼ 60 - 70 AU. There have been extensive studies on the process of gap opening by a planet embedded in a disk (e.g., Lin & Papaloizou 1986; Takeuchi et al. 1996; Crida et al. 2006). A rough estimate of the upper limit of the size of the gap that one planet can make may be given by the location of the lowest order Lindblad resonances, which, in the case of the outer resonance (the outer edge of the gap), is at ∼1.6 times the orbital radius of the embedded planet (Takeuchi et al. 1996). If this is the case, the existence of the inner hole might indicate the existence of at least one planet at ∼40 - 50 AU from the central star (see also Crida et al. 2006), and the inner edge of the hole would be expected at ∼ 25 − 30 AU, which is inside of our saturation radius and is therefore unresolved in this study.
If multiple planets reside within the hole, the hole width can be wider and the inner disk may be much smaller than the single planet case (Zhu et al. 2011). To understand the properties of the whole of this object, it is important to give constraints on the inner disk structure using detailed SED modeling (see Dong et al. (2012)b) and/or high-resolution observations by ALMA. Our observations do not show a clear inner disk edge, suggesting that the inner disk radius must be inside of the saturation radius of our observations.
4.2. Non-axisymmetric Features
We list a few possibilities for origin of the two non-axisymmetric features, the dip and the arc since it is difficult to draw firm conclusions at this stage. According to Figure 6.(c) in Mathews et al. (2012), the only structures that are not reproduced by the axisymmetric disk model within 2σ error are the south-east component; the north dip is consistent with the axisymmetric disk model convolved with the elliptical beam. We, therefore, do not elaborate on the north dip on the sub-mm disk in the following discussions. Mathews et al. (2012) observe that the millimeter continuum emission has a peak at 0′′.5 southeast from the star in the 880 µm image. A similar distribution is also seen in the total integrated intensity distribution of CO (3-2) emission. Our H-band image and Figure 3 show that the southeast of the disk is brighter than the east and the west, despite the fact that we observe the scattered light originating at the disk surface. This may be explained in a way that the more materials exist, the thicker the disk is, resulting in a higher grazing angle of the stellar light at the scattering surface (e.g., Muto 2011). In our near-infrared image, the north of the disk is also bright. The brightness of the disk in the north, together with sub-mm observations suggesting material accumulation in the south, infers that the northern portion of the disk is the near side. This assumes that forward scattering dominates. If this picture of the disk orientation is correct, the disk rotation is counter-clockwise direction. This geometry might also explain the origins of the non-axisymmetric structures at D. D reside at the interface between where the material accumulated (south) and where forward scattering is significant (north). However, it should be noted that since the disk is nearly face-on, significant forward scattering excess and precise prescriptions of the phase function should be required, and our discussion crucially depends on the details of the optical properties of the dust particles. It should also be noted that the material concentration in the south is within 2σ of the current sub-mm data (Mathews et al. 2012). The detection of the non-axisymmetric structures at sub-mm wavelengths is needed to examine the details
of the disk geometry.
Another possibility for the origin of the dip D is that there is a massive gravitating object at the disk’s midplane. It could be a planet (which is not necessarily the same as the one discussed in the previous section as the origin of the inner hole), a clump formed by hydrodynamic instability (e.g., gravitational instability), or something else. Such objects can pull the materials from the surface toward the disk’s midplane, thereby producing a shadow in the scattered light image(Jang-Condell 2009). This might produce features such as D. Such objects have sizes smaller than the SMA beam size, therefore cannot be resolved with the SMA.
For the arc structure in the west, the morphology is similar to spiral density waves in the disk. An arguably uniqueness is that this arc extends over the “disk inner hole” region. It also resembles to spiral density waves in terms of the pitch angle. Spiral waves can be produced by dynamical processes in the disk such as the turbulence or the planet-disk interaction (see e.g., Papaloizou et al. 2007). If this feature is a spiral wave, its morphology indicates that the disk rotation is counter-clockwise because spirals are in general trailing features. This rotation direction is consistent with the picture presented at the beginning of this section. Last, we note that the arc structure shows morphological similarity to the
“planet shadows” discussed by Jang-Condell (2009). One possible way to distinguish the different scenarios is to observe the structures of the disk’s midplane at longer wavelength. For instance, if a density enhancement is observed at the location of D, this might indicate the existence of a massive body there. If we see an arc structure in the sub-mm as well, then it is likely a density wave.
Another possible way to reveal the nature of the arc may be the contemporaneous SED and scattered light observations. Previous studies indicate that substantial variability has also been seen in MIR SED and has been linked to variable structures including arcs
or rims of the disk (Dahm & Carpenter 2009; Wisniewski et al. 2008; Muzerolle et al. 2009; Espaillat et al. 2011; Flaherty et al. 2012). For J1604-2130 case, the location of the arc and the rim of the disk wall is generally consistent with the radial location in the disk which possibly contributes to the SED variability.
We thank the telescope staff and operators at the Subaru Telescope for their assistance. We also thank our referee for the constructive comments that have helped to improve this manuscript. Part of this research was carried out at the JPL, under a contract with the NASA. This work is partially supported by a Grant-in-Aid for Science Research in a Priority Area from MEXT 22000005(M. T.), KAKENHI 23103004(M. M. and M. F.), 24103504(T. T.), 24840037(T. M.), US NSF grant 1009314(J. P. W.), and 1009203(J. C). This work was supported in part by the Center for the Promotion of Integrated Sciences (CPIS) of The Graduate University for Advanced Studies (SOKENDAI).
REFERENCES
Andrews, S. M., Wilner, D. J., Hughes, A. M., Qi, C., & Dullemond, C. P. 2009, ApJ, 700, 1502
Andrews, S. M., Wilner, D. J., Espaillat, C., et al. 2011, ApJ, 732, 42
Carpenter, J. M., Mamajek, E. E., Hillenbrand, L. A., & Meyer, M. R. 2009, ApJ, 705, 1646
Cieza, L. A., Schreiber, M. R., Romero, G. A., et al. 2010, ApJ, 712, 925
Crida, A., Morbidelli, A., & Masset, F. 2006, Icarus, 181, 587
de Zeeuw, P. T., Hoogerwerf, R., de Bruijne, J. H. J., Brown, A. G. A., & Blaauw, A. 1999, AJ, 117, 354
Dahm, S. E., & Carpenter, J. M. 2009, AJ, 137, 4024
Dong, R., Rafikov, R., Zhu, Z., et al. 2012a, ApJ, 750, 161
Dong, R., et al. 2012b, ApJ, submitted.
Espaillat, C., Furlan, E., D’Alessio, P., et al. 2011, ApJ, 728, 49
Flaherty, K. M., Muzerolle, J., Rieke, G., et al. 2012, ApJ, 748, 71
Fukagawa, M., Tamura, M., Itoh, Y., et al. 2006, ApJ, 636, L153
Furlan, E., Hartmann, L., Calvet, N., et al. 2006, ApJS, 165, 568
Hashimoto, J., Tamura, M., Muto, T., et al. 2011, ApJ, 729, L17
Hayano, Y., Takami, H., Oya, S., et al. 2010, Proc. SPIE, 7736, 21
Hinkley, S., Oppenheimer, B. R., Soummer, R., et al. 2009, ApJ, 701, 804
Hodapp, K. W., Tamura, M., Suzuki, R., et al. 2006, Proc. SPIE, 6269, 62693V
Ireland, M. J., Kraus, A., Martinache, F., Law, N., & Hillenbrand, L. A. 2011, ApJ, 726, 113
Jang-Condell, H. 2009, ApJ, 700, 820
Joos, F., Buenzli, E., Schmid, H. M., & Thalmann, C. 2008, Proc. SPIE, 7016, 48
Kenyon, S. J., & Hartmann, L. 1995, ApJS, 101, 117
Kraus, A. L., Ireland, M. J., Martinache, F., & Lloyd, J. P. 2008, ApJ, 679, 762
Lin, D. N. C., & Papaloizou, J. 1986, ApJ, 307, 395
Luhman, K. L., Burgasser, A. J., & Bochanski, J. J. 2011, ApJ, 730, L9
Mathews, G. S., Williams, J. P., M´enard, F., et al. 2012a, ApJ, 745, 23
Mathews, G. S., Williams, J. P., & M´enard, F. 2012b, ApJ, 753, 59
McClure, M. 2009, ApJ, 693, L81
Muto, T. 2011, ApJ, 739, 10
Muto, T., Grady, C. A., Hashimoto, J., et al. 2012, ApJ, 748, L22
Muzerolle, J., Flaherty, K., Balog, Z., et al. 2009, ApJ, 704, L15
Muzerolle, J., Allen, L. E., Megeath, S. T., Hern´andez, J., & Gutermuth, R. A. 2010, ApJ, 708, 1107
Song, I., Zuckerman, B., & Bessell, M. S. 2012, AJ, 144, 8
Papaloizou, J. C. B., Nelson, R. P., Kley, W., Masset, F. S., & Artymowicz, P. 2007, Protostars and Planets V, 655
Pecaut, M. J., Mamajek, E. E., & Bubar, E. J. 2012, ApJ, 746, 154
Pi´etu, V., Dutrey, A., Guilloteau, S., Chapillon, E., & Pety, J. 2006, A&A, 460, L43
Preibisch, T., & Zinnecker, H. 1999, AJ, 117, 2381
Strom, K. M., Strom, S. E., Edwards, S., Cabrit, S., & Skrutskie, M. F. 1989, AJ, 97, 1451
Takeuchi, T., Miyama, S. M., & Lin, D. N. C. 1996, ApJ, 460, 832
Tamura, M., Hodapp, K., Takami, H., et al. 2006, Proc. SPIE, 6269, 28
Tamura, M. 2009, in AIP Conf. Proc. 1158, Exoplanets and Disks: Their Formationand Diversity: Proc. of the Intl. Conf., ed. T. Usuda,M. Ishii, & M. Tamura (Melville, NY: AIP), 11
Thalmann, C., Grady, C. A., Goto, M., et al. 2010, ApJ, 718, L87
Wisniewski, J. P., Clampin, M., Grady, C. A., et al. 2008, ApJ, 682, 548
Zhu, Z., Nelson, R. P., Hartmann, L., Espaillat, C., & Calvet, N. 2011, ApJ, 729, 47
This manuscript was prepared with the AAS LATEX macros v5.2.
Fig. 1.— H-band HiCIAO images of J1604-2130. The saturated central area (radius = 0.′′2) is masked in black. (a): The P I image of J1604-2130. The field of view (FOV) is 2′′.9 × 2′′.9. The unit of the color bar is mJy/arcsec2. The light blue ellipse and plus sign are the best fit result of our elliptical disk model and the ellipse center. (b): H-band polarization vectors superposed on the P I image. The vector directions indicate angles of polarization. The plotted vectors are based on 7 [pixel] × 7 [pixel] binning corresponding to the spatial resolution. The FOV is 2′′.0 × 2′′.0. The vector’s lengths are arbitrary. (c):Red(r= 145 AU), brown(r = 63 AU), and yellow(r = 33 AU) circles, corresponding figure 2, superimposed on the P I image. (d):SMA 880 µm continuum map (Mathews et al. 2012) superimposed on the P I image. White color contours indicate 2, 3, 6, 9, and 12σ intensity (1σ = 1.3 mJy/beam). The ∼ 0.′′5 × 0.′′3 beam of SMA is shown in the bottom right.
.
7 6 5 4 3 2 1
300 240
180 120
60 surface brightness[mJy/arcsec2 ]
Position Angle[deg]
r=33[AU] r=63[AU] r=145[AU] dip D
arc
Fig. 2.— Azimuthal surface brightness profile at r = 33 AU (inner hole region), r = 63 AU (inner disk region), and r= 145 AU (outer region) with position angle measured from north to east. The radius 33 AU is measured as it is the brightest part of the arc.
.
0.01 0.1 1 10
150 100
50 surface brightness [mJy/arcsec2 ]
radius [AU]
Minor Axis NW Minor Axis SE
150 100
50
radius [AU]
Major Axis SW Major Axis NE
Fig. 3.— Left Panel:Radial profile along the minor axis. NW and SE radial profile are averaged over -25◦ <P.A. < 5◦ and 155◦ <P.A. < 185◦, respectively. This is because the disk position angle derived from our near-infrared image and peak velocity of the submm CO emission (−5◦± 10◦) are 9◦ different. Therefore, we centered our 30◦ wide radial profiles on the average of our near-infrared and submm line emission. Right Panel:Radial profile along the major axis. In the same way, NE and SW radial profiles are averaged over 65◦ <P.A.
< 95◦ and 245◦ <P.A. < 275◦, respectively. .
Table 1: The result of the ellipse fitting for the disk of J1604-2130
Semimajor axis 63.4 ± 1.0 [AU]
Semiminor axis 62.4 ± 1.0 [AU]
Ellipse center (u,v)a (−1.1 ± 1.1, 1.5 ± 1.1) [pixel]
Position angle −14 ± 11◦
Inclination 10.2 ± 10.1◦
aCentral position (0, 0) corresponds to the stellar position.