メタボリックシンドロームに係わるリスクと生活習慣の関連性
沖
典男
1*
髙本
美紀
2Association Between Metabolic Syndrome Risks and Lifestyle Habits
Norio O
KI 1* and Miki K
OMOTO21
Infectious Disease Research Division
,
Public Health Science Research Center, Hyogo Prefectural
Institute of Public Health and Consumer Sciences, 2-1-29, Arata-cho, Hyogo-ku, Kobe 652-0032,
Japan and
2Employee Clinic,
Civil Policy Planning & Administration Department, Hyogo
Prefectural Government, Kobe 650-8567, Japan
Regular medical checkup data of Hyogo prefectural government employees in 2006 and 2007 were analyzed to examine
association between metabolic syndrome risks such as obesity risk, glucose intolerance risk, dyslipidemia risk and high blood pressure risk and lifestyle habit factors.
It was found that the obesity risk was associated with “amount of eating”, “consciousness on the balance of diet and exercise”, “eating fatty food” and “consciousness on amount of exercise”.
The glucose intolerance risk was associated with “personal outlook on own health” and “eating and drinking at night”.
The dyslipidemia risk was associated with “personal outlook on own health”, “consciousness on amount of exercise”, “smoking history”, “eating fatty food” and “amount of alcohol drinking per one day”.
The high blood pressure risk was associated with “personal outlook on own health”, “amount of alcohol drinking per one day”, “frequency of drinking”, “amount of eating” and “consciousness about moving own body”.
Ⅰ
はじめに
2008
年の日本人の平均寿命は男性
79.29
年,女性
86.05
年となっている.国により生命表作成基礎期間等
が異なるため厳密な比較はできないが,日本は男女とも
に世界有数の長寿国の一つである
1).しかし,日本人の
生活習慣の変化や高齢者の増加等により,近年,糖尿病
等の生活習慣病が増加している.そして生活習慣病は,
国民一人一人の生活の質(
QOL
)を低下させるだけでな
く,医療費の増加に大きく寄与していることが問題であ
ると指摘されている
2).
感染症部
沖
典男
生活習慣病は適切な生活習慣の実践により予防可能で
あるため,
適切な対策により生活習慣病を減少できれば,
医療費の延びを抑えることができると考えられる.この
ために国は,生活習慣病予防を推進するための対策とし
て,メタボリックシンドローム(内臓脂肪症候群)の概
念を活用した特定健診・特定保健指導制度を
2008
年
4
月に導入した
3).
特定健診・特定保健指導は,健康診査により生活習慣
の改善が必要な者を抽出し,保健指導を実施することに
より生活習慣病を予防することが目的である.このため
に兵庫県は,
健診結果から判定した生活習慣病リスクや,
リスクの改善方法を健診受診者に提示するプログラム
(健康増進プログラム)を用いた施策を展開している
4).
1
感染症部
2兵庫県企画県民部職員健康管理センター
*別刷請求先:〒
652
-
0032
神戸市兵庫区荒田町
2
-
1
-
29
兵庫県立健康生活科学研究所
健康科学研究センター
兵庫県立健康生活科学研究所健康科学研究センター研究報告 第1号2010
ずしも明らかになっていない.このため著者らは,兵庫
県職員の健診データ用いて,メタボリックシンドローム
に係わるリスクと生活習慣の関連性について解析した.
Ⅱ
材料と方法
2006
年及び
2007
年に兵庫県職員を対象に実施した定
期健診データ及び生活習慣調査(健康増進プログラム質
問票)データから,健診受診者が
2007
年の健診実施時
に
30
歳以上
70
歳未満で,生活習慣調査入力データに不
備が認められなかった
9,912
名を解析対象とした.解析
のために入手したデータは,連結不可能匿名化されてい
た.
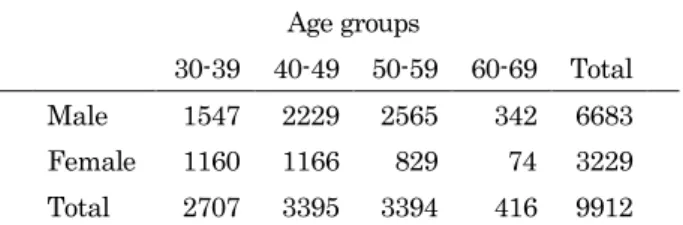
Table 1
に,性・年齢階級別対象者数を示す.
Table 1 Subjects by gender and age groups
Age groups
30-39 40-49 50-59 60-69 Total Male 1547 2229 2565 342 6683 Female 1160 1166 829 74 3229
Total 2707 3395 3394 416 9912
内臓脂肪蓄積リスク,血糖リスク,脂質リスク及び血
圧リスク等,メタボリックシンドロームに係わる各リス
クの保有状況は,
「標準的な健診・保健指導プログラム
(確
定版)
3)」に基づいて判定した.これらの判定結果と喫
煙歴から,解析対象者を積極的支援レベル,動機づけ支
援レベル及び情報提供レベルに分類した.内臓脂肪蓄積
リスクは腹囲と
BMI
に関する基準から
2
つのカテゴリ
ーに分類されるが,例数の少ないカテゴリーが存在した
ため,両者を肥満リスクとして併合し解析に用いた.解
析は以下の手順で行った.
1
.
対象者のリスク保有状況と保健指導レベルの状況
対象者の
2006
年及び
2007
年健診時の肥満リスク,
血
糖リスク,脂質リスク及び血圧リスクの保有状況と保健
指導レベルを判定し,リスクの改善と悪化について解析
した.
2
.
2006
年のリスク保有と生活習慣の関連性
2006
年のリスク保有に関連する要因の検討では,
2006
年の“リスク有無”を従属変数(目的変数)
,
2006
年の“生活習慣”と“年齢階級”を独立変数(要因)と
して,ロジスティック回帰分析を適用した.ここでは全
ての要因を質的データとして処理した.
3
.
2007
年のリスク保有と
2006
年のリスク保有,生活
習慣及び生活習慣変化の関連性
生活習慣が肥満等のリスクに繋がる経路として,既存
のリスク有無が変化しない経路,変化なく継続する生活
習慣が新たなリスクに繋がる経路,生活習慣の変化がリ
スク保有状況を改善または悪化させる経路が考えられる.
このため,
2007
年のリスク保有に関連する要因の検討で
は,
2007
年の“リスク有無”を目的変数,
2006
年の“リ
スク有無”
,
2006
年の“生活習慣”
,
“年齢階級”
,
2006
年と
2007
年の“生活習慣の変化”を要因として,ロジ
スティック回帰分析を適用した.
新たに導入した変数
“生
活習慣の変化”の値は,質的データである“生活習慣”
の各カテゴリーを数量化し,
2007
年と
2006
年の値の
“差”として求めた.健康増進プログラム質問票では,
“生活習慣”の回答選択肢に順序(生活習慣が良い方か
らの悪い方への順序)が与えられていることから,
“生活
習慣”のカテゴリー得点として選択肢番号を用いた.し
たがって“生活習慣の変化”は,値が正のとき生活習慣
の悪化を,
値が負のとき生活習慣の改善を意味している.
4
.
リスクの“改善なし”
,
“悪化”と
2006
年の生活習
慣及び生活習慣変化の関連性
2007
年のリスクの“改善なし”に関連する要因の検討
では,
2006
年のリスク保有者を対象として,
リスクが
“改
善していない”ことに関連する要因を解析した.ここで
は
2007
年の“リスク有無”を目的変数,
2006
年の“生
活習慣”
,
“年齢階級”及び“生活習慣の変化”を要因と
して,ロジスティック回帰分析を適用した.
リスクの“悪化”に関連する要因の検討では,
2006
年のリスク非保有者を対象として解析した.ここでは
2007
年の“リスク有無”を目的変数,
2006
年の“生活
習慣”
,
“年齢階級”及び“生活習慣の変化”を要因とし
て,ロジスティック回帰分析を適用した.
リスクの改善と悪化は保健指導レベルの変化に直接関
係する.したがって,保健指導レベルの変化は上記解析
結果を反映した結果となる.ここでは保健指導レベルの
変化と生活習慣の関連性を明示するために,
“積極的支援
レベルからの変化なし(改善なし)
”と“情報提供レベル
からの変化(悪化)
”を目的変数として,上記と同様の解
析を行った.ただし“喫煙歴”は保健指導レベルの判定
に直接関係するため,要因から除外して解析を進めた.
ロジスティック回帰分析では尤度比検定による変数増加
法を採用し,各要因の影響を相互に調整したオッズ比を
求めた.統計解析ソフトとして
SPSS12J for Windows
Ⅲ
結果および考察
以下に結果を示す.一部の結果は
Table
で示したが,
紙面の都合上,それ以外の結果は特徴を記述するにとど
めた.
1
.
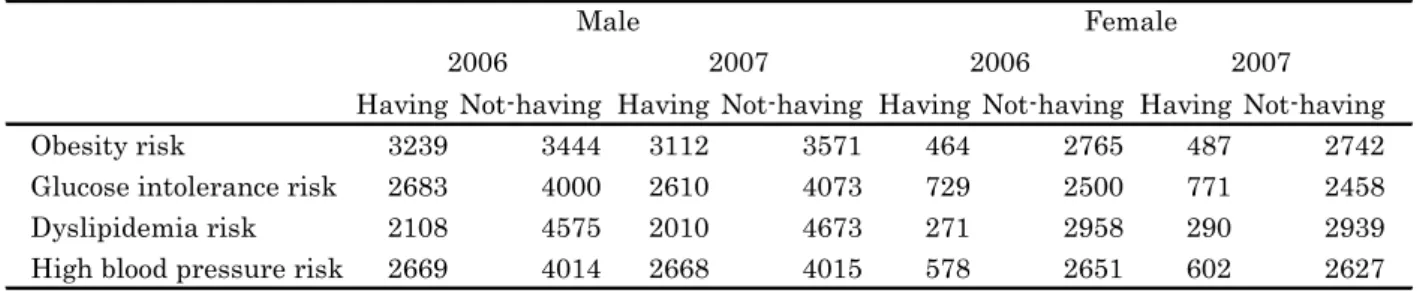
各リスクの保有状況と保健指導レベルの状況
Table 2
と
3
に,対象者のリスク保有状況と保健指導
レベルの状況を示す.
2006
年と
2007
年を比較すると,肥満リスク,血糖リ
スク,脂質リスク及び血圧リスクの全てに関して,
2006
年より
2007
年の方が,男性ではリスク保有者数が減少
し,女性では増加していた.
リスク保有状況の変化には,リスク“あり”から“な
し”への変化(改善)と,リスク“なし”から“あり”
への変化(悪化)の両方がある.
Table
には示していな
いが,
2006
年の“リスク有無”と
2007
年の“リスク有
無”をクロス集計した結果,肥満リスクでは,男性は改
善
492
名,
悪化
365
名で改善が多く,
女性は改善
51
名,
悪化
74
名で悪化が多くなっていた.この傾向は他のリ
スクでも同様で,全てのリスクで,男性は改善が多く女
性は悪化が多くなっていた.
保健指導レベルに関しては,
2006
年より
2007
年の方
が,男性の場合は積極的支援レベル該当者数が減少し,
動機づけ支援レベル該当者数と情報提供レベル該当者数
が増加していた.女性の場合は,
2006
年より
2007
年の
方が,積極的支援レベル該当者数と動機づけ支援レベル
該当者数が増加し,情報提供レベル該当者数が減少して
いた.
2006
年の保健指導レベルと
2007
年の保健指導レベル
をクロス集計した結果では,男性の場合は,
2006
年の積
極的支援レベルから
2007
年の動機づけ支援レベルまた
は情報提供レベルに
533
名が改善し,
2006
年の情報提
供レベルから
2007
年の動機づけ支援レベルまたは積極
的支援レベルに
474
名が悪化していた.女性の場合は,
2006
年の積極的支援レベルから
2007
年の動機づけ支援
レベルまたは情報提供レベルに
46
名が改善し,
2006
年
の情報提供レベルから
2007
年の動機づけ支援レベルま
たは積極的支援レベルに
91
名が悪化していた.
Table 2 Prevalence of risks on metabolic syndrome of the subjects
Having Not-having Having Not-having Having Not-having Having Not-having Obesity risk 3239 3444 3112 3571 464 2765 487 2742 Glucose intolerance risk 2683 4000 2610 4073 729 2500 771 2458 Dyslipidemia risk 2108 4575 2010 4673 271 2958 290 2939 High blood pressure risk 2669 4014 2668 4015 578 2651 602 2627
2006 2007 2006 2007
Male Female
Table 3 Health guidance level of the subjects
2006 2007 2006 2007 1813 1708 134 145 766 809 172 184 4104 4166 2923 2900 Motivation support level
Dissemination level
Male Female
Positive support level
2
.
2006
年のリスク保有と生活習慣の関連性
Table 4
に,男性の肥満リスクに関連する要因の解析
結果を示す.採択された要因は,オッズ比が有意に
1
を
超えるとき危険因子,
1
未満のとき予防因子を意味する
が,
“生活への充実感”のように,目的変数との間の原因・
結果関係が不明な要因については,本研究では評価の対
象から除外した
.
2006
年の肥満リスクには,
“食事の量”
,
“年齢階級”
,
“主観的健康観”
,
“健康維持・増進活動の実践”
,
“食事
と運動のバランスに関する意識”
,
“脂っこい料理の摂食
頻度”
,等が関連していた.女性の場合は,
“年齢階級”
,
“食事の量”
,
“食事と運動のバランスに関する意識”
,
“主
観的健康観”
,
“脂っこい料理の摂食頻度”
,等が関連して
いた.
2006
年の血糖リスクと要因の関連性では,
男性の場合
は,
“年齢階級”
,
“主観的健康観”
,
“
1
日の飲酒量”
,等
が関連していた.女性の場合は,
“年齢階級”と“規則正
しい生活”が関連していた.
2006
年の脂質リスクと要因の関連性では,
男性の場合
は,
“主観的健康観”
,
“喫煙歴”
,
“年齢階級”
,
“ラジオ体
操等をする頻度”
,
“食事の量”
,
“
1
日の飲酒量”
,等が関
連していた.
女性の場合は,
“年齢階級”
,
“主観的健康観”
,
“脂っこい料理の摂食頻度”
,等が関連していた.
2006
年の血圧リスクと要因の関連性では,
男性の場合
は,
“年齢階級”
,
“
1
日の飲酒量”
,
“主観的健康観”
,
“飲
酒頻度”
,等が関連していた.女性の場合は,
“年齢階級”
,
兵庫県立健康生活科学研究所健康科学研究センター研究報告 第1号2010
以上のように,多くのリスクに関連する要因は,男女と
も“年齢階級”及び“主観的健康観”で,これらの要因
はほぼ全てのリスクに関連していた.また,男性では,
“
1
日の飲酒量”が血糖,脂質,血圧の各リスクに関連
していた.女性では,
“脂っこい料理の摂食頻度”が肥満
リスク及び脂質リスクに関連していた.
“食事の量”
と
“食
事と運動のバランスに関する意識”は,男女とも,肥満
リスクに関連していた.
Table4 Multivariate adjusted odds ratios for the obesity risk in 2006 (Male)
Factor Category OR Test
30-39 years of age 1.00
40-49 1.67 1.45 , 1.92 *** 50-59 2.52 2.18 , 2.92 *** 60-69 3.04 2.35 , 3.94 *** considerably-high 1.00
a little high 1.16 0.89 , 1.50 normal 1.12 0.86 , 1.45 a little low 1.58 1.18 , 2.10 ** considerably-low 0.99 0.74 , 1.34 considerably-high 1.00
a little high 0.59 0.42 , 0.82 ** normal 0.67 0.49 , 0.92 * a little low 0.53 0.38 , 0.75 *** considerably-low 0.63 0.43 , 0.90 * more than 3 or 4 times a week 1.00
1 or 2 times a week 1.25 1.01 , 1.55 * about once 2 weeks 1.58 1.22 , 2.03 *** about once a month 1.38 1.06 , 1.79 * not doing 1.33 1.08 , 1.62 ** playing exercise or sports 1.00
going out for walk or shopping 1.23 1.03 , 1.47 * doing something in a house or a
garden 0.99 0.81 , 1.22 often staying in a house 1.13 0.93 , 1.37 doing nothing but staying in a house 1.13 0.88 , 1.45 considerably few 1.00
eating moderately 0.99 0.65 , 1.51 not eating too much 1.50 1.00 , 2.25 eating a little much 2.87 1.89 , 4.36 *** eating too much 2.35 1.44 , 3.85 *** taking care 1.00
if anything taking care 0.88 0.76 , 1.02 if anything not taking care 0.80 0.67 , 0.96 * not taking care 0.72 0.58 , 0.89 ** at every meal 1.00
two meals a day 0.80 0.70 , 0.93 ** one meal a day 0.85 0.74 , 0.98 * 3 or 4 meals a week 0.85 0.70 , 1.03 not so many 1.16 0.84 , 1.59 a little 1.00
if anything a little 1.18 1.00 , 1.38 normal 1.35 1.14 , 1.60 *** if anything many 1.76 1.39 , 2.23 *** many 2.25 1.45 , 3.49 ***
95%CI Age groups
Consciousness on the balance of diet and exercise
Taking care for the nutrient balance when eating-out or buying daily dish
Eating fatty food Eating vegetable
Consciousness on the balance of own body
Frequency of exercise like radio gymnastics
Custom of spending free time
Table4 Multivariate adjusted odds ratios for the obesity risk in 2006 (Male) (continued)
Factor Category OR Test
everyday 1.00
3 or 4 times a week 0.98 0.86 , 1.13 1 or 2 times a week 1.06 0.91 , 1.22 not so many 0.84 0.73 , 0.98 * not taking 0.66 0.47 , 0.92 * very healthy 1.00
healthy 1.25 0.91 , 1.72 so so level of healthy 1.43 1.04 , 1.97 * not so healthy 2.25 1.59 , 3.18 *** unhealthy 2.62 1.66 , 4.11 *** considering and practicing so much 1.00
considering and practicing 1.18 0.88 , 1.59 considering but not practicing so much 1.59 1.17 , 2.17 ** neither considering nor practicing 1.27 0.86 , 1.88 feeling always 1.00
feeling so so 0.61 0.45 , 0.82 *** feeling not so many 0.51 0.37 , 0.69 *** feeling never 0.43 0.29 , 0.66 *** never ever smoking 1.00
equal to or more than 5 years since not
smoking 1.18 1.02 , 1.35 * equal to or more than 1 year and less
than 5 years since not smoking 1.41 1.13 , 1.76 ** less than 1 year since not smoking 1.22 0.89 , 1.67 smoking 1.19 1.04 , 1.35 ** biting more than 30 times every time 1.00
biting many times 1.17 0.71 , 1.91 not biting so many times 1.35 0.82 , 2.21 almost swallowing 1.63 0.89 , 2.99 OR: odds ratio; 95%CI: 95% confidence interval; *: p < 0.05; **:p < 0.01; ***:p < 0.001
95%CI
Practice of action for health maintenance and improvement
Sense of fulfillment on the daily life
Smoking history
Biting by teeth enough when eating
Frequency of taking milk and milk products
Personal outlook on own health
3
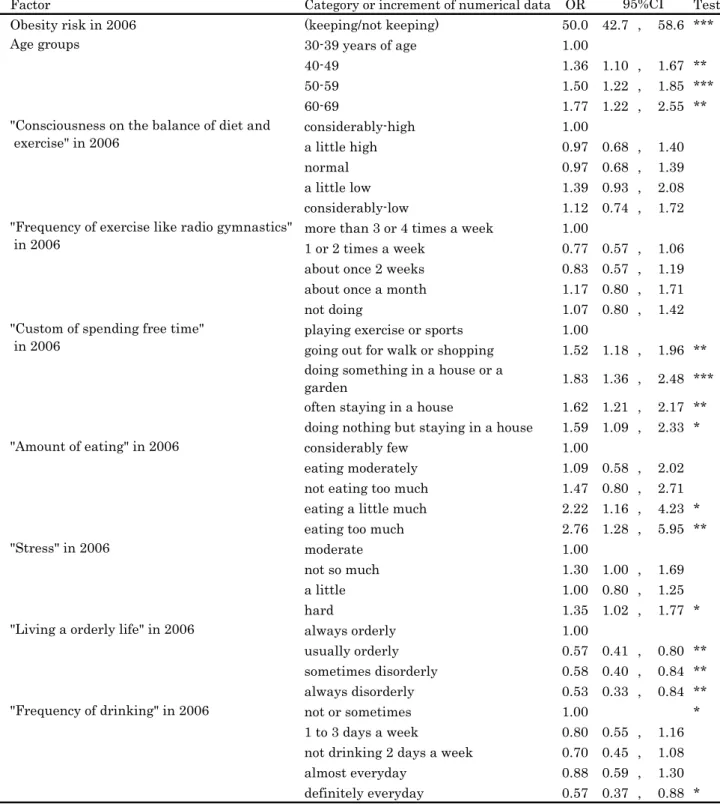
.
2007
年のリスク保有と
2006
年のリスク保有,生活
習慣及び生活習慣変化の関連性
Table 5
に,男性の
2007
年の肥満リスクに関連する要
因の解析結果を示す.
2007
年の肥満リスクには,
2006
年の“肥満リスク”が最も強く関連し,
“年齢階級”も関
連していた.
“生活習慣の変化”では,
“食事の量の変化”
,
“食事と運動のバランスに関する意識の変化”
,
“運動施
設を利用する頻度の変化”
,
“運動量に関する意識の変化”
,
“自由時間の過ごし方の変化”が関連していた.
2006
年の“生活習慣”では,
“食事の量”
,
“自由時間の過ごし
方”
,
“
1
日の飲酒量”
,
“食事と運動のバランスに関する
意識”が関連していた.女性の場合は,
2006
年の“肥満
リスク”
,
“食事と運動のバランスに関する意識の変化”
,
“夜間の飲食の変化”
,
2006
年の“食事と運動のバラン
スに関する意識”が関連していた.
2007
年の血糖リスクには,男性の場合は,
2006
年の
“血糖リスク”
,
“年齢階級”
,
2006
年の“主観的健康観”
,
“主観的健康観の変化”
が関連していた.
女性の場合は,
2006
年の“血糖リスク”
,
“年齢階級”
,
“味付け感覚の変
化”
,
“主観的健康観の変化”が関連していた.
2007
年の脂質リスクには,男性の場合は,
2006
年の
“脂質リスク”
,
“年齢階級”
,
“運動量に関する意識の変
化”
,
“脂っこい料理の摂食頻度の変化”
,
“主観的健康観
の変化”
,
2006
年の“主観的健康観”
,
“喫煙歴”
,
“身体
を動かすことに関する意識”が関連していた.女性の場
合は,
2006
年の“脂質リスク”
,
“年齢階級”
,
2006
年の
“塩辛い物の摂食頻度”
,
“ストレス”が関連していた.
2007
年の血圧リスクには,男性の場合は,
2006
年の
“血圧リスク”
,
“年齢階級”
,
“主観的健康観の変化”
,
“食
事の量の変化”
,
2006
年の“主観的健康観”
,
“
1
日の飲
酒量”が関連していた.女性の場合は,
2006
年の“血圧
リスク”
,
“年齢階級”
,
“身体を動かすことに関する意識
の変化”
,
2006
年の“飲酒頻度”及び“主観的健康観”
兵庫県立健康生活科学研究所健康科学研究センター研究報告 第1号2010
以上のように,
2007
年のほぼ全てのリスクに
2006
年
の“当該リスク”と“年齢階級”が関連していた.
2006
年の“主観的健康観”及び“主観的健康観の変化”は,
男性の血糖,脂質,血圧の各リスクに関連していた.
2006
年の“
1
日の飲酒量”と“食事の量の変化”は,男性の
肥満リスク及び血圧リスクに関連していた.
“運動量に関
する意識の変化”は,男性の肥満リスク及び脂質リスク
に関連していた.
2006
年の“食事と運動のバランスに関
する意識”と“食事と運動のバランスに関する意識の変
化”は,男女とも肥満リスクに関連していた.
Table 5 Multivariate adjusted odds ratios for the obesity risk in 2007 (Male)
Factor Category or increment of numerical data OR Test Obesity risk in 2006 (keeping/not keeping) 50.0 42.7 , 58.6 ***
30-39 years of age 1.00
40-49 1.36 1.10 , 1.67 ** 50-59 1.50 1.22 , 1.85 *** 60-69 1.77 1.22 , 2.55 ** considerably-high 1.00
a little high 0.97 0.68 , 1.40 normal 0.97 0.68 , 1.39 a little low 1.39 0.93 , 2.08 considerably-low 1.12 0.74 , 1.72 more than 3 or 4 times a week 1.00
1 or 2 times a week 0.77 0.57 , 1.06 about once 2 weeks 0.83 0.57 , 1.19 about once a month 1.17 0.80 , 1.71 not doing 1.07 0.80 , 1.42 playing exercise or sports 1.00
going out for walk or shopping 1.52 1.18 , 1.96 ** doing something in a house or a
garden 1.83 1.36 , 2.48 *** often staying in a house 1.62 1.21 , 2.17 ** doing nothing but staying in a house 1.59 1.09 , 2.33 * considerably few 1.00
eating moderately 1.09 0.58 , 2.02 not eating too much 1.47 0.80 , 2.71 eating a little much 2.22 1.16 , 4.23 * eating too much 2.76 1.28 , 5.95 ** moderate 1.00
not so much 1.30 1.00 , 1.69 a little 1.00 0.80 , 1.25 hard 1.35 1.02 , 1.77 * always orderly 1.00
usually orderly 0.57 0.41 , 0.80 ** sometimes disorderly 0.58 0.40 , 0.84 ** always disorderly 0.53 0.33 , 0.84 ** not or sometimes 1.00 * 1 to 3 days a week 0.80 0.55 , 1.16 not drinking 2 days a week 0.70 0.45 , 1.08 almost everyday 0.88 0.59 , 1.30 definitely everyday 0.57 0.37 , 0.88 * "Living a orderly life" in 2006
"Frequency of drinking" in 2006 Age groups
95%CI
"Consciousness on the balance of diet and exercise" in 2006
"Frequency of exercise like radio gymnastics" in 2006
"Custom of spending free time" in 2006
"Amount of eating" in 2006
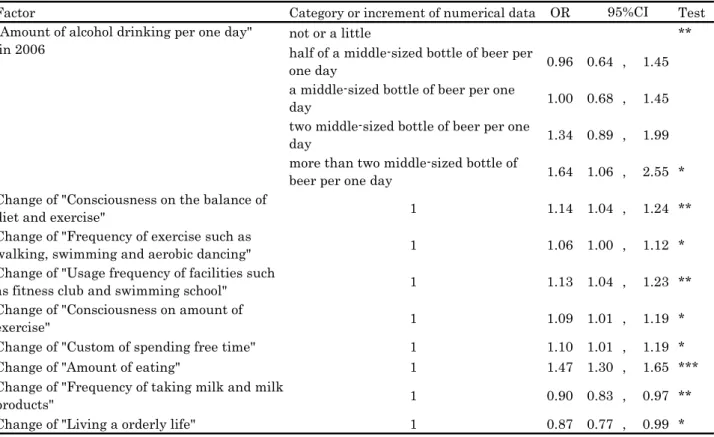
Table 5 Multivariate adjusted odds ratios for the obesity risk in 2007 (Male) (continued)
Factor Category or increment of numerical data OR Test
not or a little **
half of a middle-sized bottle of beer per
one day 0.96 0.64 , 1.45 a middle-sized bottle of beer per one
day 1.00 0.68 , 1.45 two middle-sized bottle of beer per one
day 1.34 0.89 , 1.99 more than two middle-sized bottle of
beer per one day 1.64 1.06 , 2.55 * Change of "Consciousness on the balance of
diet and exercise" 1 1.14 1.04 , 1.24 ** Change of "Frequency of exercise such as
walking, swimming and aerobic dancing" 1 1.06 1.00 , 1.12 * Change of "Usage frequency of facilities such
as fitness club and swimming school" 1 1.13 1.04 , 1.23 ** Change of "Consciousness on amount of
exercise" 1 1.09 1.01 , 1.19 * Change of "Custom of spending free time" 1 1.10 1.01 , 1.19 * Change of "Amount of eating" 1 1.47 1.30 , 1.65 *** Change of "Frequency of taking milk and milk
products" 1 0.90 0.83 , 0.97 ** Change of "Living a orderly life" 1 0.87 0.77 , 0.99 * "Amount of alcohol drinking per one day"
in 2006
OR: odds ratio; 95%CI: 95% confidence interval; *: p < 0.05; **:p < 0.01; ***:p < 0.001
95%CI
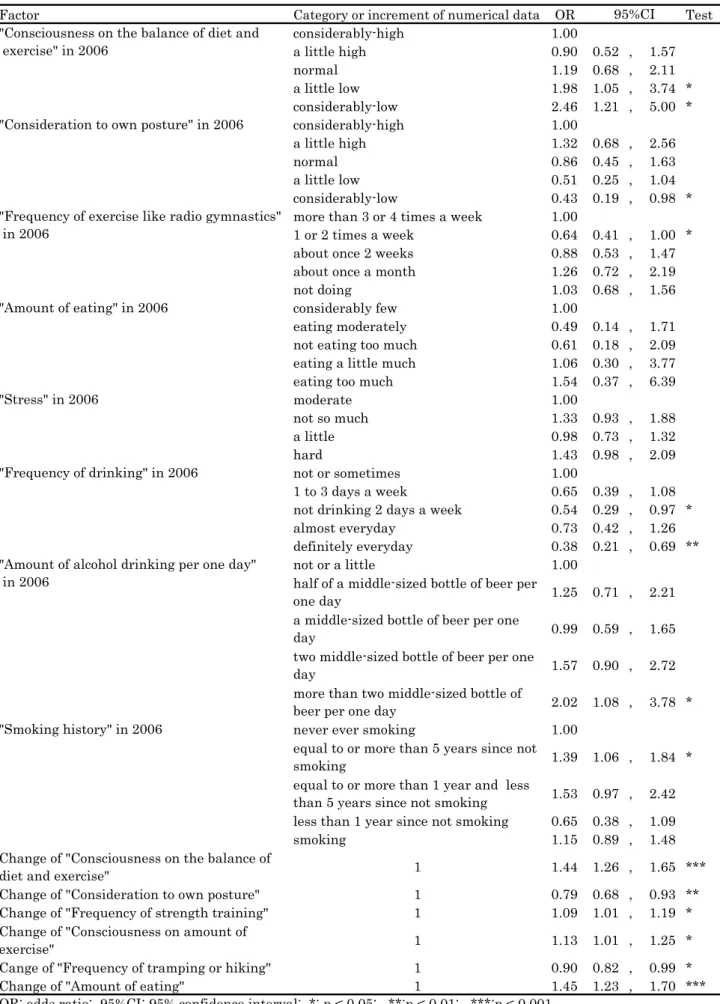
4
.
リスクの“改善なし”
,
“悪化”と
2006
年の生活習
慣及び生活習慣変化の関連性
Table 6
に,男性の肥満リスクの“改善なし”に関連
する要因の解析結果を示す.肥満リスクの“改善なし”
には,男性の場合は,
“食事と運動のバランスに関する意
識の変化”
,
“食事の量の変化”
,
“運動量に関する意識の
変化”
,
2006
年の
“食事と運動のバランスに関する意識”
,
“食事の量”
,
“
1
日の飲酒量”が関連していた.女性の
場合は“改善した者”が少なかったためか,ロジスティ
ック回帰分析で最終解が求まらなかった.
肥満リスクの“悪化”には,男性の場合は,
“食事の量
の変化”
,
“運動施設を利用する頻度の変化”
,
“年齢階級”
,
2006
年の“よく噛まないで食べる習慣”及び“自由時間
の過ごし方”が,それぞれ関連していた.女性の場合は
最終解が求まらなかった.
血糖リスクの“改善なし”には,男性の場合は,
“年齢
階級”
,
2006
年の“主観的健康観”
,
“主観的健康観の変
化”
,
“夜間の飲食の変化”が関連していた.女性の場合
は,
“年齢階級”と“食事の量の変化”が関連していた.
血糖リスクの“悪化”には,男性の場合は,
“年齢階級”
,
“筋力トレーニングを行う頻度の変化”
,
2006
年の“夜
間の飲食”
,
“大豆製品を食べる頻度の変化”が関連して
いた.女性の場合は,
“年齢階級”
,
2006
年の“食事と運
動のバランスに関する意識”
,
“主観的健康観の変化”が
関連していた.
脂質リスクの“改善なし”には,男性の場合は,
2006
年の“主観的健康観”
,
“運動量に関する意識の変化”
,
“自
由時間の過ごし方の変化”
,
2006
年の“
1
日の飲酒量”
,
2006
年の“健康維持行動の実践”が関連していた.女性
の場合は,
2006
年の“ストレス”
,
2006
年の“主食・主
菜・副菜の食べ方”
,
“筋力トレーニングを行う頻度の変
化”が関連していた.
脂質リスクの“悪化”には,男性の場合は,
2006
年の
“主観的健康観”
,
“喫煙歴”
,
“運動量に関する意識の変
化”
,
2006
年の“食事と運動のバランスに関する意識”
,
“年齢階級”
,
“脂っこい料理の摂食頻度の変化”が関連
していた.女性の場合は“年齢階級”
,
2006
年の“塩辛
い物の摂食頻度”
,
“運動施設を利用する頻度”が関連し
ていた.
血圧リスクの“改善なし”には,男性の場合は,
“年齢
階級”
,
2006
年の“主観的健康観”
,
“食事の量の変化”
,
2006
年の“
1
日の飲酒量”
,
“
1
日の飲酒量の変化”
,
“主
観的健康観の変化”が関連していた.女性の場合は,
“年
齢階級”
,
“筋力トレーニングを行う頻度の変化”
,
2006
年の“主観的健康観”が関連していた.
血圧リスクの
“悪化”
には,
男性の場合は,
“年齢階級”
,
2006
年の“乳製品の摂取頻度”
,
“乳製品の摂取頻度の変
兵庫県立健康生活科学研究所健康科学研究センター研究報告 第1号2010
Table 6 Multivariate adjusted odds ratios for the obesity risk not-improved in 2007 (Male)
Factor Category or increment of numerical data OR Test considerably-high 1.00
a little high 0.90 0.52 , 1.57 normal 1.19 0.68 , 2.11 a little low 1.98 1.05 , 3.74 * considerably-low 2.46 1.21 , 5.00 * considerably-high 1.00
a little high 1.32 0.68 , 2.56 normal 0.86 0.45 , 1.63 a little low 0.51 0.25 , 1.04 considerably-low 0.43 0.19 , 0.98 * more than 3 or 4 times a week 1.00
1 or 2 times a week 0.64 0.41 , 1.00 * about once 2 weeks 0.88 0.53 , 1.47 about once a month 1.26 0.72 , 2.19 not doing 1.03 0.68 , 1.56 considerably few 1.00
eating moderately 0.49 0.14 , 1.71 not eating too much 0.61 0.18 , 2.09 eating a little much 1.06 0.30 , 3.77 eating too much 1.54 0.37 , 6.39 moderate 1.00
not so much 1.33 0.93 , 1.88 a little 0.98 0.73 , 1.32 hard 1.43 0.98 , 2.09 not or sometimes 1.00
1 to 3 days a week 0.65 0.39 , 1.08 not drinking 2 days a week 0.54 0.29 , 0.97 * almost everyday 0.73 0.42 , 1.26 definitely everyday 0.38 0.21 , 0.69 ** not or a little 1.00
half of a middle-sized bottle of beer per
one day 1.25 0.71 , 2.21 a middle-sized bottle of beer per one
day 0.99 0.59 , 1.65 two middle-sized bottle of beer per one
day 1.57 0.90 , 2.72 more than two middle-sized bottle of
beer per one day 2.02 1.08 , 3.78 * never ever smoking 1.00
equal to or more than 5 years since not
smoking 1.39 1.06 , 1.84 * equal to or more than 1 year and less
than 5 years since not smoking 1.53 0.97 , 2.42 less than 1 year since not smoking 0.65 0.38 , 1.09 smoking 1.15 0.89 , 1.48 Change of "Consciousness on the balance of
diet and exercise" 1 1.44 1.26 , 1.65 *** Change of "Consideration to own posture" 1 0.79 0.68 , 0.93 ** Change of "Frequency of strength training" 1 1.09 1.01 , 1.19 * Change of "Consciousness on amount of
exercise" 1 1.13 1.01 , 1.25 * Cange of "Frequency of tramping or hiking" 1 0.90 0.82 , 0.99 * Change of "Amount of eating" 1 1.45 1.23 , 1.70 *** "Smoking history" in 2006
"Consciousness on the balance of diet and exercise" in 2006
"Frequency of exercise like radio gymnastics" in 2006
"Amount of eating" in 2006
"Consideration to own posture" in 2006
OR: odds ratio; 95%CI: 95% confidence interval; *: p < 0.05; **:p < 0.01; ***:p < 0.001
95%CI
"Stress" in 2006
"Frequency of drinking" in 2006