© OECD 2010
Intergenerational Social Mobility
in OECD Countries*
by
Orsetta Causa and Åsa Johansson
* Causa (e-mail: [email protected]) and Johansson (e-mail: [email protected]), OECD Economics Department. The authors would like to thank Anna d’Addio, Sveinbjörn Blöndal, Jørgen Elmeskov, Bo Hansson, Stephen Machin, Marc Pearson, Giuseppe Nicoletti, Jean-Luc Schneider and Rolph van der Hoeven for their valuable comments and Chatherine Chapuis for excellent statistical work, as well as Irene Sinha for excellent editorial support. The views expressed in this paper are those of the authors and do not necessarily reflect those of the OECD or its member countries.
This paper assesses recent patterns of intergenerational social mobility across OECD countries and examines the role that public policies can play. It shows that the relationship between parental or socio-economic background and offspring educational and wage outcomes is positive and significant in practically all countries for which evidence is available. Intergenerational social mobility is measured by several different indicators, since no single indicator provides a complete picture. However, one pattern that emerges is of a group of countries, southern European countries and Luxembourg, which appears to rank as relatively immobile on most indicators, while another group, the Nordic countries, is found to be more mobile. Furthermore, public policies such as education and early childcare play a role in explaining observed differences in intergenerational social mobility across countries.
JEL classification: J60, J62, I20, H23, C20, C21
Keywords: intergenerational wage mobility, intergenerational education mobility, education, public policies
T
his paper assesses recent patterns in intergenerational social mobility across OECD countries, examining the role that policies can play in affecting such mobility. Intergenerational social mobility refers to the relationship between the socio-economic status of parents and the status their children will attain as adults. A society can be more or less mobile depending on whether this relationship is, on average, looser or tighter: in a relatively immobile society an individual’s wage, education or occupation will tend to be strongly related to those of his/her parents. Intergenerational mobility reflects a host of factors, including inherited traits, social norms and public policies that may influence the individual’s willingness and ability to seize economic opportunities. These factors are difficult to unbundle precisely and, as regards norms and policies, to some extent reflect societal choices over institutional settings as well as differences in choices over redistribution and equity, which are likely to be valued differently across countries. Therefore, no “benchmark” mobility level can be identified in cross-country comparisons.Nonetheless, removing policy-related obstacles to social mobility can be advocated on equity and efficiency grounds because it can improve equality of economic opportunities and the way a society allocates human resources. Promoting intergenerational social mobility means providing individuals with the same opportunities ex ante, even though it does not imply that all individuals should achieve the same outcomes ex post. Furthermore, policies that affect social mobility are closely related to growth. The ability of an economy to allocate human resources to their best use can have important effects on economic performance. However, trade-offs can exist between policies that remove obstacles to social mobility and those that strengthen other drivers of growth. Therefore, understanding the role played by public policies vis-à-vis social mobility can help design policies that enhance equality of opportunity without adversely effecting economic growth. This could even enhance growth and equality of economic opportunities across generations.
The socio-economic status of parents can influence that of their children in two main ways: directly by affecting their labour productivity and labour market attachment and indirectly by facilitating their success on the labour market by other means (e.g. by the transmission of social norms such as work ethic or social networks). In turn, labour productivity of children is, to a large extent, determined by parents’ investment in their human capital and children’s ability to seize educational opportunities. One empirical challenge is to separate the direct productivity channel from indirect ones. Arguably, both can be influenced by public policies, e.g. education, redistributive and labour, or product market policies.
Intergenerational transmission of social status is usually measured as “wage or income persistence”, i.e. the fraction of parental income or wages reflected in their offspring’s income or wages. Measuring and comparing wage or income persistence across countries is made difficult by the lack of comparable cross-country data, especially of parents. Against this background, and given that education is a key transmission mechanism in intergenerational social mobility and matching skills with societal needs, this paper focuses
primarily on the role of education as a driver of mobility across generations. Its main contribution is to provide comparable estimates of intergenerational wage and educational mobility across OECD countries, focusing on the following concepts of mobility:
● The influence of parental background, as measured by educational achievement of parents, on wages and educational attainment of various cohorts of adults for 14 European OECD countries.
● The influence of parental background, as measured by a composite index of their socio- economic status, on cognitive achievements of 15-year-old students in 30 OECD countries.
The analysis draws on existing and new evidence from two main sources of individual- level information: wage and education mobility, using the 2005 Survey of Income and Living Conditions (SILC) poverty module of Eurostat survey data; and the influence of parental background on a teenager’s cognitive achievement, using the 2006 OECD Programme for International Student Assessment (PISA) survey data. Though none of these concepts of mobility refers to intergenerational transmission of wages proper, the estimated persistence/mobility measures will be called “wage persistence/mobility” and
“education persistence/mobility”, respectively.
The paper is organised as follows. Section 1 outlines main findings. Section 2 describes the linkages between family background and wage and education outcomes of individuals, explaining the role of education in determining wage mobility. Section 3 analyses the extent of intergenerational wage and educational mobility across those OECD countries for which data are available. Finally, in light of these mobility patterns, Section 4 uses the same data sources to investigate the cross-country association between a range of public policies (including education, redistributive and labour, and product market) and social mobility and equality of opportunity across generations. Suggestive evidence is provided that the main channel through which policies may influence social mobility is via the link between cross-sectional inequality and intergenerational wage mobility.
1. Main findings
1.1. Mobility patterns
In this study intergenerational social mobility is measured by several different indicators (e.g. wage persistence, secondary and post-secondary education persistence). However, given the complex nature of social mobility, these indicators do not necessarily provide the same cross-country ranking, suggesting that no single indicator provides a complete picture.
● The influence of parental background on individual earnings varies widely across OECD countries for which estimates are available. Low mobility across generations, as measured by a close link between parents’ and children’s earnings, is particularly pronounced in the United Kingdom, Italy, the United States and France, while mobility is higher in the Nordic countries, Australia and Canada.
● Across European OECD countries covered by the analysis, there is a substantial wage premium associated with growing up in a higher-educated family and a penalty with growing up in a less-educated family, even after controlling for a number of individual characteristics. The premium and penalty are particularly large in southern European countries, the United Kingdom, Luxembourg and Ireland (a premium of 20% and penalty of
16% or more). In general, wage persistence across generations, measured as the difference between the wage premium and penalty, is slightly stronger for sons than for daughters.
● The influence of parental socio-economic status on student achievement in secondary education also differs across OECD countries. It is particularly strong in the United States, France and Belgium, while weaker in some Nordic countries, Korea and Canada. In over half of the OECD countries, including all the large continental European ones, student cognitive skills are more strongly influenced by the average socio-economic status of parents of other students in the same school, i.e. the schools’ average socio- economic environment, than by their own parents’ socio-economic status.
● Inequalities in secondary cognitive skills are likely to translate into inequalities in post- secondary educational achievement and subsequent wage inequality in the labour market. Indeed, in European OECD countries, students from a higher-educated family are more likely to achieve tertiary education, while there is a probability penalty associated with growing up in a less-educated family. The increase in the probability of achieving tertiary education is particularly strong in Luxembourg, Italy, Finland and Denmark, where it is 30 percentage points higher for a son whose father had tertiary education than for a son whose father had only upper-secondary education. Furthermore, transmitted inequalities in education are positively associated across countries with inequalities in wages.
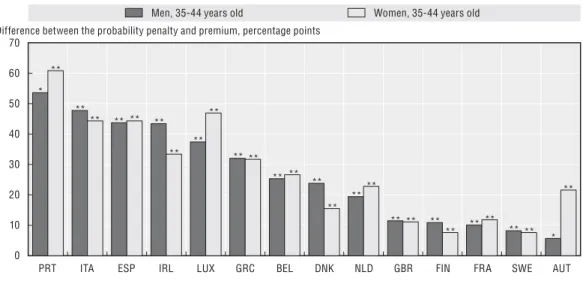
● In all European OECD countries covered by the analysis, the probability of achieving below secondary education is on average 18 percentage points higher for children whose father had below upper-secondary education compared with those whose father had upper- secondary education. Conversely, the probability of achieving below upper-secondary education decreases on average by 10 percentage points for offspring of tertiary educated fathers compared with children whose father had upper-secondary education.
1.2. Intergenerational mobility and inequality
● Intergenerational social persistence, as measured by a close link between parental education achievement and children’s wages, is correlated across countries with cross- sectional inequality and poverty. The association between parental socio-economic status and teenager cognitive achievement is stronger in countries with a greater share of children living under the poverty line or lacking basic material resources.
1.3. Policies and mobility
● Higher enrolment in child care and early childhood education correlates with a lower influence of parental socio-economic background on teenager cognitive skills, suggesting a positive effect on social mobility. These policies are likely to be most efficient when targeted at children from low-income and/or second-language families.
● Practices that group students into different programmes or curricula according to proficiency level, for instance, early tracking and ability grouping within classes, correlate with a stronger influence of parental socio-economic background on teenager cognitive skills. This reflects a stronger influence of the school socio-economic environment on a student’s performance in the case of early tracking practices.
● By contrast, a better matching of school resources with needs, as well as a steeper progression in teachers’ wages over their career, are associated with a lower influence of parental background on student achievement, possibly by attracting experienced
teachers to disadvantaged areas. Likewise, a larger share of qualified teachers correlates with lower inequalities transmitted by family background.
● Evidence suggests that increasing the social mix within schools increases performance of disadvantaged students with neutral or in some cases positive effects on overall performance. Thus, policies aimed at encouraging such a mix in neighbourhoods may mitigate inequalities.
● There is suggestive evidence that universal government-supported loan systems for tertiary education are associated with higher social mobility, as measured by the probability of the offspring of disadvantaged families completing tertiary education. In countries lacking such systems, financial constraints could be an obstacle to achieving tertiary education for students from disadvantaged backgrounds.
● More progressive income taxation and higher short-term unemployment benefits are associated with a looser link between parental background and teenager cognitive skills and wages. This may indicate that well-targeted redistributive and income support policies lower cross-sectional income inequality and poverty rates.
2. Determinants of intergenerational social mobility
2.1. The linkages between parental background and offspring outcomes
Intergenerational social mobility can be measured by income, education, occupation or social class. Economic research has traditionally focused on some measure of income or wages.1 Studies assessing the association between parent and offspring income focus on pairs of fathers and sons. Ideally, income should be measured by a household’s disposable income, as this most directly influences the standard of living of individuals (e.g. Chadwick and Solon, 2002; Solon, 2004; Lee and Solon, 2006). In practice, accurate measurement is difficult, as it should take into account the structure of the household, the extent of female participation in the labour market and the different sources of income (e.g. earnings, assets, welfare). Therefore, most studies use some measure of wages (Box 1). The extent to which the offspring’s wage levels reflect those of the parents (the so-called “intergenerational wage elasticity”) is taken as a measure of wage persistence across generations, or lack of intergenerational wage mobility. The higher this elasticity, the lower is intergenerational wage mobility. However, one difficulty in adopting this approach in a cross-country context is that comparable information on wages of parents is seldom available.
Parental background can influence offspring wages (Figure 1) in very general terms, by boosting both offspring labour productivity and successful insertion in the labour market. One way children’s productivity, and hence future income, can be enhanced is through the ability of parents to invest in their offspring’s human capital. However, wealth and assets passed on from one generation to another, the inheritance of traits that are important for economic success, such as propensities to undertake education, work ethics and risk- related behaviours, as well as local conditions such as growing up in advantaged neighbourhoods, are other important factors (for an overview see d’Addio, 2007).
One empirical challenge is to separate the direct productivity channel from indirect labour market ones. Another more fundamental challenge is to empirically isolate the effect of parental background (“nurture”) from that of genetic inheritance of abilities (“nature”) on individuals’ wages and educational achievement. In general, as in this study, estimates of the impact of parental background on individuals’ wages and educational achievement combine these two effects. The relative importance of nature versus nurture
in explaining intergenerational social mobility is far from established (e.g. Sacerdote, 2002; Bowles et al., 2002; Plug and Vijverberg, 2005). However, to the extent that genetic inheritability of ability does not vary systematically across countries, such heritability should not influence cross-country variation in wage or educational mobility.
An important part of wage persistence across generations is driven by the effect of parental background on cognitive skills acquired by their children in formal (and informal) education (which influences the offspring’s productivity). This includes secondary education and post-secondary education (Figure 1 and Box 2). Indeed, recent studies show that there is a clear connection between intergenerational wage mobility and intergenerational educational mobility, although educational mobility cannot account for all the estimated persistence in incomes (Blanden, 2008a; Blanden et al., 2005; Solon, 2004). Educational differences tend to persist across generations, and differences in such persistence explain a large share of the cross-country variation of intergenerational wage correlations (e.g. Solon, 2004; Blanden et al., 2006; Blanden et al., 2005; d’Addio, 2007). The extent to which education is responsible for intergenerational persistence in wages depends on how strongly
Box 1. Concepts in intergenerational social mobility
Measures of intergenerational income mobility are often based on empirical estimation of the intergenerational income elasticity, , which measures the extent to which offspring income levels, Yi, reflect those of their parents, YiP, that is:
.
This estimated elasticity is a measure of average intergenerational income persistence. A low value implies that the link between parent and offspring incomes is relatively weak, while a high value implies a relatively strong link. An alternative measure is the partial correlation between parent and offspring incomes, which adjusts for potential differences in the variance of income between the two generations.
Theoretical studies of intergenerational mobility regard long-run permanent disposable income as the most appropriate income concept (e.g. Goldberger, 1989; Chadwick and Solon, 2002; Solon, 2004; Lee and Solon, 2006; Haider and Solon, 2006). But basing estimates of persistence across generations on current wages raises some key issues (Solon, 2002). First, measuring permanent income/wages of parents with error leads to inconsistent estimates, causing an underestimation of the true intergenerational elasticity. Second, using current wages of offspring as a proxy for lifetime income can also cause a bias, in particular when looking at individuals at the beginning of their careers (Haider and Solon, 2006). Studies based on such measures of offspring wages tend to find lower elasticity estimates than studies measuring wages further along their careers or life cycles. To overcome these problems, many studies average both parental and offspring wages over several years or measure offspring wages after a few years’ experience in the labour market.
Educational persistence is often measured by the correlation between years of schooling or educational achievement of parents and their offspring. However, basing educational persistence on years of schooling assumes that the impact on human capital of an additional year of schooling is the same across generations, and that years of schooling affect human capital in the same way across countries. These problems are overcome by studies that assess educational mobility in terms of qualification or literacy levels achieved, as measured, for instance, by the harmonised cross-country ISCED classification (e.g. Chevalier et al., 2007) or by test scores of cognitive skills (OECD, 2007a; Hertz et al., 2007).
i P i
i Y
Y
ln
lneducational achievement is tied to family background, that is, the degree of persistence in education. Of course, the intergenerational wage link is also affected by the returns to education in the labour market (e.g. Solon, 2004; d’Addio, 2007).2 It is likely that inequalities in cognitive skills acquired in secondary education translate into inequalities in achieving post- secondary education and into wages via the returns to education in the labour market. Figure 1. Some links between parental background and their offspring’s outcomes
Social mobility – The explored links
Inequality Inequality
Inequality
Labour and product market policies/institutions
Redistribution/transfer policies
Policies and factors interacting with parental background
Education policies Hypothesis
Parental background
Parents’ socio-economic status Parents’
education
Education mobility Income mobility
Offspring's outcomes
Hypothesis Cognitive skills (secondary education) Wages
Post-secondary education attainment Returns
to education
Persistence in wages across generations also appears to be positively associated across countries with measures of inequality, i.e. of the dispersion of parental backgrounds (see below and d’Addio, 2007, for an overview). Although causality between intra- and intergenerational persistence of inequality is far from established, it is possible that redistributive policies and institutions that narrow the gap between current incomes and/ or wages of parents could also mitigate the influence of parental background on wages and educational outcomes of their offspring.
The empirical approach developed in the remainder of this paper has been partly shaped by the considerations above. The analysis of wage mobility measures parental background by fathers’ education and their offspring’s incomes as gross hourly wages.3 Basing the estimation of persistence on gross hourly wages implies that the persistence measure reflect the impact of parental education on productivity. While, basing persistence estimates on monthly or annual wages would, in addition to the productivity effect, capture the labour supply decision, i.e. the decisions on working hours.
The study of wage mobility is supplemented by the analysis of educational mobility for teenagers (with parental background measured by a broad index of the family’s socio- economic status and educational outcomes measured by PISA test scores) and adults (with parental background measured by father’s education and offspring educational outcome measured by educational attainment). Finally, the analysis of policy influences on wage and educational mobility focuses on both education and other policies that are likely to affect cross-sectional inequality.
Box 2. Education as a determinant of intergenerational social mobility Several recent studies analyse the link between intergenerational persistence in education and income (e.g. Solon, 2004). In these studies the offspring’s investment in education, which drives intergenerational income mobility, depends on family income.
Educational attainment varies with parental income due to both differing endowments (propensity to undertake education and possession of a work ethic) and differing private investment in education across families. If all families had full access to perfect capital markets, only inheritable traits would influence mobility (Becker and Tomes, 1979). But if parents cannot borrow against their children’s future earnings to finance their education, liquidity-constrained parents will invest sub-optimally in their children’s education (Becker and Tomes, 1986; Grawe and Mulligan, 2002). Additionally, parental investment in education increases in the return to human capital investment, since parents are more inclined to invest in their children’s education when the payoff is higher. Thus, in the presence of financial constraints, wealthier families tend to invest more in their children’s human capital, and such investment is increasing in labour market returns (Solon, 2004).
Some of these studies suggest that government spending on education can increase intergenerational mobility (Solon, 2004; Mayer and Lopoo, 2008). Progressive public investment in education can offset sub-optimal parental investment in education, to the extent that the offspring of liquidity-constrained parents benefit relatively more from these public programmes. A recent study for the United States shows that intergenerational mobility is greater in high-spending states compared with low-spending states (Mayer and Lopoo, 2008).
3. Intergenerational social mobility patterns
3.1. Cross-country patterns in intergenerational income mobility
3.1.1. Intergenerational income persistence is significant in all OECD countries
The relationship between socio-economic status of parents and their offspring is positive and significant in practically all countries for which evidence is available, and for many different aspects of social status (e.g. Hertz et al., 2007; Corak, 2004). International comparisons of intergenerational income persistence are relatively common (e.g. Solon, 2002; Corak, 2006; d’Addio, 2007). However, these comparisons can be invalid because different studies use different variable definitions, samples, estimation methods and time periods.
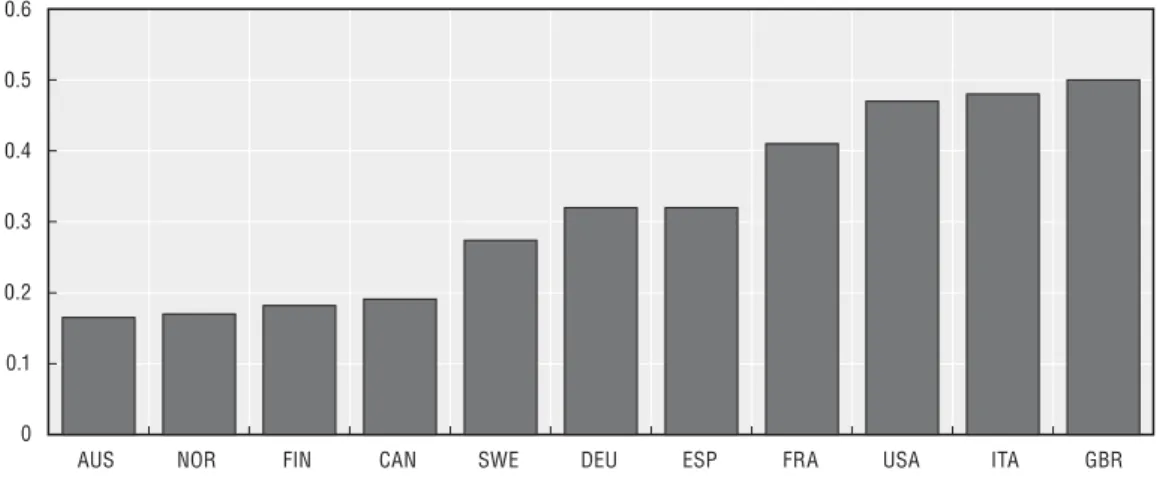
Taking the available estimates at face value, cross-country comparison of intergenerational income elasticities based on (various measures of) earnings for pairs of fathers and sons suggests that persistence is higher in the United Kingdom, Italy, the United States and France among the OECD countries for which comparable estimates are available (e.g. Corak, 2006; Blanden, 2008b).4 In these countries at least, 40% of the economic advantage high-earning parents have over low-earning parents is passed on to the next generation (Figure 2). By contrast, intergenerational persistence is comparatively low in the Nordic countries, Australia and Canada, with less than 20% of the earnings advantage passed from parent to offspring.
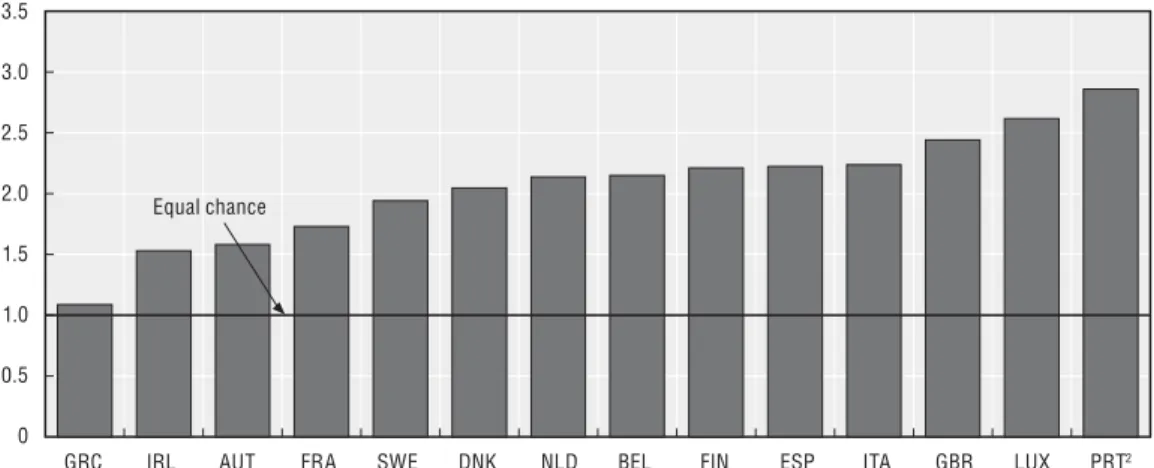
These patterns of intergenerational persistence are partly confirmed by descriptive evidence based on new comparable data for European OECD countries, which allow systematic comparison of sons’ wages to the educational attainment of fathers (see Causa et al., 2009, and Box 3). In all the countries covered, a son is much more likely to be in the top wage quartile if his father had achieved tertiary education compared with a son whose father had only basic (below upper-secondary) education, particularly in Portugal, Luxembourg and the United Kingdom (Figure 3).5
Figure 2. Intergenerational earnings elasticity,1 estimates from various studies: selected OECD countries
1. The height of each bar measures the extent to which son’s earnings levels reflect those of their fathers. The estimates are the best point estimate of the intergenerational earnings elasticity resulting from an extensive meta-analysis carried out by Corak (2006) and supplemented with additional countries from d’Addio (2007). The choice of empirical estimates in this meta-analysis is motivated by the fact that they are based on studies that are similar in their estimation technique, sample and variable definitions. The higher the value, the greater is the persistence of earnings across generations, thus the lower is the intergenerational earnings mobility.
Source: D’Addio (2007). 0.6
0.5
0.4
0.3
0.2
0.1
0
ITA
AUS NOR FIN CAN SWE DEU ESP FRA USA GBR
Figure 3. Ratio of the chance of being in the top wage quartile for sons of higher-educated vs. lower-educated fathers:1 Selected European
OECD countries
Note: Germany is not included in this figure as there is a problem with the representativeness of the German sample along the education dimension.
1. This figure shows the ratio of two conditional probabilities. It measures the ratio between the probability to end up in the top wage quartile given that the son’s father had achieved tertiary education and the probability to end up in the top wage quartile given that the son’s father had achieved less than upper-secondary education. Probabilities are defined as simple frequency measures. Fathers’ educational achievement is a proxy for parental background or wages.
2. 25-34 years old for Portugal.
Source: OECD calculations based on the 2005 EU-SILC Database.
Box 3. Measuring the link between parental educational background and offspring wages
The analysis in Causa et al. (2009) is based on the 2005 module on the intergenerational transmission of poverty of the EU-SILC Household Database. This poverty module contains retrospective information on parental background when the respondent was a teenager. This information is comparable across European OECD countries and includes family composition, age, educational qualification level, activity status and occupation of mother and father, as well as an indicator of financial distress conditions. However, information on parents’ wages is lacking.
The approach taken in this study is to proxy parental background by the highest educational qualification level achieved by the father according to the International Standard Classification of Education (ISCED). One advantage of using father’s education as a proxy for his income is that education is likely to be a more permanent feature than current wages, while being highly correlated with wages in most countries. The offspring’s income concept refers to gross hourly wages and salaries paid in cash for time worked or for time not worked, such as holidays, as well as additional payments (e.g. overtime payments, bonuses). Henceforth, this will be referred to as wages. The results focus on two cohorts of offspring (35-44 and 45-54) and their parents. The youngest cohort (25-34 years old) is excluded because of the potential difficulties associated with measuring permanent wages/incomes at young ages, as discussed in Box 1, as well as with ensuring that the individuals under consideration have reached their desired educational level.
3.5
2.5
2.0 3.0
1.5
1.0
0.5
0
GBR
GRC IRL AUT FRA SWE DNK NLD BEL FIN ESP ITA LUX PRT2
Equal chance
Men, 35-44 years old
To explore more fully this descriptive evidence through regression analysis, it was assumed that individual wage prospects depend on fathers’ educational attainment in two ways: through the direct transmission of factors that affect the economic success of offspring; and through influencing their offspring’s educational attainment (see Causa et al., 2009, and Box 4). The first channel, that is, estimates of parameter a in equation [1], Box 4, captures the transmission of wealth, work ethic and social norms or networks that
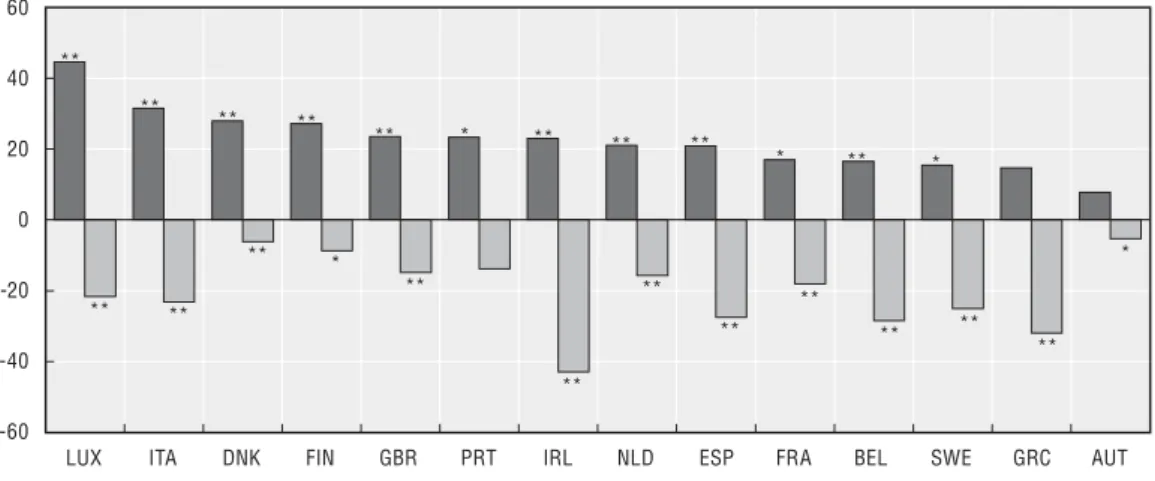
Figure 4. Wage premium and penalty due to paternal education levels:1 Selected European OECD countries
Notes: * denotes statistically significant at 10% at least.
** denotes statistically significant at 5% at least.
Germany is not included in this figure, as there is a problem with the representativeness of the German sample along the education dimension.
1. The figure shows the estimated percentage change in wages of the offspring depending on their parental background measured by father’s highest education level. The wage premium is the increase in the offspring’s wage of having a father with tertiary education relative to an offspring whose father had upper-secondary education. The wage penalty is the decrease in the offspring’s wage of having a father with less than upper- secondary education relative to an offspring whose father had upper-secondary education. Fathers’ educational achievement is a proxy for parental background or wage.
2. Based on OLS wage regression model.
3. Based on wage regression model with selection into paid employment (Heckman full maximum likelihood estimation).
Source: OECD calculations based on the 2005 EU-SILC Database. 80
60 40 20 0 -20 -40 -60 -80
PRT GBR ITA ESP FIN SWE NLD BEL LUX FRA DNK AUT GRC IRL
80 60 40 20 0 -20 -40 -60 -80
ITA ESP FIN GBR LUX NLD BEL PRT AUT GRC FRA IRL SWE DNK
**
**
** **
*
*
**
** ** ** ** **
**
* *
**
** *
** **
** **
**
**
*
**
**
**
**
** **
Percentage change in wage A. Men, 35-44 years old2
Percentage change in wage B. Women, 35-44 years old3
Wage premium Wage penalty
Box 4. The influence of parental background on offspring wages
The empirical strategy for assessing the influence of parental background on offspring wages assumes that gross hourly wages (Wi) depend on both the offspring’s effort or educational attainment (ECi) and the influence of father’s educational attainment (Ei) (for details, see Causa et al., 2009):
, [1]
where a measures the strength of the direct influence of the father’s educational attainment on wages (e.g. through the transmission of social norms, work ethic, social networks and other factors facilitating the economic success of children) and b the offspring’s labour market returns to their educational attainment. In turn, the offspring’s educational attainment is assumed to depend on their fathers’ educational attainment, reflecting, for instance, the ability and willingness of fathers to invest in their offspring’s human capital as well as other inheritable factors affecting the ability of their children to seize educational opportunities, such that:
. [2]
Combining these two equations yields,
, [3]
where f = (a + bd) captures the total effect of a father’s educational attainment on individual wages. This effect is decomposed in a direct effect on wages (a) and an indirect effect through education (bd), which in turn consists of the returns to offspring’s own education (b) and the influence of father’s educational attainment on their offspring’s educational attainment (d).
In the first stage, the total effect of a fathers educational attainment on individual wages, equation [3], is estimated for various cohorts of men and women. The estimation controls for “Mincerian” individual characteristics such as living in an urban/rural area and migrant and marital/cohabitant status. The results are robust to inclusion of age and experience.1 Ordinary least squares (OLS) estimates of equations [1] and [3] may be biased due to non-random selection into employment, since it is likely that those who are not working constitute a self-selected sample, particularly women who would earn low wages. To overcome this selection problem, this study uses the Heckman sample selection bias estimator for women and OLS for men (e.g. Heckman, 1976). However, results for women remain broadly the same under OLS or Heckman estimation techniques.
In the second stage, estimation of equation [1], offspring educational attainment is introduced as an explanatory variable in order to find out whether fathers’ educational attainment mainly influences their offspring’s wages through influence on education or if it has a direct effect on wages, over and above the effect on education.2
In the third stage, the influence of fathers’ educational attainment on that of their offspring is explicitly estimated (equation [2]). The empirical results are obtained by estimating an Ordered Probit model, in which observed educational outcomes of individuals (ECi) are assumed to be driven by an underlying continuous variable measuring their “propensity to achieve education”. This underlying variable is assumed to be determined by their father’s educational attainment (Ei) and a number of individual characteristics. The results suggest that in all European OECD countries fathers’ educational attainment influences that of their offspring (Causa et al., 2009).
1. In “Mincerian” wage equations, age, experience and experience squared are standard controls. Life-cycle effects are not considered in the final estimates because they are not statistically significant in the current setting, due to weak identification within narrowly defined age groups (or cohorts).
2. It is possible that there is a potential endogeneity of own education in this specification due to unobserved variables such as ability and/or motivation, which may be correlated with both education and wages. This would result in an upward bias of the influence of own education on wages. Usually, instrumental variable (IV) estimation is used to address this problem, but it is often difficult to find appropriate instruments, and weak instruments may bias the results further. Indeed, studies using (IV) estimations often find even higher estimates of the influence of education on wages than OLS, which suggests that measurement error in the education variable might be a more serious problem than endogeneity (e.g. Card, 2001).
ln 1
i i i
i k a E b EC
W
i i
i j d E
EC
2ln 3
i i
i e f E
W
facilitate successful labour market insertion. The second channel, i.e. estimates of parameter b in equation [1], Box 4, captures access to education, as well as the individual propensity to acquire education and genetically transmitted ability to learn, which affect an individual’s productivity (e.g. Bourguignon et al., 2003). As a first step in the analysis, Figure 4 reports estimates of the overall effect of a father’s educational attainment on offspring wages (estimates of parameter f in equation [3], Box 4), with no distinction between these channels.
3.1.2. Wage premium or penalty depending on father’s educational attainment
In all European OECD countries covered by the analysis, there is a positive wage premium (measured as the increase in gross hourly wages) for offspring of higher-educated fathers, while there is a penalty (measured as the decrease in gross hourly wages) for offspring of lower-educated fathers (Figure 4). The wage premium is particularly large in southern European OECD countries, the United Kingdom and Finland. In these countries, having a father with tertiary education raises sons’ wages by some 20% or more compared with a son whose father had upper-secondary education. At the same time, the wage penalty of having a father with only basic education compared with a father with upper- secondary education appears to be high in the same countries, as well as in Luxembourg and Ireland. In these countries, the wage of a son whose father had below upper-secondary education falls short by more than 16% of the wage of a son whose father had upper- secondary education.6 The influence of paternal background on daughters’ wage premia is, in general, slightly lower than that of sons, yet still substantial. Moreover, for women, the average wage penalty of coming from a disadvantaged background is sometimes much higher than the premium of coming from an advantaged background.7
3.1.3. Summary measure of persistence in wages
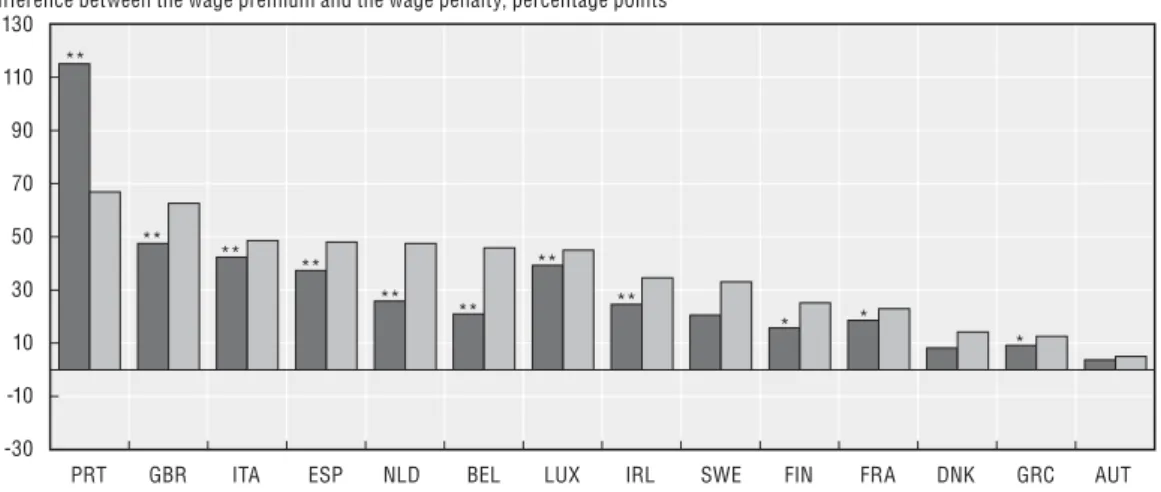
One way of summarising the extent of wage persistence across generations is to measure the gap between the estimated wage premium and the penalty of having a tertiary-educated or below upper-secondary educated father, respectively. A greater gap would imply stronger persistence in wages over generations. According to this measure, intergenerational wage persistence for sons is particularly strong in some southern European countries and in the United Kingdom, while it is lower in some Nordic countries, Austria and Greece (Figure 5). The cross-country ranking of persistence in wages for women is similar to that of men. However, these patterns could be influenced by distributional differences in fathers’ educational attainment and individuals’ wages, since wider distributions of individual wages (relative to parental background) could mechanically translate into higher persistence estimates. One way of accounting for this is to adjust the estimated wage persistence for cross-country differences in the dispersion of father’s education and offspring’s wages. The cross-country ranking presented in Figure 5 remains fairly unchanged to this adjustment (the rank correlation between non- standardised and standardised persistence measures is 0.96). The remainder of the discussion in this study refers to the standardised measure of wage persistence.
It is difficult to compare this measure of persistence in wages over generations with existing estimates of the “intergenerational elasticity of income” reported in Figure 1 because the proxy used for parental background in this study is different from what is commonly used (some measure of fathers’ wage or income). Even so, the findings in this study are qualitatively in line with existing evidence for pairs of fathers and sons.8 The
Figure 5. Summary measure of wage persistence levels:1 Selected European OECD countries
Notes: * denotes statistically significant at 10% at least.
** denotes statistically significant at 5% at least.
Germany is not included in this figure, as there is a problem with the representativeness of the German sample along the education dimension.
1. Wage persistence is measured as the distance or gap between the estimated wage premium and penalty. Thus, it measures the percentage increase in wages of an offspring having a father with tertiary education relative to an offspring having a father with below-upper secondary education. A larger number implies a larger gap, thus stronger persistence in wages or a higher degree of immobility over generations. Fathers’ educational achievement is a proxy for parental background or wage.
2. Based on OLS wage regression model.
3. The summary measure of wage persistence, corrected for distributional differences, corresponds to the summary measure of wage persistence, multiplied by the ratio of the standard deviation of fathers’ education to the standard deviation of sons’ or daughters’ gross hourly wage.
4. Based on wage regression model with selection into paid employment (Heckman full maximum likelihood estimation).
Source: OECD calculations based on the 2005 EU-SILC Database. 130
70 90 110
50 30 10 -10
70 90 110
50 30 10 -10 -30
PRT GBR ITA ESP NLD BEL LUX IRL SWE FIN FRA DNK GRC AUT
130
-30
ITA
ESP PRT LUX GRC IRL BEL NLD GBR AUT SWE FIN FRA DNK
**
** **
**
** **
**
**
* *
*
**
*
** **
** **
* * * * **
* Difference between the wage premium and the wage penalty, percentage points
A. Men, 35-44 years old2
Difference between the wage premium and the wage penalty, percentage points B. Women, 35-44 years old4 Summary measure of wage persistence
Summary measure of wage persistence, corrected for distributional differences3
United Kingdom is estimated to have relatively low wage mobility, while some Nordic countries appear to be more mobile, as frequently found in previous empirical studies (e.g. d’Addio, 2007; Corak, 2006). However, there are some differences. For instance, France appears to be much less mobile in terms of the “intergenerational income elasticity” than on the basis of the influence of fathers’ education on sons’ wages, perhaps reflecting that fathers’ education is not a good proxy for parental income in this country.
3.1.4. The role of education as a driver of persistence
As a further step in the analysis of wage persistence, an attempt was made to separate the direct influence of a father’s educational attainment on their offspring’s wages from the indirect effect going through their offspring’s own educational attainment (i.e. estimation of the relative magnitudes of coefficients a and b in equation [1], Box 4). The resulting estimates suggest that parental background mainly influences offspring wages through their own educational attainment (i.e. by indirectly influencing offspring productivity) except in a few countries (the United Kingdom, Spain, Italy, Netherlands, Luxembourg and Ireland) where direct linkages appear to be more important than the indirect ones through education. More specifically, in most countries fathers’ educational attainment (estimates of coefficient a in equation [1], Box 4) is no longer important (i.e. significant) in determining sons’ wages once the sons’ educational attainment is taken into account. This result is even more pronounced in the case of women (Causa et al., 2009, for details). Thus, education is a key factor explaining persistence in wages across generations in many countries and policies providing equal opportunities in access to education are essential in enhancing social mobility.
3.2. Cross-country patterns in intergenerational education mobility
Given that individuals’ educational attainment appears to be a key driver of wages in European OECD countries, it is important to understand to what extent skills acquired in formal education, including secondary and post-secondary, are influenced by parental background. Moreover, differences in secondary educational achievement due to parental background may contribute to differences in post-secondary achievement which, in turn, can lead to persistence in wages. To this end, this section analyses cross-country patterns of intergenerational education persistence in secondary education for teenagers, followed by persistence patterns in post-secondary education for adults.
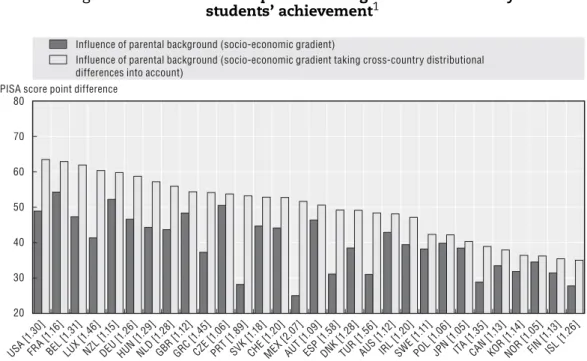
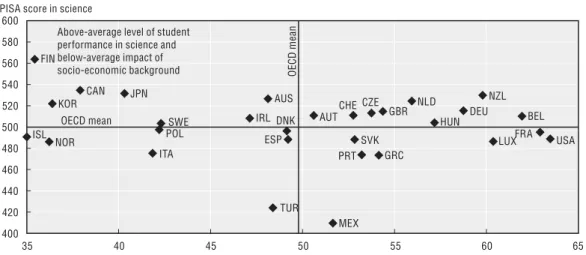
3.2.1. Parental background influences student achievement in secondary school The extent to which parental background, measured by a broad index of socio- economic status of a student’s family, influences student cognitive performance at the level of secondary education differs substantially across OECD countries (Figure 6). Henceforth, when discussing persistence in secondary educational achievement, this refers to the estimated influence of this index on a student’s performance on the PISA test score (see Causa and Chapuis, 2009, and Box 5 for details). As in the case of wage persistence, the estimates cannot distinguish between effects of parental background and genetically inheritable factors. France, New Zealand, the Czech Republic, United States and United Kingdom are among the countries where persistence is highest according to this metric, while persistence is relatively low in Iceland, Finland, Southern European countries, Mexico and Turkey.9
The variation within a country in the distribution of student socio-economic status (parental background) may matter for the overall impact of background on student achievement (OECD, 2007a; OECD, 2004). The cross-country patterns of intergenerational educational persistence change considerably after taking country differences in the distribution of socio-economic status into account (Figure 6).10 In countries like Mexico, Portugal, Luxembourg, Spain and Turkey, where the dispersion in student socio-economic background is wide, even a relatively mild influence of parental background on their achievement can lead to a large overall difference. After adjusting for the country-specific distribution of socio-economic status, the United States, France and Belgium are countries where parental background has the greatest influence on student achievement. The remainder of the discussion of persistence in secondary education takes these distributional differences across countries into account.
3.2.2. In many countries the school environment has a large influence on student achievement
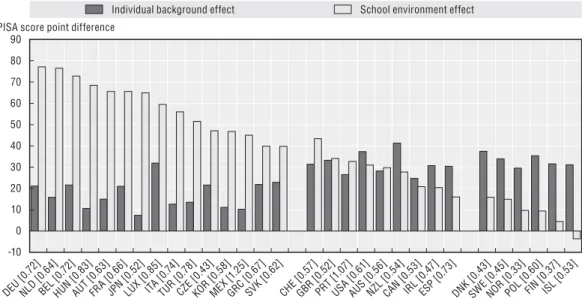
Using a similar approach to PISA 2007 (OECD, 2007a), Figure 7 decomposes the overall influence of parental background on student achievement into an individual background effect (“within-school” effect) and a school environment effect (“between-school” effect).
Figure 6. The influence of parental background on secondary students’ achievement1
Notes: Socio-economic gradient: change in PISA science score due to an improvement of one international standard deviation in the PISA index of student socio-economic background. Socio-economic gradient taking cross-country distributional differences into account: change in PISA science score due to an improvement of one country-specific, inter-quartile change in the PISA index of student socio-economic background.
Data in brackets are values of the difference between the highest and the lowest quartiles of the country-specific distribution of the PISA index of economic, social and cultural status, calculated at the student-level.
1. Regression of students’ PISA science performance scores on their PISA economic, social and cultural status (ESCS), a broad indicator of family’s socio-economic background. Country-by-country least-squares regressions weighted by students’ sampling probability. Robust standard errors adjusted for clustering at the school level. Regressions for Italy include regional fixed effects.
Source: OECD calculations based on the 2006 OECD PISA Database. 80
70
60
50
40
30
20
US A [1
.30] FR
A [1 .16] BE
L [1 .31] LU
X [1 .46] NZL
[1.15 ]
DEU [1.2
6]
HUN [1.2
9] NLD [
1.28 ]
GBR [1.12] GRC [1.4
5]
CZ E [1
.06] PRT
[1.8 9]
SV K [1
.18] CHE
[1.2 0]
ME X [2
.07] AU
T [1 .09] ES
P [1 .58] DNK
[1.2 8] TUR [
1.56] AUS
[1.12 ]
IRL [1.2
0]
SW E [1
.11] PO
L [1 .06] JP
N [1 .05] ITA [1.3
5]
CA N [1
.13] KO
R [1 .14] NOR [1.0
5] FIN
[1.13 ]
ISL [1.2
6] Influence of parental background (socio-economic gradient taking cross-country distributional
differences into account)
Influence of parental background (socio-economic gradient)
PISA score point difference
Box 5. The influence of parental background on student achievement in secondary education
The empirical analysis in Causa and Chapuis (2009) is based on the 2006 PISA Survey which collects a cross-country, comparable microeconomic dataset on student achievement (for details see OECD, 2007a; OECD, 2005a, b). PISA assesses the skills of students approaching the end of compulsory education in 67 countries, including all OECD countries. PISA 2006 measures mathematical, scientific and reading literacy, as well as problem-solving skills of students in each participating country. The target population is 15-year-old students in each country, regardless of the grade they currently achieve and independent of how many years of schooling are foreseen for 15-year-olds by the national school systems. The main focus of the PISA 2006 Study is on science literacy, with about 70% of the testing time devoted to this. Given the very high correlation among science, mathematics and reading scores, the analysis in this study focuses on those for science. OECD (2007a) points to the robustness of country-specific and cross-country empirical assessments to the use of either score. PISA scores have an OECD mean of 500 points and a standard deviation of 100 points.
Equity in student achievement is defined by the concept of equality of opportunity (Roemer, 1998, 2004), according to which educational achievement should not reflect circumstances that are beyond a person’s control, such as family socio-economic background. The empirical counterpart to this concept is to estimate the so-called “socio- economic gradient”, which measures how strongly student educational achievement, measured by PISA test scores, depends on the socio-economic background of the students’ families. Specifically, the analysis uses the Index of Economic, Social, and Cultural Status (ESCS) provided by PISA as the measure of parental background.
The PISA ESCS index is intended to capture a range of aspects of a student’s family and home background. It is explicitly created in a comparative perspective and with the goal of minimising potential biases arising as a result of cross-country heterogeneity. The student scores on the index are factor scores derived from a Principal Component Analysis which are standardised to have an OECD mean of zero and a standard deviation of one. Thus, the size of the achievement difference between students with high and low values on the ESCS index provides a measure of how fair and inclusive each school system is: the smaller the difference, the more equal are educational opportunities.
In the baseline empirical model the student-level score is regressed upon his or her family socio-economic background:
, [1]
where index i refers to individual, s to school and c to country; Yiscdenotes the student science test score, Fiscdenotes parental background as measured by the ESCS index; iscan error term; and refers to the influence of parental background on student achievement (i.e. the socio-economic gradient). Baseline estimations can be enriched to control for a number of individual factors (such as gender, migration and language spoken at home) and school factors (location, resources, size, ownership and funding), allowing comparison of the “gross” and “net” impact of family background on student performance. The estimates take into account the hierarchical and sampling structure of the PISA dataset; specifically, they are based on a clustering-robust linear regression technique, which does not require that individual observations be independent within schools, but only that they be independent across schools (see Causa and Chapuis, 2009, for details). In addition, probability weighting is used to reflect differing sampling probabilities across students within countries.
isc isc c c
isc
F
Y
1
1
The individual background effect measures the relationship between student socio- economic background and student performance within a given school, while the school environment effect measures the relationship between the average socio-economic status of families of students in a given school and individual student performance, controlling for his/her parental background (Box 5).11 The school environment effect can be considered as a proxy for the contextual effect arising in the school, reflecting the extent to which student achievement depends on the socio-economic composition of their peer group (see Causa and Chapuis, 2009, for a detailed discussion). Not all of the contextual effect is attributable to peer-group effects; it may also reflect educational school resources and the way students are allocated within a district or region or to classes and programmes within schools (OECD, 2007a).
The numbers presented in Figure 7 represent, respectively: i) the increase in a student’s PISA score obtained from moving the student from a school where the average socio-economic intake is relatively low to one where the average is relatively high; and ii) the increase in a student’s PISA score obtained from moving the student from a relatively low socio-economic status family to one that has a relatively high socio-economic status, while he/she stays in the same school. Comparisons incorporate the impact of the country- specific distribution of socio-economic status (both within and across schools) in the analysis.12
In all OECD countries, there is a clear advantage in attending a school whose students are, on average, from more advantaged socio-economic backgrounds, as indicated by the school environmental effect. In over half of the OECD countries, the school environmental effect is substantially higher than that of the individual background. However, cross-country differences are striking. Some countries show substantial inequalities associated with attending different schools: this is, for instance, the case in Germany or the Netherlands, where moving a student from a below-average school environment to an above-average one raises test scores by, respectively, 77 and 76 points, while the same move in Finland and Norway raises test scores by 4 and 10 points, respectively. These cross-country patterns are in line with existing evidence, in particular when comparing comprehensive school systems (e.g. Nordic countries) and non-comprehensive systems (e.g. Austria and Germany) (OECD,
13
Box 5. The influence of parental background on student achievement in secondary education (cont.)
The influence of parental background on student performance in secondary education can be divided into two parts, the “individual background” effect (Fisc) and the “school environment” effect ( ), defined as the weighted average of students’ socio-economic background weighed by students’ individual weights in the school attended by individual i (which is computed excluding the student himself). The empirical approach for estimating the influence of individual background and school environment on student test scores is an extension of equation [1]:
. [2]
Hence, while parameter wc refers to the individual’s background effect, the parameter bc refers to the school environment effect. As in equation [1], equation [2] can also be extended to control for student and school-level characteristics.
Fsc
sc isc bc isc wc c
isc F F
Y
1
3.2.3. Intergenerational persistence in post-secondary education achievement
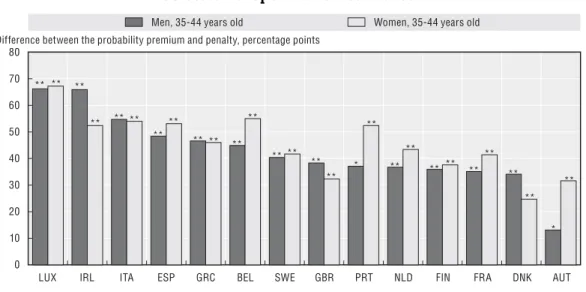
Parental background can also influence post-secondary educational achievement of their offspring, although cross-country comparable evidence is rather sparse (Box 6). Here, this issue has been investigated empirically by estimating the percentage increase (decrease) in the probability of achieving a certain level of education given parents’ education based on comparable data for European OECD countries (Box 4 and Causa et al., 2009, for details). This gives an indication of the extent to which the offspring’s education level reflects that of their parents, and can be taken as a measure of intergenerational persistence in education.
Across all European OECD countries covered by the analysis, there is a positive estimated probability premium of achieving tertiary education associated with coming from a higher-educated family, while there is a probability penalty associated with growing up in a less-educated family (Figure 9). For pairs of fathers and sons, the estimated premium is particularly large in Luxembourg and Italy, and also in Finland and Denmark, where the probability of achieving tertiary education is almost 30 percentage points higher
Figure 7. Effects of individual background and school socio-economic environment on students’ secondary achievement1
Socio-economic gradient taking cross-country distributional differences into account
Differences in performance on the PISA science scale associated with the difference between the highest and the lowest quartiles of the country-specific distribution of the PISA index of economic, social and cultural status
Notes: The individual background effect is defined as the difference in performance on the PISA science scale associated with the difference between the highest and the lowest quartiles of the average individual background effects distribution of the PISA index of economic, social and cultural status, calculated at the student-level. The school environment effect is defined as the difference in performance on the PISA science scale associated with the difference between the highest and the lowest quartiles of the country-specific school-level average distribution of the PISA index of economic, social and cultural status, calculated at the student-level.
Data in brackets are values of the difference between the highest and the lowest quartiles of the country-specific school- level average distribution of the PISA index of economic, social and cultural status, calculated at the student-level. The negative school environment effect for Iceland is not statistically significant.
1. Regression of students’ science performance on students’ family socio-economic background (as measured by PISA ESCS), and school-level socio-economic background (average PISA ESCS across students in the same school, excluding the individual student for whom the regression is run). Country-by-country least-squares regressions weighted by students’ sampling probability. Robust standard errors adjusted for clustering at the school level. Regressions for Italy include regional fixed effects.
Source: OECD calculations based on the 2006 OECD PISA Database. 90
80 70 60 50 40 30 20 10 0 -10
DEU [0.7
2]
NL D [0.6
4] BEL [
0.72 ]
HUN [0.8
3]
AUT [ 0.63] FRA
[0.6 6] JPN [
0.52] LUX [
0.85] ITA [
0.74] TUR [0
.78] CZE [
0.43 ]
KOR [ 0.58
]
MEX [ 1.25] GRC
[0.6 7] SVK [
0.62] CHE
[0.57 ]
GBR [0.5
2] PRT [1.0
7] USA [
0.61 ]
AUS [0.5
6] NZL
[0.5 4]
CAN [ 0.53]
IRL [ 0.47
]
ESP [ 0.73
]
DNK [0.4
3]
SW E [0.
45] NOR
[0.3 3]
POL [ 0.60]
FIN [ 0.37]
ISL [0 .53] PISA score point difference
Individual background effect School environment effect