Received 7 Nov 2013|Accepted 27 May 2014|Published 26 Jun 2014
Human symptoms–disease network
XueZhong Zhou
1,2,3,*, Jo
¨rg Menche
2,3,4,*, Albert-La
´szlo
´ Baraba´si
2,3,4,5,6& Amitabh Sharma
2,3,6In the post-genomic era, the elucidation of the relationship between the molecular origins of diseases and their resulting phenotypes is a crucial task for medical research. Here, we use a large-scale biomedical literature database to construct a symptom-based human disease network and investigate the connection between clinical manifestations of diseases and their underlying molecular interactions. We find that the symptom-based similarity of two diseases correlates strongly with the number of shared genetic associations and the extent to which their associated proteins interact. Moreover, the diversity of the clinical manifestations of a disease can be related to the connectivity patterns of the underlying protein interaction network. The comprehensive, high-quality map of disease–symptom relations can further be used as a resource helping to address important questions in the field of systems medicine, for example, the identification of unexpected associations between diseases, disease etiology research or drug design.
DOI: 10.1038/ncomms5212
1School of Computer and Information Technology and Beijing Key Lab of Traffic Data Analysis and Mining, Beijing Jiaotong University, Beijing 100044, China. 2Center for Complex Network Research, Northeastern University Physics Department, 111 DA/Physics Dept., 110 Forsyth Street, Boston, Massachusetts
02115, USA.3Center for Cancer Systems Biology, Dana-Farber Cancer Institute, Smith Bldg., Rm. 858A, 450 Brookline Ave, Boston, Massachusetts 02215,
USA.4Department of Theoretical Physics, Budapest University of Technology and Economics, Budafoki u´t. 8, 1111 Budapest, Hungary.5Center for Network
Science, Central European University, Na´dor u´t. 9, 1051 Budapest, Hungary.6Channing Division of Network Medicine, Brigham and Women’s Hospital,
T
he past decades have brought remarkable advances in our understanding of human disease1. While progress on the genetic and proteomic aspects has been impressive2, most aspects of the relation between genotype and phenotype still remain unclear, especially for complex diseases1. Heterogeneity, polygenicity and pleiotropism are major factors that are hampering the progress3,4, as well as diffuse boundaries between diseases5, as they can have multiple causes and be related through several dimensions6–13. A number of resources have been constructed aiming to understand the entangled relationship between diseases, often in the form of networks6. For example, Rzhetsky et al.12 inferred the comorbidity links between 161 disorders from the disease history of 1.5 million patients and proposed models to estimate the genetic overlap between diseases. Hidalgo et al.9 constructed a disease phenotypic network using comorbidity patterns from more than 30 million Medicare patients, capturing disease progression patterns, such as that patients tend to develop diseases in the network vicinity of diseases that they already have and that patients with highly interconnected diseases show higher mortality. In model organisms, for example, physical protein interactions point to genes that are related to similar phenotypes when knocked out14–17. Furthermore, a number of studies indicated that similarity between phenotypes reflects biological modules of interacting functionally related genes. Likewise, phenotypic similarities between monogenic syndromes in human have been shown to reflect shared biological mechanisms and can be exploited to predict gene function18–20. Interestingly, the inclusion of disease phenotype similarities can substantially improve the performance of candidate gene prediction methods21–24. Resources like the Human Phenotype Ontology25 (HPO) and the Mammalian Phenotype Ontology26 provide a standardized vocabulary of phenotypic information that can also be used to transfer detailed knowledge of model organisms to interpret and predict associated phenomena in human27,28.An important available resource that has been overlooked so far is the highest level clinical phenotypes, that is, symptoms and signs (called symptoms in brief in the following). Symptoms are crucial in clinical diagnosis and treatment. For example, the major symptoms of a heart attack are pain or discomfort in the chest, arms or shoulder, jaw, neck, or back, feeling weak, light-headed or faint and shortness of breath29. The wide range of symptoms illustrates the interdependence of the homeostatic mechanisms, whose perturbations lead to the manifestation of a disease. Community health professionals and general practitioners derive most of their knowledge of the symptoms of individual diseases from hospital-based observation30. Indeed, symptoms are the most directly observable characteristics of a disease and the very basis of clinical disease classification. The elucidation of the connection between shared symptoms and shared genes or protein–protein interactions of two diseases could therefore help bridge the gap between bench-based biological discovery and bedside clinical solutions.
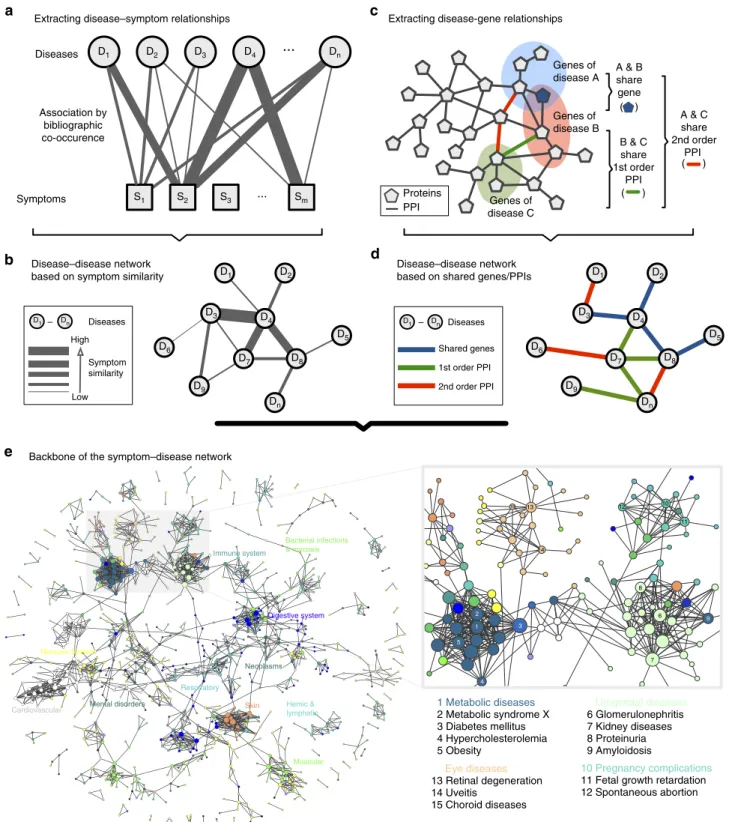
In this paper, we use large-scale medical bibliographic records and the related Medical Subject Headings (MeSH) metadata31from PubMed32, to generate a symptom-based network of human diseases (Human Symptoms Disease Network, HSDN), where the link weight between two diseases quantifies the similarity of their respective symptoms. By integrating disease–gene association and protein–protein interaction (PPI) data, we investigate the correlations between the symptom similarity of diseases and their degree of shared genes or PPIs (Fig. 1 and Supplementary Fig. 1).
Results
Construction of the HSDN. We extracted 7,109,429 (about 35.5%
in over twenty million records) PubMed bibliographic records with one or more disease/symptom terms in the MeSH metadata field
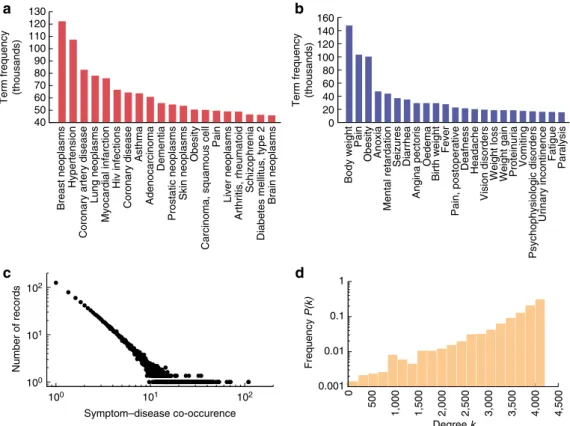
(see Methods), yielding a total of 4,442 disease terms and 322 symptom terms (Supplementary Data 1 and 2). After filtering for the co-occurrence of at least one disease and one symptom term, 849,103 (4.2%) PubMed records were left. From these records, we extracted the symptom–disease relationships, resulting in 147,978 connections between 322 symptoms and 4,219 diseases (Fig. 2, Supplementary Data 3), which represent 98.5% of all symptoms and 95.0% of all diseases contained in the MeSH vocabulary. To quantify the relation between a symptom and a disease, we then used the term frequency-inverse document frequency (see Methods). After measuring the symptom similarities for all disease pairs, we obtained the HSDN with 7,488,851 links with positive similarity between 4,219 diseases. The HSDN covers all MeSH disease categories, from broad categories like cancer to specific conditions like cerebral cavernous hemangioma. The twenty most frequent diseases and symptoms are depicted in Fig. 2a,b. The two most frequent diseases in the PubMed database are breast cancer and hypertension. Note that this reflects the cumulative focus of research in the biomedical field rather than the epidemical pre-valence of diseases. The HSDN constitutes a single giant compo-nent, that is, all diseases directly or indirectly connect to all others. The network is very dense, with 94% of the nodes being connected to more than 50% of all other nodes (Fig. 2d). The most highly connected disease is Hyponatremia (4,214 disease neighbours), an electrolyte disorder associated with a number of common symp-toms that occur in many diseases, such as headache, nausea and fatigue. The disease with the fewest connections is Odontoma (eight disease neighbours), a tumour originating from teeth.
Performance evaluation of the HSDN. In order to validate our
approach, we did an extensive manual quality check of the core data. We randomly selected 1,000 PubMed records and manually evaluated the extracted symptom–disease relations with the aid of medical experts (see Supplementary Methods, Supplementary Data 5). We find that (i) the vast majority of the relations are medically meaningful and direct. The only notable (5.5% of the random records) confounding factors were symptoms related to drug treatment instead of the immediate disease. (ii) The disease relations in the HSDN are very specific, 57% of the random records contain only a single disease, 28.5% contain two and only 14.5% more than two. (iii) The automated process yields very few false positives: only 0.8% of the cases contained a negation as in ‘disease X is NOT related to symptom Y’ that our text mining approach could not capture.
To further test the reliability of the obtained disease similarity score, we create a benchmark disease network using the manually curated HPO25 data (Supplementary Methods), in which two diseases are connected if they share at least one symptom. The benchmark network includes 940 MeSH diseases (corresponding to 2,111 OMIM disease identifiers) and 121,945 links. It is much smaller than the HSDN, but arguably of high quality. Comparing the HSDN with the HPO network, we find that higher symptom similarity in the HSDN is related to higher edge overlap with the HPO network (Fig. 3a). The Pearson correlation coefficient (PCC) between the ratio of shared disease links and disease similarity is very high (PCC¼0.96, P¼1.4105), indicating that the proposed disease similarity is a reliable measure for shared symptoms. For comparison with random expectation, we reshuffled (10 random permutations) the symptom features of each disease using the Fisher–Yates method33, finding significantly less overlap and fewer high similarity values (Fig. 3b). In randomized networks, most disease similarities are low (o0.1), and their distribution is significantly different from
To further examine the completeness of the HSDN, we calculate the number of the common nodes and links with the HPO disease network (Fig. 3c). The results show that the benchmark network from HPO is almost a complete subset of the HSDN, which captures 898 of its nodes (95.5%) and 107,098 of its links (87.8%
of the whole HPO network, 95.7% of the subnetwork of the 898 common nodes). The number of overlapping links is significantly higher (P¼2.21016, binomial test, see Supplementary Methods) than random expectation, again indicating that the HSDN offers reliable relationships.
D9
D7 D8
D4
D3
D5
D2
D6
D1
Dn
D9
D7 D8
D4
D3
D5
D2
D6
D1
Dn
Symptom similarity High
Low
D1 – Dn Diseases
Shared genes
1st order PPI
2nd order PPI
D1 – Dn Diseases
Disease–disease network based on symptom similarity
Disease–disease network based on shared genes/PPIs
Genes of disease A
Genes of disease B
Genes of disease C
D3 Dn
D1
S2
D4
D2
S1 S3 ... Sm
...
Diseases
Symptoms Association by
bibliographic co-occurence
A & B share gene ( )
B & C share 1st order
PPI ( )
A & C share 2nd order
PPI ( )
1 2
3
4
13 15
14
5
8
6 9
7 11 10 12
1 Metabolic diseases 2 Metabolic syndrome X 3 Diabetes mellitus 4 Hypercholesterolemia 5 Obesity
Urogenital diseases
6 Glomerulonephritis 7 Kidney diseases 8 Proteinuria 9 Amyloidosis
10 Pregnancy complications
11 Fetal growth retardation 12 Spontaneous abortion
Eye diseases
13 Retinal degeneration 14 Uveitis
15 Choroid diseases
Extracting disease–symptom relationships Extracting disease-gene relationships
Backbone of the symptom–disease network
Proteins PPI
Cardiovascular Skin
Respiratory
Muscular
Digestive system
Nervous System
Bacterial infections & mycosis
Hemic & lymphatic Neoplasms Immune system
Mental disorders
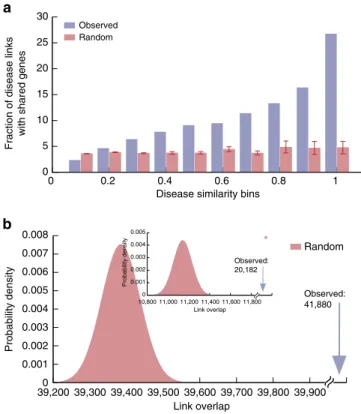
Shared symptoms indicate shared genes between diseases. We integrated three genotype–phenotype databases, yielding 28,336 disease–gene associations (Supplementary Methods, Supplementary Data 6) and constructed a Human Disease Net-work as described in Goh et al.13, in which two diseases are connected if they share an associated gene. The resulting network consists of 1,741 diseases and 47,410 links. Comparing the link overlap between the HSDN and Human Disease Network, we find a total of 41,880 overlapping links (20,182 overlapping disease links with similarity score Z0.2, a 1.8-fold increase
compared with random expectation, P¼2.21016, binomial test; Fig. 4b). The overlapping link ratio (fraction of disease pairs with both shared symptoms and shared genes of all disease pairs with shared symptoms) shows strong positive correlation with disease similarity (PCC¼0.92 andP¼1.8104; Fig. 4a), that is, diseases with more similar symptoms are more likely to have common gene associations. Disease pairs with well-established similar clinical manifestations and known common genes include, for example, hypoalphalipoproteinemia and metabolic syndrome (similarity score 0.97), insulin resistance and metabolic syndrome (0.99), insulin resistance and diabetes mellitus (0.97), fatty liver and diabetes mellitus (0.93) and duodenal ulcer and stomach ulcer (0.93). High similarity scores can also suggest yet unknown common genetic associations. For example, a recent study34established similar patterns of genomic alteration in the two cancer types colonic neoplasm and rectal neoplasm. In the HSDN, they also have very similar clinical manifestations (similarity score 0.64), even higher values are obtained between the related terms rectal neoplasms and colorectal neoplasms (0.92) or colonic neoplasms and colorectal neoplasms (0.73).
Shared symptoms indicate shared protein interactions. To
further assess whether shared symptoms indicate not only shared genetic associations, but also close interaction of the corre-sponding proteins, we integrated five publicly available PPI databases (Supplementary Methods) and constructed disease networks in which two diseases are linked if they have shared 1st and 2nd order PPI interactions, respectively: shared 1st order PPI means that two diseases have associated proteins that directly interact within the PPI network, while shared 2nd order PPI means that they are connected by a path of length two (Fig. 1c,d). In both cases, we find strong positive correlations between symptom similarity and shared PPIs. The ratio of diseases with shared PPIs increases significantly with higher symptom simi-larity (PCC¼0.89, P¼5.4104 for 1st order interactions, Fig. 5a; PCC¼0.84,P¼0.002 for 2nd order interactions, Fig. 5b). It is well established that proteins associated to the same human disease/disease category or phenotype tend to interact with each other13,20,35. In contrast to previous phenotype maps19, the HSDN strictly considers only symptom features (excluding in particular disease terms themselves, anatomical features, congenital abnormalities, and so on) and is not focused on monogenic diseases, but includes all disease categories. Our results therefore provide robust evidence that interacting proteins between diseases are also connected to similar high-level manifestations.
This broader scope enables us to extend previous approaches to uncover novel disease associations. For example, it is considered that both genetic and environmental factors play a role in the pathogenesis of Parkinson’s disease (PD)36, which is characterized by resting tremor, akinesia and rigidity. In the
40 50 60 70 80 90 100 110 120 130
Term frequency (thousands)
0 20 40 60 80 100 120 140 160
Term frequency (thousands)
0.001 0.01 0.1 1
0
500
1,000 1,500 2,000 2,500 3,000 3,500 4,000 4,500
100
101
102
100 101 102
Number of records
Symptom–disease co-occurence
Breast neoplasms
Hypertension
Coronary artery disease
Lung neoplasms
Myocardial infarction
Hiv infections
Brain neoplasms
Diabetes mellitus, type 2
Schizophrenia
Arthritis, rheumatoid
Liver neoplasms
Pain
Carcinoma, squamous cell
Obesity
Skin neoplasms
Prostatic neoplasms
Dementia
Adenocarcinoma
Asthma
Coronary disease
Paralysis
Fatigue
Urinary incontinence
Psychophysiologic disorders
Vomiting
Proteinuria
Weight gain
Weight loss
Vision disorders
Headache
Deafness
Pain, postoperative
Fever
Birth weight
Oedema
Angina pectoris
Diarrhea
Seizures
Mental retardation
Anoxia
Obesity
Pain
Body weight
Frequency
P(k)
Degree k
HSDN, we found that PD has highly similar symptoms with substance-related diseases like mercury poisoning (0.60), MPTP (1-methyl-4-phenyl-1,2,3,6-tetrahydropyridine, a toxin) poisoning (0.58) and manganese poisoning (0.52). MPTP is an established disease model for PD37, and manganese poisoning has also been proposed recently38. Similarly, it has been suggested that the molecular response to mercury exposure may increase dopamine neuron vulnerability and the propensity to develop PD39.
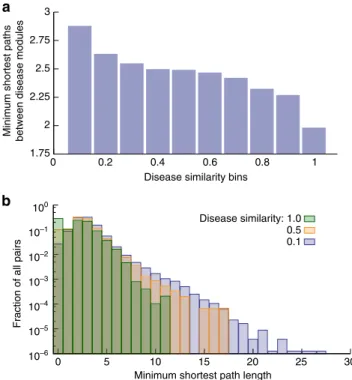
The results above indicate that high symptom similarity strongly correlates with shared genes, as well as with 1st- and 2nd-order protein interactions. This suggests that there is a general relationship between phenotypic similarity on one hand, and path lengths on the PPI network on the other hand. To test this hypothesis, we calculate the minimum shortest path length (MSPL) of proteins within the PPI network for each disease pair
(see Methods). Indeed, we find strong negative correlation between the MSPL and symptom similarities (PCC¼ 0.93 and P¼7.7105; Fig. 6a,b), that is, the higher the symptom similarity, the shorter the PPI network distance between diseases. The MSPL decreases from 2.88 to 1.98 when disease similarity bins increase from 0.1 to 1.0. This indicates that the network parsimony principle6 according to which causal molecular pathways tend to coincide with shortest network paths can be used to quantify the correlation between manifestations of diseases and their related protein interactions.
Diversity of disease manifestations and molecular mechanisms.
In genetic nosology, it has been recognized that due to pleio-tropism and genetic heterogeneity there is a large discrepancy between the diversity of their clinical manifestations and the underlying cellular mechanisms4. For example, sickle cell disease has rather diverse clinical manifestations, such as mild anaemia, painful crises, bony infarcts and acute chest syndrome, despite being a classical monogenic disease. Familial hypertrophic cardiomyopathy on the other hand, is caused by mutations of a number of different genes, yet its pathophysiology largely manifests itself in a specific portion of the heart muscle (which in turn may lead to several clinical phenotypes). To fully unravel these complex relations, comprehensive and complete maps are needed that combine genome or proteome components with intermediate phenotype components, environmental factors and pathophenotypes5.
20 25 30 35 40 45 50 55 60 65
0 0.2 0.4 0.6 0.8 1
Fraction of overlapping links
in HPO network
Disease similarity bins Random
Observed
101
102
103
104
105
0 0.2 0.4 0.6 0.8 1
Number of overlapping links
in HPO network
Disease similarity bins
Random Observed
0 0.001 0.002 0.003 0.004 0.005
103,200 103,400 103,600 103,800 104,000 104,200
Probability density
Link overlap
Random
Observed: 107,098
Figure 3 | Reliability evaluation of symptom similarity in the HSDN.
(a) The percentage of HPO network disease links in the HSDN for different similarity bins. In the real data, stronger symptom similarity is related to higher edge overlap with the HPO network. For high similarity values, the overlap is much bigger than expected by chance as in 10 random permutation cases. (b) The overlapping edge count distributions for real data and random permutation. Error bars inaandbdenote s.d. (c) Number of overlapping disease links (observed overlapping links versus random expectation).
0 0.001 0.002 0.003 0.004 0.005 0.006 0.007 0.008
39,200 39,300 39,400 39,500 39,600 39,700 39,800 39,900
Probability density
Link overlap
Random
Observed: 41,880 0
5 10 15 20 25 30
0 0.2 0.4 0.6 0.8 1
Fraction of disease links
with shared genes
Disease similarity bins Random
Observed
0 0.001 0.002 0.003 0.004 0.005
Probability density
Link overlap
Observed: 20,182
10,800 11,000 11,200 11,400 11,600 11,800
Figure 4 | Correlation between symptom similarity and shared genes.
In a first attempt to analyse the relation between molecular and phenotypic diversity of diseases, we construct an integrated disease network that combines phenotypic relations based on symptom similarity, with shared molecular mechanisms based on protein interactions: First, we filter the HSDN for significant links with similarity scores40.1 (1,121,899 links remain). Second, we identify all disease links that are supported by either shared genes, or 1st/2nd order protein interactions. The resulting shared symptoms and shared genes/PPIs network (SGPDN) contains 133,106 interactions between 1,596 distinct diseases (Supplementary Data 4). We used two quantities to measure disease diversity in this network: betweenness and node diversity (see Methods). In the HSDN, we assume that a disease has a high capability to accommodate different manifestations when it has a high network betweenness, that is, a high number of shortest paths pass through it. We calculated the disease diversity in the SGPDN and the corresponding maximum diversities of disease-related genes in the PPI network, finding strong positive correlations between the two (node diversity correlation: PCC¼0.84, P¼2.51010, Fig. 7a; betweenness correlation: PCC¼0.59,P¼9.5107, Fig. 7b). These results demonstrate that a disease with diverse clinical manifestations will typically also have more diverse underlying cellular network mechanisms.
Disease groups. The HSDN approach can further be used to
study interrelationships between groups or classes of diseases. In order to obtain a more global view, we extracted the backbone of the SGPDN disease network using the multi-scale backbone algorithm40(Supplementary Methods). The resulting subnetwork includes 2,159 disease links with significant associations of shared symptoms, shared genes and (1st or 2nd order) PPIs (Fig. 1e and Supplementary Fig. 2). We find that diseases within the same
category form clear, highly interconnected communities, such as metabolic diseases, respiratory tract diseases, digestive system diseases, cardiovascular diseases, neoplasms and mental disorders. Exceptions include bacterial infectious diseases, virus diseases and parasite diseases, which appear to be spread among other disease categories. Besides the links within the same category, there are also many links connecting diseases of different categories, for example, between neoplasms and other disease categories. In particular, we find that the three main disease risks, namely infectious diseases, chronic inflammation diseases and neoplasms, are highly interconnected. A detailed analysis of these connections may yield novel insights into the more and more widely recognized pathological and aetiological associations between inflammatory diseases and neoplasms41and the human genetic susceptibility to infectious diseases42.
Discussion
Despite the known limitations in completeness and quality of currently available data on clinical manifestations and cellular mechanisms of disease, our results indicate strong associations between symptom similarity of diseases and shared genes and PPIs, as well as a clear correspondence between the diversity of the clinical manifestations of diseases and the underlying diversity in their cellular mechanisms. This demonstrates that individual-level disease phenotypes (for example, symptoms) and molecular-level disease components (for example, genes and PPIs) show robust correlations, even though their direct associations are influenced by complicated intermediate factors43. This finding opens up promising venues to use the presented symptom-based network as a rich resource to quantitatively address diverse questions in the field of systems medicine.
The observed correlations between clinical manifestations and molecular mechanisms of diseases can be highly valuable for functional annotations of genomics11 and reveal regularities between different disease categories. Inflammatory bowel diseases
34 36 38 40 42 44 46 48 50 52 54 56
0 0.2 0.4 0.6 0.8 1
Fraction of disease links with
shared 2nd order PPIs
Disease similarity bins Random
Observed 5
10 15 20 25 30 35
0 0.2 0.4 0.6 0.8 1
Fraction of disease links with
shared 1st order PPIs
Disease similarity bins Random
Observed
Figure 5 | Correlation between symptom similarity and shared PPIs.
Percentage of overlapping disease links between the network of shared symptoms and the network of shared 1st order PPIs (a) and shared 2nd order PPIs (b). Random expectations are derived from 10 random permutations, error bars denote s.d.
10–6
10–5
10–4 10–3
10–2
10–1
100
0 5 10 15 20 25 30
Fraction of all pairs
Minimum shortest path length 0.1 0.5 1.0 2
1.75 2.25 2.5 2.75 3
0 0.2 0.4 0.6 0.8 1
Minimum shortest paths between disease modules
Disease similarity bins
Disease similarity:
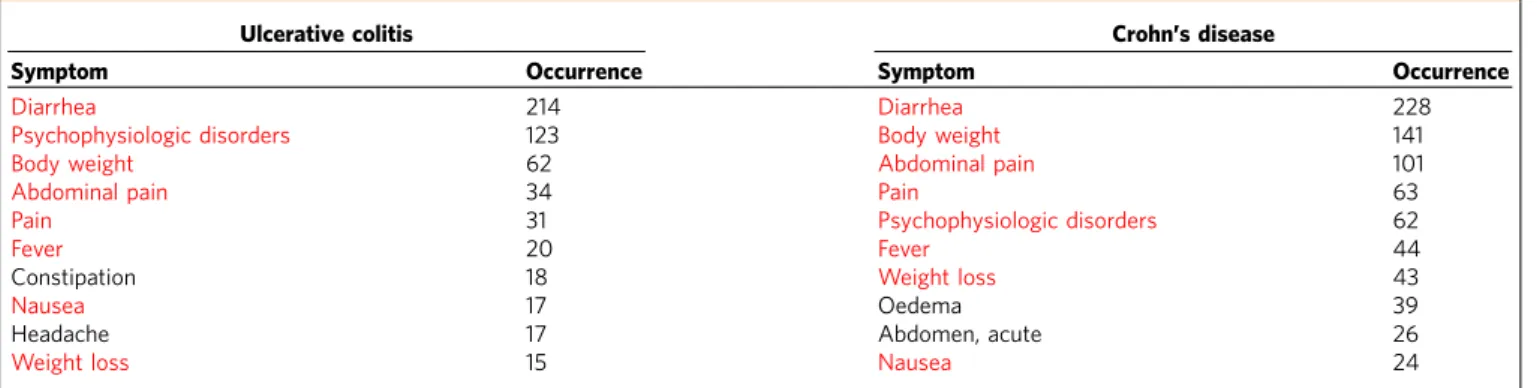
(IBD), for example, are a group of diseases of increasing global prominence, generally described by chronic relapsing inflammatory conditions of the gastrointestinal tract. There are two major types, ulcerative colitis (UC) and Crohn’s disease (CD)44. Despite their very different pathological characteristics, they may present with common symptoms like abdominal pain, vomiting, diarrhoea, rectal bleedingand weight loss. In total, UC and CD share 78 symptoms in the HSDN (similarity score
B0.89). In agreement with the clinical recognition of UC and
CD, eight out of their respective 10 symptoms with the highest bibliographic co-occurrence are in common (Table 1). Also at the molecular level many shared genetic risk loci/genes have been identified, for example, IL23R, JAK2, IL12B, STAT3, PTPN2,
TNFSF15 and CARD945. A recent research found 71 new genome-wide significant associations for a total of 163 IBD loci, most of which contribute to both UC and CD phenotypes46. We have further investigated the correlation between IBD and all the 27 disease categories in MeSH (Supplementary Methods and Supplementary Table 1). In addition to the expected relation to other digestive system diseases, we found positive correlations with bacterial infections, virus diseases, parasitic diseases and immune system diseases (Supplementary Fig.7, Supplementary Tables 2 and 3). This finding is also coherent with genome-wide association study results46, showing that genetic loci identified for IBD have a strong overlap with genes tied to the immune response to mycobacterial infections and to other immune-related disorders such as ankylosing spondylitis and psoriasis.
A second promising example for the use of our broad data across disease categories is a comparison between genetic and infectious diseases. By analysing integrated data (virus targets, related PPIs and disease–gene associations) of the Epstein–Barr virus (EBV) and the human papillomavirus, a recent study47 showed that these viruses perturb the host network in a highly localized fashion, indicating that primarily the proteins directly connected to viral targets play a mechanistic role in the implicated diseases. We examined the HSDN network for diseases with similar symptoms as EBV infections. The 20 most strongly associated diseases include several EBV-implicated diseases, such as infectious mononucleosis (similarity score 0.63), T-cell lymphoma (0.59), Hodgkin disease (0.59), diffuse large B-cell lymphoma (0.58) and non-Hodgkin lymphoma (0.58). These examples show that diseases associated with genes located in the close neighbourhood of EBV targets in the PPI network also exhibit high symptom similarity with EBV infections. Symptom similarity scores could therefore provide a promising venue for gene prioritization and target identification of viral/bacterial infections.
Another important area in which symptoms play a crucial role is drug-related research. Most drugs approved by the US Food and Drug Administration are merely palliative48, that is, they only treat symptoms rather than targeting disease-specific genes or pathways. A detailed understanding of how symptoms relate to underlying molecular processes is therefore central for our efforts towards more effective and individualized treatments. First attempts in this direction have been proposed recently in drug design, using for example phenotype screening or the similarities of side-effects49, which are also most often observed and reported as clinical symptoms50. Our comprehensive symptom-based disease relationships may provide valuable input for such approaches. For example, the similar treatment of the two diseases with high symptom similarity discussed above, UC and
–1 0 1 2
–1.5 –1 –0.5 0 0.5 1 1.5 2
Disease-related
gene maximum diversity
Disease node diversity
0 2 4 6
–1 0 1 2 3 4 5 6 7 8
Disease-related
gene maximum diversity
Disease node betweenness
Figure 7 | Disease node diversity and betweenness.Disease node diversity (a) and betweenness (b) in the disease network compared to the node diversity/betweenness of the related genes within the PPI network. The values of node diversity/betweenness are normalized byz-score. The red points inbrepresent data points that have been removed in order to test for the sensitivity of our results towards possible outliers. The results remained the same. Error bars denote s.d. of the data in the respective bins.
Table 1 | The ten symptoms with the highest co-occurrence with Crohn’s disease and ulcerative colitis.
Ulcerative colitis Crohn’s disease
Symptom Occurrence Symptom Occurrence
Diarrhea 214 Diarrhea 228
Psychophysiologic disorders 123 Body weight 141
Body weight 62 Abdominal pain 101
Abdominal pain 34 Pain 63
Pain 31 Psychophysiologic disorders 62
Fever 20 Fever 44
Constipation 18 Weight loss 43
Nausea 17 Oedema 39
Headache 17 Abdomen, acute 26
Weight loss 15 Nausea 24
CD, is well established in clinical practice. In both cases, steroids are used to relieve symptoms, as well as common drugs, for example, azathioprine, infliximab and olsalazine. We speculate that the HSDN could help in systematically generating hypotheses for such disease pairs. Alzheimer’s disease (AD), for example, is still lacking an effective therapy to reverse the progressive loss of memory and other cognitive functions. In the HSDN, AD shows high symptom similarity with epilepsy and several of its variants, like temporal lobe epilepsy (0.63). The two diseases also exhibit significant comorbidity51. An antiepileptic drug (levetiracetam) was recently found to reverse deficits in learning and memory in AD mice and might also help ameliorate related abnormalities in human52.
Symptoms represent the high-level manifestations of a disease that are actually observed by patients and physicians. Ultimately, it is due to certain symptoms that an individual will seek professional help, and they are crucial for accurate clinical diagnosis and designing the appropriate treatment. However, the objective validation of the patients’ experience of major classes of symptoms still remains a pressing challenge in clinical practice. Currently, the MeSH metadata do not include more accurate, quantitative descriptions of symptom features (for example, severity, frequency or prevalence rate). Promising routes to further increase the accuracy of symptom-based disease relations would therefore be the integration of medical terminologies and clinical data. Clinical terminology systems like SNOMED-CT53 hold millions of relationships between medical entities (for example, diseases, body locations and clinical findings), yet currently they only contain relatively few symptom–disease associations as considered in this study (Supplementary Methods). A second source containing vast amounts of relevant information are electronic health records and their related personal laboratory results. These data probably constitute the richest and most promising resource towards a quantitative, personalized description of symptom–disease relationships. To this date, however, clinical documentation is still highly variable and rife with errors and imprecision54,55. Symptoms are typically described in narrative notes, therefore requiring complex full-text analysis. In addition, a large-scale data integration aiming at comprehensive disease and population coverage will also meet difficulties pertaining to privacy issues and semantic interoperability across institutions or countries56. Notwithstanding these challenges, we are convinced that advances in the field of automated text mining57will eventually enable us to substantially expand the data presented in this manuscript.
Methods
Basic datasets.The construction of a symptom-based disease network requires (i) a basic taxonomy for diseases and symptoms and (ii) a corpus of data from which to extract their relations. After evaluating several possible options (see Supplementary Methods, Supplementary Data 6 and 7 for a comparison with SNOMED-CT, ICD9/10 and HPO), we chose the combination of the MeSH vocabulary and the PubMed literature database. The MeSH classification is defined by experts and offers a comprehensive vocabulary across all disease categories (in contrast to, for example, OMIM which focuses on monogenic diseases), system-atically organized in a hierarchical tree (in contrast to, for example, ICD9/10 which has only two levels). The most important advantage for our purposes is that MeSH is used directly to index all articles in the massive PubMed database. The indexing is done manually by trained experts and according to standardized procedures, thereby ensuring highly accurate assignments58. In addition, this process alleviates a core challenge in medical text mining, the ambiguity and multiple conventions in nomenclature, since the MeSH nomenclature includes synonymous aliases for any given term.
The basic data used in our study also bears certain limitations. The MeSH vocabulary is relatively old and rigid with only annual updates. This may limit the extent to which the identified associations capture latest research results of the rapidly evolving field of medicine. On the other hand, stable and well-established terms may also lead to more robust associations for our purposes. Other important shortcomings are that MeSH has relatively few disease terms (compared with, for
example, ICD9/10) and that our associations are not derived directly from clinical diagnosis, but from research articles. In the future, it would be highly desirable to develop techniques that enable us to automatically extract information from clinical records. Currently available methods for this very challenging problem of automated full-text analysis in large-scale data do not yield results with comparable accuracy55. A challenge inherent to all disease taxonomies is that the distinction
between symptoms and diseases is not always clear, for example obesity. According to the expert-based MeSH classification, obesity belongs to four different broad categories, namely ‘Nutritional and Metabolic Diseases’, ‘Diagnosis’, ‘Physiological Phenomena’ and ‘Pathological Conditions, Signs and Symptoms’. Considering its MeSH definition as ‘a status with body weight that is grossly above the acceptable or desirable weight, usually due to accumulation of excess fats in the body [...]’ it is apparent that a precise and unique classification into a single category is difficult and obesity may indeed be regarded as a disease, a symptom, a diagnosis and physiological phenomenon at the same time. Since the multihierarchical structure of MeSH explicitly allows for multiple categories for a single term, the data we generated can be used to explore both interpretations, for example, the relationships of obesity as a symptom or as a disease.
Acquisition of symptom and disease relationships.Each article listed in PubMed is associated to metadata that include a list of manually assigned keywords describing the major topics of the article. We developed a Java programme (Supplementary Fig. 4) utilizing the NCBI E-utility web services to acquire all PubMed identifiers whose keywords include any of the disease or symptom terms defined by MeSH (2011 ASCII version, see Supplementary Methods). Note that we do not use a full-text search of the articles or their abstracts, but only the manually curated metadata. The association between symptoms and diseases were then quantified using term co-occurrence (number of PubMed identifiers in which two terms appear together; see Supplementary Methods and Supplementary Fig. 5). Similar methods have been widely used as a reliable approach to identify asso-ciations between different medical entities59. Note that this pairwise term
co-occurrence does not take possible interactions between symptoms into account, but considers different symptoms of a given disease to be independent of each other. Prevalent combinations of symptoms can be extracted from the weighted symptom vectors described below. However, these combinations only account for positive interactions between symptoms. Cases, in which certain symptoms of the same disease are mutually exclusive, cannot be detected with this simple method.
Symptom-based diseases similarity.In the field of information retrieval, text documents or concepts are commonly represented by feature vectors60. Here, we describe every diseasejby a vector of symptomsdj
dj¼ w1;j;w2;j;:::;wn;j
; ð1Þ
wherewi,jquantifies the strength of the association between symptomiand disease j. The prevalence of the different symptoms and diseases is very different, for example, there are highly abundant symptoms like pain, and publication biases towards certain diseases like breast cancer. To account for this heterogeneity, we therefore do not use the absolute co-occurrenceWi,jto measure the strength of an association between symptomiand diseasej,but the term frequency-inverse document frequency60wi,j:
wi;j¼Wi;jlogN ni
ð2Þ
whereNdenotes the number of all diseases in the dataset andnithe number of diseases where symptomiappears. Since all symptoms in our data have at least one associated disease, the potential problem of dividing by zero does not arise.
A widely used measure in both text mining and the biomedical literature to quantify the similarity between two concepts is the cosine similarity of the respective vectors. The similarity between the vectorsdxanddyof two diseasesx andyis calculated as follows:
cosdx;dy
¼
P
idx;idy;i
ffiffiffiffiffiffiffiffiffiffiffiffiffiffi P
idx;i2
q ffiffiffiffiffiffiffiffiffiffiffiffiffiffi P
id2y;i
q ð3Þ
The cosine similarity ranges from 0 (no shared symptoms) to 1 (identical symptoms).
Filtering significant symptom–disease associations.The full HSDN is very dense with over 84% of all possible pairwise disease links being present. In addition to the absolute value of a pairwise symptom similarity, we therefore also deter-mined its statistical significance, for instance for a more accurate inference of phenotype–genotype associations. A widely used statistic to filter significant associations between medical entities from co-occurrence literature data is thew2 -test that compares observed frequencies with the frequencies expected for inde-pendence.A prioriwe do not know how many true associations to expect, even though it is reasonable to assume that many co-occurrences are indeed meaningful, given the manual curation process of the MeSH metadata. In order to
(see Supplementary Methods and Supplementary Fig. 3 for more details). Comparable to previously reported values, we find a threshold ofP-value¼0.13, indicating that there are indeed relatively many false null hypothesis, that is, true associations. For our subsequent analysis, we have nevertheless chosen to proceed with the more conservative and commonly used threshold ofP-value¼0.05. We provide the full dataset in order to enable the research community to adapt these choices to their particular needs, for example to employ stricter criteria for a more targeted investigation on few diseases of interest. In our case, we obtain 62,820 filtered significant connections between 3,973 diseases and 322 symptoms. The average number of diseases per symptom is about 196, some general symptoms like abnormal body weight and pain have more than 1,000 associated diseases
Shortest paths and single linkage between disease modules.Shortest paths are an important topological quantity for the analysis of social and biological net-works63, the most prominent example of its use is probably the well-known small-world property of many complex networks64. We use Dijkstra’s algorithm65to find all shortest paths in the PPI network. In order to quantify the PPI distance between disease pairs, we use the single linkage distanceDSL, that is, the minimum of all shortest paths between related proteins: For two diseasesxandywith the corresponding related protein setsPxandPy, the single linkage distance is given by
DSLðx;yÞ ¼ min pi2Px;pj2Py D pi;pj
ð4Þ
whereD(pi, pj) is the shortest path length between the two proteinspiandpj.
Disease diversity.In order to characterize the connectedness of a node within a network, we use betweenness66and node diversity67. Betweenness is a centrality measure quantifying how many shortest paths run through a given node and can be used, for example, to quantify the influence of individuals in social networks68.
The diversityfof nodejis based on the node bridging coefficient69and defined by
fðjÞ ¼ X
i2NðiÞ
dðiÞ
kðiÞ 1 ð5Þ
wherek(i)is the degree of nodei,N(i)denotes its neighbourhood, that is, the set of all its direct neighbours andd(i)is the total number of links leaving that neighbourhood. The diversityfis large for nodes with many neighbours that have many out-going links themselves.
For the disease diversity within the HSDN, both betweenness and node diversity can be measured directly for each disease. For the diversity of disease-related genes within the PPI, we use the maximum of all respective betweenness or node diversity values to represent the diversity of the disease in the PPI context. Furthermore, we normalized the diversity values of each disease by using thez -score before calculating the correlation between its two related diversity values.
References
1. Botstein, D. & Risch, N. Discovering genotypes underlying human phenotypes: past successes for mendelian disease, future approaches for complex disease.
Nat. Genet.33Suppl 228–237 (2003).
2. Vidal, M., Cusick, M. E. & Barabasi, A. L. Interactome networks and human disease.Cell144,986–998 (2011).
3. McKusick, V. A. The growth and development of human genetics as a clinical discipline.Am. J. Hum. Genet.27,261–273 (1975).
4. McKusick, V. A. On lumpers and splitters, or the nosology of genetic disease.
Perspect. Biol. Med.12,298–312 (1969).
5. Loscalzo, J., Kohane, I. & Barabasi, A. L. Human disease classification in the postgenomic era: a complex systems approach to human pathobiology.Mol. Syst. Biol.3,124 (2007).
6. Barabasi, A. L., Gulbahce, N. & Loscalzo, J. Network medicine: a network-based approach to human disease.Nat. Rev. Genet.12,56–68 (2011).
7. Wang, Q.et al.Community of protein complexes impacts disease association.
Eur. J. Hum. Genet.20,1162–1167 (2012).
8. Park, J., Lee, D. S., Christakis, N. A. & Barabasi, A. L. The impact of cellular networks on disease comorbidity.Mol. Syst. Biol.5,262 (2009).
9. Hidalgo, C. A., Blumm, N., Barabasi, A. L. & Christakis, N. A. A dynamic network approach for the study of human phenotypes.PLoS. Comput. Biol.5,
e1000353 (2009).
10. Lee, D. S.et al.The implications of human metabolic network topology for disease comorbidity.Proc. Natl Acad. Sci. USA105,9880–9885 (2008). 11. Brunner, H. G. & van Driel, M. A. From syndrome families to functional
genomics.Nat. Rev. Genet.5,545–551 (2004).
12. Rzhetsky, A., Wajngurt, D., Park, N. & Zheng, T. Probing genetic overlap among complex human phenotypes.Proc. Natl Acad. Sci. USA104,
11694–11699 (2007).
13. Goh, K. I.et al.The human disease network.Proc. Natl Acad. Sci. USA104,
8685–8690 (2007).
14. Giot, L.et al.A protein interaction map ofDrosophila melanogaster.Science 302,1727–1736 (2003).
15. Li, S.et al.A map of the interactome network of the metazoanC. elegans.
Science303,540–543 (2004).
16. Dudley, A. M., Janse, D. M., Tanay, A., Shamir, R. & Church, G. M. A global view of pleiotropy and phenotypically derived gene function in yeast.Mol. Syst. Biol.1,2005 0001 (2005).
17. Gavin, A. C.et al.Proteome survey reveals modularity of the yeast cell machinery.Nature440,631–636 (2006).
18. Freudenberg, J. & Propping, P. A similarity-based method for genome-wide prediction of disease-relevant human genes.Bioinformatics18(Suppl 2): S110–S115 (2002).
19. van Driel, M. A., Bruggeman, J., Vriend, G., Brunner, H. G. & Leunissen, J. A. A text-mining analysis of the human phenome.Eur. J. Hum. Genet.14,535–542 (2006).
20. Gandhi, T. K.et al.Analysis of the human protein interactome and comparison with yeast, worm and fly interaction datasets.Nat. Genet.38,285–293 (2006). 21. Wu, X., Jiang, R., Zhang, M. Q. & Li, S. Network-based global inference of
human disease genes.Mol. Syst. Biol.4,189 (2008).
22. Vanunu, O., Magger, O., Ruppin, E., Shlomi, T. & Sharan, R. Associating genes and protein complexes with disease via network propagation.PLoS. Comput. Biol.6,e1000641 (2010).
23. Wang, X., Gulbahce, N. & Yu, H. Network-based methods for human disease gene prediction.Brief. Funct. Genomics10,280–293 (2011).
24. Moreau, Y. & Tranchevent, L. C. Computational tools for prioritizing candidate genes: boosting disease gene discovery.Nat. Rev. Genet.13,523–536 (2012).
25. Robinson, P. N.et al.The Human Phenotype Ontology: a tool for annotating and analyzing human hereditary disease.Am. J. Hum. Genet.83,610–615 (2008).
26. Smith, C. L., Goldsmith, C. A. & Eppig, J. T. The Mammalian Phenotype Ontology as a tool for annotating, analyzing and comparing phenotypic information.Genome Biol.6,R7 (2005).
27. Doelken, S. C.et al.Phenotypic overlap in the contribution of individual genes to CNV pathogenicity revealed by cross-species computational analysis of single-gene mutations in humans, mice and zebrafish.Dis. Model. Mech.6,
358–372 (2013).
28. Robinson, P. N.et al.Improved exome prioritization of disease genes through cross-species phenotype comparison.Genome Res.24,340–348 (2014). 29. Little, R. A.et al.Plasma catecholamines in the acute phase of the response to
myocardial infarction.Arch. Emerg. Med.3,20–27 (1986).
30. Knottnerus, J. A. The effects of disease verification and referral on the relationship between symptoms and diseases.Med. Decis. Making7,139–148 (1987).
31. Lowe, H. J. & Barnett, G. O. Understanding and using the medical subject headings (MeSH) vocabulary to perform literature searches.JAMA271,
1103–1108 (1994).
32. Wheeler, D. L.et al.Database resources of the National Center for Biotechnology Information.Nucleic. Acids. Res.35,D5–D12 (2007). 33. Fisher, R. A. S. & Yates, F.Statistical Tables for Biological, Agricultural and
Medical Research2nd edn revised and enlarged (Oliver & Boyd, 1943). 34. The_Cancer_Genome_Atlas_Network. Comprehensive molecular
characterization of human colon and rectal cancer.Nature487,330–337 (2012).
35. Oti, M., Snel, B., Huynen, M. A. & Brunner, H. G. Predicting disease genes using protein-protein interactions.J. Med. Genet.43,691–698 (2006). 36. Warner, T. T. & Schapira, A. H. Genetic and environmental factors in the cause
of Parkinson’s disease.Ann. Neurol.53(Suppl 3): S16–S23 (2003).
37. Duty, S. & Jenner, P. Animal models of Parkinson’s disease: a source of novel treatments and clues to the cause of the disease.Br. J. Pharmacol.164,
1357–1391 (2011).
38. Sanchez-Betancourt, J.et al.Manganese mixture inhalation is a reliable Parkinson disease model in rats.Neurotoxicology33,1346–1355 (2012). 39. Vanduyn, N., Settivari, R., Wong, G. & Nass, R. SKN-1/Nrf2 inhibits dopamine
neuron degeneration in a Caenorhabditis elegans model of methylmercury toxicity.Toxicol. Sci.118,613–624 (2010).
40. Serrano, M. A., Boguna, M. & Vespignani, A. Extracting the multiscale backbone of complex weighted networks.Proc. Natl Acad. Sci. USA106,
6483–6488 (2009).
41. Grivennikov, S. I., Greten, F. R. & Karin, M. Immunity, inflammation, and cancer.Cell140,883–899 (2010).
42. Chapman, S. J. & Hill, A. V. Human genetic susceptibility to infectious disease.
Nat. Rev. Genet.13,175–188 (2012).
43. Loscalzo, J. & Barabasi, A. L. Systems biology and the future of medicine.Wiley interdisciplinary reviews.Syst. Biol. Med.3,619–627 (2011).
44. Molodecky, N. A.et al.Increasing incidence and prevalence of the inflammatory bowel diseases with time, based on systematic review.
Gastroenterology142,46–54 (2012).
46. Jostins, L.et al.Host-microbe interactions have shaped the genetic architecture of inflammatory bowel disease.Nature491,119–124 (2012).
47. Gulbahce, N.et al.Viral perturbations of host networks reflect disease etiology.
PLoS. Comput. Biol.8,e1002531 (2012).
48. Yildirim, M. A., Goh, K. I., Cusick, M. E., Barabasi, A. L. & Vidal, M. Drug-target network.Nat. Biotechnol.25,1119–1126 (2007).
49. Campillos, M., Kuhn, M., Gavin, A. C., Jensen, L. J. & Bork, P. Drug target identification using side-effect similarity.Science321,263–266 (2008). 50. Kuhn, M., Campillos, M., Letunic, I., Jensen, L. J. & Bork, P. A side effect
resource to capture phenotypic effects of drugs.Mol. Syst. Biol.6,343 (2010). 51. Imfeld, P., Bodmer, M., Schuerch, M., Jick, S. S. & Meier, C. R. Seizures in
patients with Alzheimer’s disease or vascular dementia: a population-based nested case-control analysis.Epilepsia54,700–707 (2013).
52. Sanchez, P. E.et al.Levetiracetam suppresses neuronal network dysfunction and reverses synaptic and cognitive deficits in an Alzheimer’s disease model.
Proc. Natl Acad. Sci. USA109,E2895–E2903 (2012).
53. Cote, R. A. & Robboy, S. Progress in medical information management. Systematized nomenclature of medicine (SNOMED).JAMA243,756–762 (1980).
54. Kohane, I. S. Using electronic health records to drive discovery in disease genomics.Nat. Rev. Genet.12,417–428 (2011).
55. Hripcsak, G. & Albers, D. J. Next-generation phenotyping of electronic health records.J. Am. Med. Inform. Assoc.20,117–121 (2013).
56. Jensen, P. B., Jensen, L. J. & Brunak, S. Mining electronic health records: towards better research applications and clinical care.Nat. Rev. Genet.13,
395–405 (2012).
57. Pathak, J., Kho, A. N. & Denny, J. C. Electronic health records-driven phenotyping: challenges, recent advances, and perspectives.J. Am. Med. Inform. Assoc.20,e206–e211 (2013).
58. Coletti, M. H. & Bleich, H. L. Medical subject headings used to search the biomedical literature.J. Am. Med. Inform. Assoc.8,317–323 (2001). 59. Jensen, L. J., Saric, J. & Bork, P. Literature mining for the biologist: from
information retrieval to biological discovery.Nat. Rev. Genet.7,119–129 (2006).
60. Salton, G., Wong, A. & Yang, C. S. A vector space model for automatic indexing.Commun. ACM18,613–620 (1975).
61. Cao, H., Hripcsak, G. & Markatou, M. A statistical methodology for analyzing co-occurrence data from a large sample.J. Biomed. Inform.40,343–352 (2007). 62. Schweder, T. & Spjotvoll, E. Plots of p-values to evaluate many tests
simultaneously.Biometrika69,493–502 (1982).
63. Girvan, M. & Newman, M. E. Community structure in social and biological networks.Proc. Natl Acad. Sci. USA99,7821–7826 (2002).
64. Watts, D. J. & Strogatz, S. H. Collective dynamics of ’small-world’ networks.
Nature393,440–442 (1998).
65. Cormen, T. H. & Cormen, T.H.I.t.a.Introduction to Algorithms(MIT Press, 2001).
66. Newman, M. E. J.Networks: an introduction(Oxford University Press, 2010). 67. Liu, Lu.et al.Mining Diversity on Networks.Database Systems for Advanced
Applications5981,384–398 (2010).
68. Freeman, L. C. A set of measures of centrality based on betweenness.
Sociometry40,35–41 (1977).
69. Hwang, W., Kim, T., Ramanathan, M. & Zhang, A. inProceedings of the 14th ACM SIGKDD Internat Conf on Knowledge Discovery and Data Mining,
336–344 (ACM, 2008).
Acknowledgements
We thank Baoyan Liu, Chaoming Song, Dashun Wang and Andrew Michaelson for useful discussions and suggestions, and especially Lili Xu, Guangli Song, Haixun Qi, Minghui Lv, Yiwei Wang, Xiaofeng Zhou and Hongwei Chu for the manual validation of the selected PubMed records. X.Z. was supported by the National Science Foundation of China (61105055, 81230086), National Basic Research Program of China
(2014CB542903), National Key Technology R&D Program (2013BAI02B01, 2013BAI13B04), National S&T Major Special Project (2012ZX09503-001-003) and Beijing Municipal S&T Program of China (Z131110002813118). This work was sup-ported by MapGen grant (1U01HL108630-01) and by the EC-FP7 Program, Synergy-COPD, GA no270086. Additional support was provided by HL066289 and HL105339 grants from the U.S. National Institutes of Health.
Author contributions
X.Z and A.-L.B. conceived and designed the experiments; X.Z. performed the experiments; X.Z., A.S. and J.M. analysed the data; X.Z.Z., A.S., J.M. and A.-L.B.wrote the paper.
Additional information
Supplementary Informationaccompanies this paper at http://www.nature.com/ naturecommunications
Competing financial interests:The authors declare that they do not have any competing financial interests.
Reprints and permissioninformation is available online at http://npg.nature.com/ reprintsandpermissions/