UTTAC-83, 2014
UTTAC
ANNUAL REPORT 2013
TANDEM ACCELERATOR COMPLEX
Research Facility Center for Science and Technology
University of Tsukuba
UTTAC
ANNUAL REPORT 2013
April 1, 2013 – March 31, 2014
Executive Editor: Eiji Kita
Editors: Hiromi Kimura, Tetsuaki Moriguchi, Daiichiro Sekiba and Kimikazu Sasa
UTTAC is a series of issues, which include annual reports of Tandem Accelerator Complex, Research Facility Center for Science and Technology, University of Tsukuba.
Copyright © 2014 by Tandem Accelerator Complex, Research Facility Center for Science and Technology, University of Tsukuba and individual contributors.
All reports are written on authors’ responsibility and thus the editors are not liable for the contents of the report.
Tandem Accelerator Complex, Research Facility Center for Science and Technology, University of Tsukuba
Tennodai 1-1-1, Tsukuba, Ibaraki 305-8577, Japan
http://www.tac.tsukuba.ac.jp/ [email protected]
PREFACE
This annual report covers research conducted at the Tandem Accelerator Complex,
Research Facility Center for Science and Technology, the University of Tsukuba, during fiscal
year 2013 (April 1, 2013–March 31, 2014). After the Great East Japan Earthquake on March 11,
2011, research has been limited to that using the 1 MV Tandetron accelerator and radiation
source experiments, 57Fe Mössbauer spectroscopy, and positron annihilation spectroscopy. The circumstances of our research have not changed much and are almost the same as those in the
last fiscal year. Thus, this volume has slightly fewer pages than older volumes like one for the
last year.
A new 6 MV tandem-type accelerator with support from the government has reached at
mid of March 2014 from the National Electrostatics Corporation in Middleton, Wisconsin, USA
to the TAC. We are hoping to restart our research activities again after the installation.
The efforts of Open Advanced Facilities Initiative supported by MEXT were continued in this
term, and the second stage was completed. The government supported additional facilities
related to this program with an extra budget. With this support, our performance on this
program is accelerated.
We are really looking forward to operating and reporting on the new 6 MV accelerator.
CONTENTS
1. ACCELERATOR AND FACILITIES
1.1 Accelerator operation 2013 ··· 1
1.2 Installation of the 6 MV tandem accelerator ··· 3
2. NUCLEAR PHYSICS
2.1 Reaction cross section of 45
Sc(p, α)42Ca for basis of silicon burning ··· 5
2.2 The experimental study of the astrophysical S-factor of 6
Li(p, γ)7Be reaction ··· 8
2.3 Development of a beam monitor detector using a mirror-electric field ··· 10
2.4 Test of rotating magnetic field system for β-NMR method ··· 12
3. MATERIAL SCIENCE
3.1 Effect of synthesis conditions on the magnetic properties for ferromagnetic iron oxide nanoparticles using Mössbauer spectroscopy ··· 15
3.2 Conversion electron Mössbauer spectroscopy (CEMS) of cobalt ferrite thin films grown
by sputtering using a 57Fe enriched target ··· 17
3.3 Magnetic states of ion implanted Fe3O4 thin films studied by Mössbauer spectroscopy ··· 19
3.4 Mössbauer study of CoxFe4-xN films grown by molecular beam epitaxy ··· 21
3.5 Cluster effect on the yield of secondary electrons produced by inner shell electron excitation··· 23
3.6 Limit of detection for hydrogen by developed high-resolusion ERDA system ··· 25
4. ACCELERATOR MASS SPECTROMETRY
4.1 Depth profiles of 129I and 129I / 127I ratio in soil at the near-field site of the Fukushima
Dai-ichi Nuclear Power Plant ··· 29
4.2 Study on monitoring of volcanic activity using 129I / 127I ratios in crater lake and hot spring at Zao volcano, Miyagi Prefecture ··· 31
4.3 Successive searches of 129I contamination in the chemical sample preparation room ··· 33
4.4 Comparison between 36Cl-AMS simulations using PHITS code and experiments ··· 35
5. LIST OF PUBLICATIONS
··· 396. THESES
··· 487. SEMINARS
··· 498. SYMPOSIUM
··· 501.
1.1
Accelerator operation 2013
K. Sasa, S. Ishii, H. Kimura, H. Oshima, Y. Tajima, T. Takahashi, Y. Yamato,
T. Komatsubara, D. Sekiba and E. Kita
We have operated and maintained the 1 MV Tandetron accelerator and the radio-isotope utilization
equipment in the University of Tsukuba, Tandem Accelerator Complex (UTTAC). In addition, we have
constructed the 6 MV tandem accelerator instead of the broken 12UD Pelletron tandem accelerator.
The total service time of the UTTAC multi-tandem accelerator facility was 2,064 hours in the fiscal
year 2013. The number of facility users is 106 on campus and 12 outside the campus. 648 hours for the 1
MV Tandetron accelerator and 14 days for the radio-isotope utilization equipment were used for industrial
users under the project "Promotion of Advanced R&D Facility Utilization", which was supported
financially by the Ministry of Education, Culture, Sports, Science and Technology (MEXT) of JAPAN. In
the project, a total of 12 research programs were conducted in 2013.
The 1 MV Tandetron accelerator
The operating time and the experimental beam time of the 1 MV Tandetron accelerator were 1357.1
and 798 hours, respectively, during the total service time in 2013. A total of 66 research programs were
carried out and a total of 725 researchers used the 1 MV Tandetron accelerator. Figure 1 shows the
percentage of accelerated ions for the 1 MV Tandetron accelerator. In 2013, H beams accounted for
79.2 % of ion acceleration. O beams were mainly used for high-resolution ERDA. Figure 2 shows the
1.2
Installation of the 6 MV tandem accelerator
K. Sasa, S. Ishii, H. Kimura, H. Oshima, Y. Tajima, T. Takahashi, Y. Yamato,
T. Komatsubara, D. Sekiba and E. Kita
A new tandem accelerator system has been designed and constructed at the University of Tsukuba
after the Great East Japan Earthquake [1, 2]. The accelerator system consists of the 6 MV Pelletron
tandem accelerator, four negative ion sources, a Lam-shift polarized ion source (PIS), a vertical irradiation
line and 12 beam lines. A high energy beam transport line connects from the accelerator room to present
experimental facilities at the experimental room. The 6 MV Pelletron tandem accelerator will be applied to
multi-purpose ion beam researches such as AMS, microbeam applications, PIXE analysis for geoscience
and material research, heavy ion RBS/ERDA, nuclear reaction analysis (NRA) for hydrogen in material,
high energy ion irradiation for semiconductor and nuclear physics. Figure 1 shows a most recent layout of
the 6 MV tandem accelerator system in the accelerator room.
Figure 1. Layout of the 6 MV tandem accelerator system in the accelerator room.
A high voltage test was already tried with a great deal of success at the National Electrostatics Corp.
(NEC), USA in January, 2014. The generator was operated up to the maximum terminal voltages as high
Figure 1. Photograph of setup for the high-voltage test at NEC, USA in January, 2014.
The main accelerator, the model 18SDH-2 Pelletron accelerator developed by NEC, USA was
installed at the University of Tsukuba on 6 March, 2014 (Figures 2 and 3). The accelerator tank was
designed as about 2.74 m in diameter and 10.5 m in length. The high voltage terminal has a longer gas
stripper tube assembly and a foil changer with 80 foil holders for electron stripping of negative ions. At
present, we have constructed ion sources and beam lines. The accelerator operation will start at the fiscal
year 2015.
References
[1] Kimikazu Sasa et al., AIP Conf. Proc. 1533, pp. 184-188; doi: http://dx.doi.org/10.1063/1.4806798. Figure 2. The accelerator tank was delivered to
Tsukuba on 6 March 2014.
2.
2.1
Reaction cross section of
45Sc(p,
α
)
42Ca for basis of silicon burning
T. Komatsubara1, T. Onishi, M. Mukai, D. Izumi, Y. Saito, N. Inaba, K. Sawahata, T. Hayakawa2, T. Shizuma2, H. Yamaguchi3, S. Kubono4, D. Nagae, K. Sasa and A. Ozawa
Silicon burning is a sequence of reactions which create from silicon to iron at the final stage of the
evolution of stars. When temperature of stars rise up to be 3 ~ 5 GT by gravitational compression, nuclei
of silicon are starting to be decomposed by thermal photodisintegration and to be protons, neutrons, and
α particles. The emitted α particles can fuse with the silicon or heavier nuclei and the continuous fusion chain reaction can reach to create the iron[1]. Among those of (α, γ) and (p, γ) reactions, the flow of
reactions is predicted to be concentrated on 45Sc, which are 42Ca(α, p)45Sc and 45Sc(p, γ)46Ti reactions[2]. Then we have chosen the reversed reaction of 45Sc(p, α)42Ca to evaluate the forward reaction rate, because experimental information of the lower energy part of the reaction cross sections was quite limited [3].
Experimental study was carried out by using the 1 MV Tandetron accelerator at UTTAC. Proton beam
having the energy of 1.8 ~ 2.1 MeV was irradiated on the scandium target. The target was 40 µg/cm2 in thickness made with evaporation of metallic scandium on a 53 µg/cm2 carbon foil. Since Q-value of the
45
Sc(p, α)42Ca reaction is rather large to be 2.34 MeV the emitted α particles can be determined with E-∆E
counter telescope consisted of two Si detectors.
Thickness of the detectors are 10 µm for the ∆E
counter and 1500 µm for the E counter, respectively.
The thick E detector is necessary to have full stop
proton peak. The detector was located at 49.5 mm
(39.5 mm for the additional measurement) having the
window of φ 7.0 mm diameter.
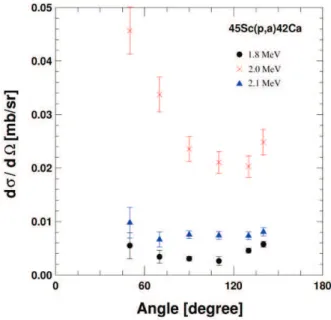
The measured angular distributions of the emitted α
particle are shown in Fig. 1 for the proton beam
energies of 1.8, 2.0, and 2.1 MeV. The distributions
show rather flat, so that the distribution is assumed to
be isotropic for other bombarding energies.
Calculated astrophysical S-factor S(E) from the
measured cross sections for the 45Sc(p, α)42Ca reaction are shown in Fig. 2 comparing with the previous study
by Schweitzer[3]. Reported data for the 42Ca(α, p)45Sc
reaction[4] are also consistent within the detailed balance[1] (not shown in this figure). A result of fitting
with multilevel R-Matrix theory SAMMY[5] is also shown by the dashed lines. Parameters used for the
fitting is tabulated in Table 1. With this fitting, the two peaks can be assigned as narrow resonances having
spins of 1- and 0+ as shown in Fig. 2. In the previous report[6], a 0+ state was reported at 12.46 MeV with
44
Ca(3He, n)46Ti reaction, which can be plausible state corresponding to our observed level at 12.31 MeV.
Since Gamow window can be estimated between 1.8 and 2.4 MeV for the silicon burning, the existence
of the newly observed resonance at 2 MeV can significantly increase the reaction rate. Further continuous
investigations are desirable to explore the astrophysical reaction rate for the silicon burning.
References
[1] C.E. Rolfs and W.S. Rodney, “Cauldrons in the Cosmos”, The University of Chicago Press, 1988.
[2] S.E. Woosley et al., Astrophys J.S. 26 (1973) 231.
[3] J.S. Schweitzer et al., Nucl. Phys. A287 (1977) 344.
[4] L.W. Mitchell et al., Nucl. Phys. A443 (1985) 487.
[5] SAMMY-8, Radiation Safety Information Computational Center (RSICC), Oak Ridge National
Laboratory.
[6] “Table of Isotopes, CD ROM Edition”, R.B. Firestone and V.S. Shirley editor, (1996), LBL,
Wiley-Interscience.
Fig. 2. Astrophysical S-factor for the 45Sc(p, α)42Ca reaction. Present results are shown by closed circles. Previous work done by Schweitzer[3] are shown by open
Table 1. Parameters used for the SAMMY R-matrix fit[5] for the 45Sc(p, α)42Ca reaction as shown in the Fig. 2 with the dashed lines. In this fitting, two narrow resonances are obvious shown as peak1 and peak2
in the figure. The Ex denotes the excitation energy of compound nucleus 46
Ti. For the calculation of the
energy Ex, a Q value of 10.345 MeV is used for the 45
Sc(p, γ)46Ti reaction.
Elab [MeV] Ecm [MeV] Jπ Γp [keV] Γα [keV] Ex [MeV]
Peak 1 1.731 1.693 1- 3.6 ± 0.7 1.5 ± 0.1 12.03
2.2
The experimental study of the astrophysical S-factor of
6Li(p,
γ
)
7Be reaction
S.Z. Chen1, J.J He1, T. Komatsubara, S.B. Ma1, S. Kubono2, K. Sasa, A. Ozawa, A. Yamazaki, T. Onishi, M. Mukai, D. Izumi, H. Miyatake3, D. Sekiba, T. Hayakawa4, T. Shizuma4, D. Kahl5, C. Moon6 and T. Kajino7
In the low-temperature astrophysics sites, e.g., our Sun, the Red Giant stars and the nova, the Gamow
windows are well below the Coulomb barriers for the charged- particle-induced nuclear reactions involved.
These nuclear reactions occur through the quantum-mechanics barrier penetration, sometimes referred to
as the tunneling effect, with a small but finite probability. Because of the exponential behavior of the
probability for tunneling, the reaction cross-section drops rapidly for energies below the Coulomb barrier.
Frequently, the reaction cross-section is expressed as[1]:
(1)
The quantity ηis called the Sommerfeld parameter and is defined as
(2)
In Eq. (1), the function S(E), containing all the strictly nuclear effects, is referred to as the astrophysical
S-factor [1]. In contrast to cross-section, the S-factor is a smoothly varying function of energy for the
non-resonant reactions. With these characteristics, the factor S(E) is much more useful in extrapolating
measured cross-sections at higher energies to Gamow energies.
6
Li(p, γ)7Be reaction and its reverse reaction are closely related to the big bang nucleosynthesis (BBN). It
is worthwhile to determine the low-energy S-factors of 6Li(p, γ)7Be reaction. The measurement of this reaction has been done on 320 kV high voltage platform in Lanzhou and found an interesting sizable drop
contrary to any existing theoretical expectations at energies below 200 keV [2]. Limited by the energy of
320 kV platform, we cannot cover the interesting energy region of 0.3~1 MeV to compare our data with
previous results. It’s necessary to investigate this reaction on a wider energy region accelerator.
A new measurement has been done on the 1 MeV Tandetron accelerator in the University of Tsukuba. The
experimental setup is similar to the one described in Ref. [2]. The proton beam passed through 2
collimators (each10 mm in diameter) and was focused on the target. The two collimators were located 50
and 100 cm up stream of the target. The solid targets were prepared from 6Li2O material evaporated onto a
0.2 mm thick Ta backing, with a thickness of 36 μg/cm2. A high efficiency HPGe detector (GEM140P4-ST) was placed in close geometry at zero degree with respect to the beam direction. An
From equation (1), we can give out the relationship between different energy points of E1, E2:
(3)
Here, N1, N2 are the counts of clover detector at different energy points, Q1, Q2 are the beam integrations
of different energy points. Using this formula, we
normalized our new experimental data at Ec.m. = 206
keV, which was given in Ref. [2]. The preliminary
result was shown in Fig.1. From plot we can see that
our new data can consist with the previous result in
large energy region. The little deviation at high
energy point is due to the anisotropic angle
distribution of γ-rays. A deeper analysis is still in
process. More results will be reported in the future.
References
[1] C. Rolfs, W. Rodney. Cauldrons in the Cosmos. The University of Chicago Press, 1988.
[2] J.J. He, et al. Phys. Lett. B 725 (2013) 287.
1
Institute of Modern Physics, Lanzhou, Gansu, China
2
RIKEN Nishina Center, Hirosawa 2-1, Wako, Saitama 351-0198, Japan
3
High Enegry Accelerator Reseach Oganiation (KEK), Oho 1-1, Tsukuba, Ibaraki 305-0801, Japan
4
Japan Atomic Energy Agency, Shirakata Shirane 2-4, Tokai, Ibaraki 319-1106, Japan
5
Center for Nuclear Study, University of Tokyo, Hirosawa 2-1, Wako, Saitama 351-0198, Japan
6
Hoseo University, Chung-Nam 336-795, Korea
7
Division of Theoretical Astronomy, National Astronomical Observatory of Japan, Osawa, Mitaka, Tokyo 181-8588, Japan
2.3
Development of a beam monitor detector using a mirror-electric field
D. Nagae, Y. Abe, S. Okada, K. Sawahata, Y. Saito, N. Inaba and A. Ozawa
The precision mass measurement system of rare RI is proposed at RIKEN RI beam factory [1]. In
this plan, the mass is deduced from a time-of-flight of RIs in the ring. Details for the principle of the
mass measurement are described elsewhere [2]. In order to monitor a motion of the stored rare RI in
the ring, a dedicated detector has been developing. Required specifications and performances for the
monitor detector are i) the effective area is consisted by thin material and have a large size match a beam
size, ii) separation of the each revolution, and iii) position resolution less than 10 mm. To satisfy such
the requirements, a beam monitor detector consisting of thin and large carbon foil, Micro Channel Plate
(MCP) and using a electrostatic-mirror field has been developing. The principle of the monitor detector is
that a beam generates secondary electrons in passing through a thin carbon foil. The secondary electrons
are accelerated by an acceleration-electric field (Eacc) which is produced by a potential of carbon foil
(Vfoil) and that of acceleration grid (Vacc). Electrons are directed to the mirror-electric field comprising two
parallel grids placed at 45 degree to the ion trajectory. Then they are deflected at 90 degree toward the
MCP by a electrostatic mirror field (Emir) which is produced by two parallel grids. The electrostatic-mirror
field is express asEmir=Vout−Vin, whereVoutandVindenote a potential for outside grid of parallel grid
and that for inside grid of parallel grid. The potential of inside grid is same as that for acceleration grid
(Vacc). These grids are made of Au + W wires with a diameter of 40µm and a pitch distance of 1 mm for
the acceleration grid and that of 3 mm for the two parallel grids. A schematic view of the monitor detector
is shown in Fig. 1. The size and thickness of the carbon foil is 100 mm×50 mm and 60µg/cm2.
Ion Beam
Parallel grid
(Vin,Vout)
Acceleration grid
(Vacc)
Carbon-Foil (60 µg/cm2)
(Vfoil)
MCP
e-Fig. 1. Schematic layout of the monitor detector
An experiment to evaluate a performance of the detector was performed at SB2 beam line [3] in
HIMAC. The experimental setup is shown in Fig. 2. 84Kr beam (∼ 170 MeV) was transported to the
detector. In order to investigate the time resolution, a Time-Of-Flight(TOF) between a trigger detector and
the monitor detector was measured. As the trigger detector, 1-mm-thick plastic scintillator of which both
SB2 Beam-window Al 0.1 mm
84Kr beam
Trigger detector
PPAC
Monitor detector
NaI detector
Fig. 2. Schematic layout of the monitor detector
were used to measure the position distribution of the beam and to obtain the beam profile at the carbon
foil by a ray-trace technique.
In this measurement, the potentials were set asVfoil=−3250 V,Vacc=Vin=−2500 V, andVout=
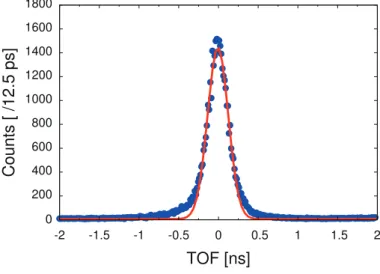
−4000 V so as to the TOF spectrum was narrow. A typical TOF spectrum is shown in Fig. 3. The time
resolution is obtained by fitting the TOF spectrum with a Gaussian function. The obtained width of the
peak includes the intrinsic time resolution of the trigger detector, which isσ= 50 ps. By subtracting the
contribution of the trigger detector, preliminary intrinsic time resolution was deduced asσ≈130 ps. The
obtained detection efficiency is about 70%.
0 200 400 600 800 1000 1200 1400 1600 1800
-2 -1.5 -1 -0.5 0 0.5 1 1.5 2
Counts [ /12.5 ps]
TOF [ns]
Fig. 3. TOF spectrum
References
[1] Y. Yano., Nucl. Instr. and Meth.,B261, 1009(2007).
[2] Y. Yamaguchi et al., Nucl. Instr. and Meth.,B266, 4575(2008).
2.4
Test of rotating magnetic field system for
β
-NMR method
D. Nagae, Y. Ishibashi, N. Inaba, S. Okada, K. Sawahata, Y. Abe and A. Ozawa
A rotating magnetic field system has been developing [1, 2] to determine a sign of magnetic (µ)
moment by the β-ray detected nuclear magnetic resonance (β-NMR) method [3]. Using the rotating
magnetic field system, a measurement of the sign of the µ moment for proton has been conducted by a
π/2 pulse NMR method and successfully confirmed the sign of theµ moment for proton [4].
In the present work a performance of the system was studied with spin-polarized20F (I =2+,T1/2=
11.163 s,µ(20F) = +2.09335(9)µ
N) nuclei at the Research Center for Nuclear Physics, Osaka University.
A spin-polarized20F was produced via nuclear-polarization transfer reaction with spin-polarized deuteron
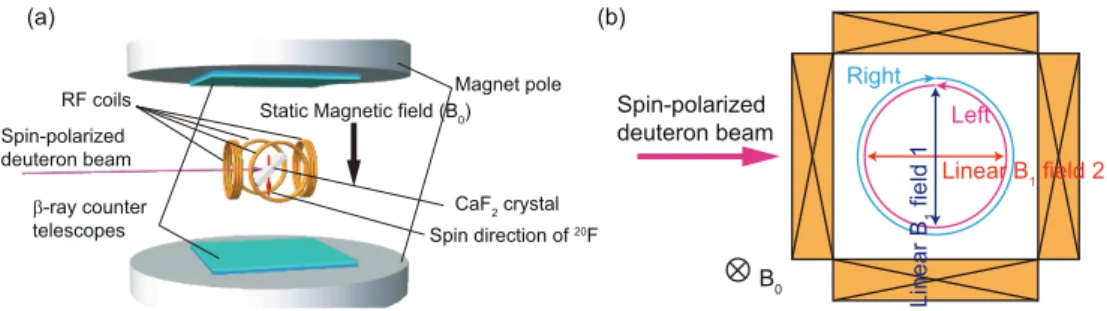
beam atE=10 MeV on a 0.5-mm-thickness CaF2crystal. The CaF2crystal was mounted at a center of
theβ-NMR apparatus (see Fig. 1 (a)). A static magnetic fieldB0=290 mT was applied to the crystal.
The β rays emitted from 20F nuclei were detected with scintillator telescopes located above and below
the crystal. The up/down ratioRof theβ-ray counts is written asR0=a(1+v/c·AβP)/(1−v/c·AβP),
where a denotes a constant factor representing asymmetries in counter solid angles and efficiencies, v
andc are the velocity of theβ particle and light. Aβ andPdenote the β-ray asymmetry factor and spin
polarization. A rotating magnetic field perpendicular to the static field is applied to20F by using the two
pairs of coils. If the frequency and the direction of the rotating magnetic field corresponds to the resonance
one, the direction of the spin polarization is changed fromPto−Pby the NMR. Thus the up/down ratio
is changed asR=a(1−v/c·AβP)/(1+v/c·AβP). When the polarization is altered due to the resonant
spin change, a change appears in a ratioR0/R. Theβ-ray asymmetryAβPis obtained as,
AβP=
√
(R0/R)−1
√
(R0/R) +1
, (1)
here, we took an approximation that v/c ≃1, since only a high-energy portion of the β particle was
included in the analysis. The deuteron beam was pulsed with beam-on and -off periods of 16 and 22.02 s,
respectively. In the beam-off period of a beam cycle, the RF magnetic fieldB1 was applied for the first
10 ms duration. Then, theβ rays were counted for 22 s, and in the last 10 ms of the beam-off period the
B1field was applied again to restore the spin direction. At first we measured theR0withoutB1 field and
then measured theRwith theB1field. This cycle were repeated until the sufficient measurement statistics
were attained.
Figure 2 shows the measured AβPvalues for20F with the linearB1 field 1, and 2, ,a right-circularly
rotatingB1 field, and a left-circularly rotating B1 field. A definition of the RF magnetic field is shown
in Fig. 1 (b). The linearB1fields can be regarded as superpositions of right- and left-circularly rotating
magnetic fields. Thus, the spin reversal is occurred when the frequency of theB1field is correspond to the
resonant one. The frequency of theseB1fields were swept from 2047.5 kHz to 2152.5 kHz during 10 ms.
TheAβPvalues of the linearB1fields are indicated the occurrence of the spin reversal. Considering the
obtainedAβPvalues, the asymmetry parameter of20F (Aβ =−1/3), and the direction ofB0(from up to
Magnet pole Static Magnetic field (B0)
RF coils
β-ray counter telescopes Spin-polarized deuteron beam
Spin direction of 20F
CaF2 crystal
Spin-polarized deuteron beam
B0
(a) (b)
Linear B1 field 2
Linear B
1
field 1
Right
Left
Fig. 1. (a) Schematic layout of theβ-NMR apparatus, (b) Definition of RF magnetic fields
value with the left-circularly rotatingB1 field is clearly deviated from 0, while the value with the
right-circularly rotatingB1field is small. These results indicate that the sign of theµ(20F)moment is positive.
The obtained sign derived from this analysis is in agreement with the reported one [5].
In the present work, spin polarizations Pof41Sc were measured. The spin-polarized41Sc was
pro-duced in a40Ca(d⃗,n)41Sc at⃗ Ed⃗=20 MeV. For the reaction target, two CaO pellets made from CaO powder,
and from a CaCO3 powder were used. The obtainedPs and previous result [6] are shown in Fig. 3. In
the previous measurement, a CaO pellet made from CaO powder was used and the energy of the
spin-polarized deuteron beam was set atEd⃗=7 MeV. While the polarizations of present work were maintained
both CaO pellets, the values were extremely small compared with the previous value. These result suggest
the spin-polarization is well transferred in a low energy reaction.
-0.1 0.0 0.1 0.2 0.3 0.4 Aβ P [%] Linear RF field 1 Right -circularly Left -circularly Linear RF field 2
Fig. 2. ObtainedAβPvalue of20F
0.0 0.5 1.0 1.5 2.0 2.5 3.0 3.5 P [%]
Previous work CaCO3 CaO
Fig. 3. Spin polarizations of41Sc
References
[1] T. Niwa et al., UTTAC annual report 2011, UTTAC-81, 5 (2012).
[2] D. Nagae et al., Hype. Int.,220, 65 (2013).
[3] K. Sugimoto et al., J. Phys. Soc. Jpn.21, 213 (1966).
[4] D. Nagae et al., UTTAC annual report 2012, UTTAC-82, 7 (2013).
3.
3.1 Effect of synthesis conditions on magnetic properties of ferromagnetic
iron oxide nanoparticles using Mössbauer spectroscopy
Akari Horiuchi, M. Kishimoto, H. Yanagihara and E. Kita
Modification of the physical properties of nanoparticles is greatly affected by shape, and thus
controlling nanoparticle shape is an important issue. Shape especially influences the magnetic anisotropy.
We have developed oval-shaped nano-platelets composed of ferromagnetic iron oxides smaller than 50 nm
in size. The effect of reaction temperature on magnetic properties during dehydration is reported.
Ferromagnetic iron oxide nanoparticles were prepared as follows: first, α-FeOOH nano-platelets, used as precursor materials, were synthesized through precipitation and a hydrothermal treatment.
Tetra-ethylene glycol (TEG) was used as a polyhydric alcohol for reducing the α-FeOOH nano-platelets. A dispersion of α-FeOOH nanoparticles and TEG was heated to several predetermined temperatures. We labeled the various nanoparticle samples as GTe260 through GTe300, corresponding to reaction
temperatures between 260 and 300 °C. Magnetizations of dry powdered samples were measured using a
vibration sample magnetometer (VSM). Crystal structures of the samples were obtained using X-ray
diffraction (XRD). Mössbauer spectra for GTe290 were recorded at 4.2 K, 77 K, and room temperature.
These spectra were numerically analyzed using fitting software (MössWinn 4.0).
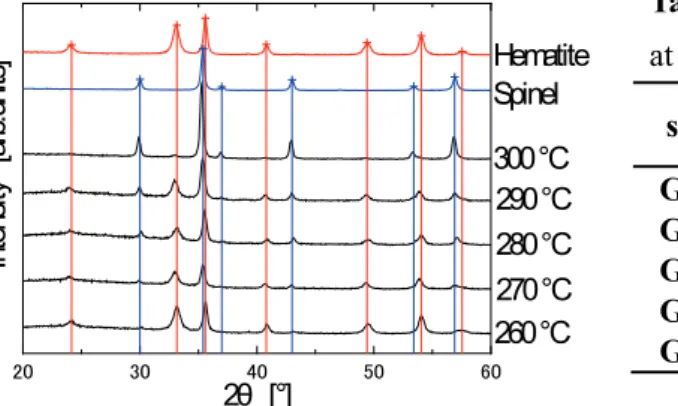
Figure 1 shows the XRD patterns of samples obtained by heating α-FeOOH to various temperatures in the 260–300 °C range. Diffraction peak intensity corresponding to the spinel structure
increased with increased reaction temperature. However, the peak originating from α-Fe2O3 became very
faint in XRD patterns of GTe300.
Figure 2 shows the Mössbauer spectra of GTe290 recorded at 4.2 K, 77 K, and 295 K. The solid
lines indicate the fitted results, which are summarized in Table 2. Three ferromagnetic sextets and a
doublet with negligible area ratio (5.8%) reasonably fit the spectrum recorded at 295 K. The sub-spectrum
with the highest hyperfine field (Hhf) value, 506 kOe, was attributed to the Fe 3+
ions corresponding to
α-Fe2O3. The sub-spectra with the second largest, 489 kOe, and smallest, 454 kOe, Hhf values were
assigned to the Fe3+ ion in the A lattice and the Fe2.5+ ion in the B lattice of Fe3O4, respectively.
Although GTe290 was characterized as a mixture of Fe3O4 and α-Fe2O3 nanoparticles, there
remained a possibility that γ-Fe2O3 particles were partially mixed in as well. In order to confirm that
GTe290 was a mixture of only Fe3O4 and α-Fe2O3, measurement was carried out at low temperature. Three
ferromagnetic sextets fit the spectrum recorded at 4.2 K. The sub-spectrum with the highest Hhf, about 532
kOe, was attributed to the Fe3+ ions corresponding to α-Fe2O3. Those with the second largest, 510 kOe,
and smallest, 467 kOe, Hhf were respectively assigned to the Fe 3+
ion in the B lattice and the Fe2+ ion in the B lattice of Fe3O4, an inverse spinel structure with a cubic cell. Therefore, spinel-structured iron oxide
obtained by heating α-FeOOH particle dispersions in TEG was identified as Fe3O4.
81.4 emu·g−1 as the reaction temperature increased.
Table 1. Magnetic properties of samples synthesized at different temperatures.
sample T [℃]
Ms [emu·g−1
]
Hc [Oe] S
GTe260 260 6.87 145 0.26
GTe270 270 17.1 133 0.22
GTe280 280 28.8 146 0.23
GTe290 290 54.1 153 0.26
GTe300 300 81.4 150 0.33
Table 2. Mössbauer fitting parameters.
Hhf [kOe]
IS
[mm·s−1]
QS
[mm·s−1]
Area
ratio [%] Ion
Crystal structure
295
F1 506 0.361 -0.174 21.8 Fe3+ α-Fe2O3
F2 489 0.349 -0.093 38.3 Fe3+(A) Fe3O4
F3 454 0.621 0.027 34.2 Fe2.5+(B) Fe3O4
D 0.504 2.052 5.80
77
528 0.472 -0.187 43.7 Fe3+ α-Fe2O3
476 0.756 -0.143 20.7 Fe2+(B)
507 0.415 -0.037 35.6
4.2
532 0.485 -0.174 45.5 Fe3+ α-Fe2O3
510 0.438 -0.046 43.5 Fe3+(B) Fe3O4
467 0.936 -0.291 11.0 Fe2+(B) Fe3O4
20 30 40 50 60
Hematite Spinel
300 ℃ 290 ℃ 280 ℃ 270 ℃ 260 ℃
In te ns ity [ ar b. un its ]
2θ [°]
-12 -8 -4 0 4 8 12
4.2 K
77 K
295K
C
ount
s [
ar
b.
uni
ts
]
Velocity [mm/s]
Figure 2. Mössbauer spectra of a sample synthesized at 290 °C.
3.2
Conversion electron Mössbauer spectroscopy (CEMS) of cobalt ferrite
thin films grown by sputtering using a
57Fe enriched target
R. Aoyama, H. Yanagihara, Ko Mibu and E. Kita
High perpendicular magnetic anisotropy (PMA) materials have attracted attention because of their
potential use in magnetic recording media and other practical applications. In addition to high PMA,
materials that do not contain Pt, a rare metal, are ideal for the future uses to avoid resource issues such as
scarcity. The magnetization and PMA of cobalt ferrite thin films, which are high PMA materials, change
with composition and production conditions. As such, cobalt ferrite thin films are the subject of our study,
and we have reported changes in their magnetization and PMA by changing their composition and
production conditions [1].
In order to clarify the mechanism of anisotropy in cobalt ferrite thin films, the electronic and
magnetic states should be studied using Mössbauer spectroscopy. However, it is not possible to detect
these electronic and magnetic states via transmission through the sample in thin films grown on thick
substrates. Conversion electron Mössbauer spectroscopy (CEMS) can be used on such samples because
the electrons emitted back from the surface are detected. However, it takes a long time to gather CEMS
results from samples thinner than 100 nm because of the insufficient amount of 57Fe nuclei in cobalt ferrite thin films. 57Fe enrichment is a well-known technique to decrease measurement time, but 57Fe enriched RF sputtering targets are expensive to produce. To solve this problem, we prepared a locally enriched 57Fe target.
Figure 1 shows the schematic illustration of the locally 57Fe enriched target system. The system was composed of a 1 mm thick doughnut shaped 57Fe enriched disk, covering the erosion part of sputtering, and a natural Fe base plate. Cost was reduced by shrinking the area of the enriched disk and lowering the
quantity of 57Fe used to 25% of the disk material. Cobalt ferrite thin films for CEMS were grown on a MgO(001) single crystal substrate by co-sputtering using a locally enriched 57Fe target and Co target. The O2 flow rate was set to 7 sccm and the substrate temperature was fixed at 300 ºC during sputtering.
enriched target compared to 2.3% in natural Fe. Data collected for 16 hours is shown in Figure 2, and the
spectrum has a distinct enough signal to noise ratio for detailed discussion. The enriched 57Fe combination target enabled us to shorten measuring time drastically and will be a powerful tool in analyzing the
magnetic state of Fe based thin films.
The spectrum was fit to a combination of three ferromagnetic sub-spectra, and the fitting parameters,
hyperfine field (H
hf), isomer shift (IS) and quadrupole split (Q.S.) are listed in Table I. The spectrum was
fairly symmetric and the isomer shifts were 0.3–0.4 mm/s and were fairly similar to those of trivalent Fe
ions. It was supposed that about 15% (= 0.35/2.35) of Fe atoms should be in the divalent state, however, it
is not clearly seen in the spectrum. This suggested that the film was well oxidized and the number of
divalent Fe atoms was small. Sites with small hyperfine fields (site 1) may be attributed to the surface Fe
atoms.
Table I. Mössbauer fitting parameters for a Co0.65Fe2.35O4 thin film
Sub-spectrum Hhf (kOe) IS (mm·s− 1
) Q.S. (mm·s−1) Area (%) Ion (site)
F1 426.0 0.307 0.020 23.51 Fe
3+
(?)
F2 458.5 0.305 0.024 54.60 Fe
3+
(B)
F3 482.8 0.365 -0.019 21.89 Fe
3+
(A)
References
[1] T. Niizeki, Y. Utsumi, R. Aoyama, H. Yanagihara, J. Inoue, Y. Yamasaki, H. Nakao, K. Koike, and Eiji
Kita, Appl. Phys. Lett., 103, 162407 (2013). 104, 059902 (2014) [erratum].
3.3
Magnetic states of ion implanted Fe
3O
4thin films studied by Mössbauer
spectroscopy
Eiji Kita, K.Z. Suzuki, Yang Liu, Y. Utsumi, J. Morishita. T. Niizeki, K. Mibu and H. Yanagihara
Oxide ferro-/ferrimagnetic materials have been investigated for many years and have tremendous
potential for use in various applications such as high-density recording media and spintronic devices.
Recently, we fabricated spinel-type oxide thin films using RF sputtering and found strong perpendicular
magnetic anisotropy energy on the order of 10 Mergs/cm3 in Co ferrite thin films grown on MgO(001) substrates [1]. These materials have potential as magnetic recording media, and one practical application is
the use of nanoscale patterning in high-density recording media. Bit-patterned media (BPM) have emerged
as the dominant candidate for developing ultra-high density hard disk systems [2]. Recently,
as the first
step toward pattern formation of spinel type ferromagnetic oxides, we investigated the
effectiveness of controlling the magnetism of a typical spinel ferromagnetic oxide, Fe
3O
4, via
N2and
Kr ion implantation
[3,4]. Mössbauer study on the effect of Kr irradiation on Fe3O4 thin films isreported.
Ferrite thin films were prepared using reactive sputtering, introducing O2 gas into Ar base gas
during film growth in an RF planner magnetron sputtering apparatus [5]. An Ar gas flow of 30 sccm was
introduced, and the O2 flow was controlled at 0.5 sccm. Cleaved MgO(001) single crystals were used as
substrates. Sputter deposition was performed at the substrate temperature of 300 °C and 13-nm-thick thin
films were obtained for magnetization measurements. For Mössbauer studies, thin films with a thickness
of 13 nm were fabricated in the same manner as other samples by using the 57Fe enriched Fe3O4 target
system [6]. The Fe3O4 films were covered with a carbon layer of around 10 nm prior to ion irradiation. Kr
ions were accelerated by a conventional ion implantation system. The acceleration voltages (Vacc) was set
to 30 kV, and the dosages of ions were controlled from 1 × 10¹⁴ to 6 × 10¹⁵ ions/cm2. The Mössbauer study was carried out using standard conversion electron Mössbauer spectroscopy.
Fig. 1. Dependence of saturation magnetization,
Ms, on Kr ion implantation, for three Fe3O4
sputtered thin films. Solid circles and open circles
show the magnetization for the samples with C
coated and without C coated layer, respectively.
Closed squares show the magnetization of the
The Mössbauer spectra of the Fe3O4 thin films with Kr-irradiation treatments of (b) 2 × 10 15
ions/cm2 and (c) 4 × 10¹⁵ are in Fig. 2. Magnetization levels of 200 and 0 emu/cm3 were achieved for samples (b) and (c), respectively. The spectrum of the low-irradiation sample in (b) was fitted to the
combination of a weak broad magnetic sextet, a non-magnetic doublet, and a non-magnetic singlet. The
spectrum for a 50 nm thick Fe3O4 film without irradiation is plotted as a reference in Fig. 2 (a) and was
fitted to the combination of two magnetic subspectra with bulk parameters. The ferromagnetic component
has a hyperfine field of 445 kOe and an isomer shift of 0.50 mm/s which are almost comparable to those
of Fe3+ ions and wide line widths. The area ratio of a ferromagnetic component is roughly estimated to be 23%, and this agrees qualitatively with the value of saturation magnetization.
A further increase in irradiation ions resulted in the disappearance of the ferromagnetic component
of (b), and the paramagnetic components can be fitted by using the same parameters as those for sample
(b). There are no intermediate subspectra with smaller hyperfine fields than those shown in the spectra of
(b). Our results imply two-phase separation and absence of any intermediate phase in the irradiated sample,
thereby suggesting that the transition of Fe3O4 from ferromagnetic to paramagnetic phases occurred
sharply due to Kr ion irradiation.
References
[1] T. Niizeki, et al.,, Appl. Phys. Lett., 103, 162407 (2013). 104, 059902 (2014) [erratum].
[2] B. D. Terris and T. Thomson, J. Phys. D: Appl. Phys., 38, R199 (2005).
[3] Eiji Kita, et al., Jpn. J. Appl. Phys. 53 (2014) 020306.
[4] Eiji Kita, et al., J. Appl. Phys., 115 (2014) 17B907.
[5] H. Yanagihara, et al., J. Phys. D: Appl. Phys. 46, 175004 (2013). 47, 129501 (2014) [erratum].
[6] R. Aoyama, H. Yanagihara, K. Mibu and E. Kita, UTTAC Annual report 2013.
3.4
Mössbauer study of Co
xFe
4−xN films grown by molecular beam epitaxy
K. Ito, T. Sanai, Y. Yasutomi, E. Kita and T. Suemasu
CoxFe4−xN are promising ferromagnetic materials for
application to spintronics devices due to their large
spin-polarization of density of states at the Fermi level
(PD) [1-3]. Co3FeN is expected to have larger |PD| of 0.75
(PD < 0) than that of Fe4N when Fe atoms are located at
the corner (I) sites, and Co atoms at the face-centered (II)
sites in the anti-perovskite unit cell (Fig. 1). X-ray
magnetic circular dichroism (XMCD) measurements
were performed on the epitaxial Co3FeN film, and
deduced spin magnetic moments of Fe and Co atoms in the Co3FeN film were very close to those reported
in Fe4N and Co4N, respectively [4]. It was suggested that Fe and Co atoms in the Co3FeN film were
located at both I and II sites. In this study, we evaluated the atomic sites of Fe atoms in epitaxial Fe4N,
CoFe3N, and Co3FeN films using conversion electron Mössbauer Spectroscopy (CEMS).
We performed CEMS measurements at room temperature for 19-nm-thick Fe4N (sample A),
25-nm-thick CoFe3N (sample B), and 74-nm-thick Co3FeN (sample C) films grown on SrTiO3(001)
substrates by molecular beam epitaxy, supplying 57Fe enriched (20%) solid iron and radio-frequency nitrogen plasma, simultaneously at 450 ºC. The velocity and isomer shift were calibrated using a standard
spectrum of α-Fe. Obtained Mössbauer spectra were analyzed using commercially available fitting
software, MössWinn 4.0.
Figures 2(a)-2(c) show the CEMS spectra for samples A-C, respectively. Obtained CEMS spectra were
decomposed into three ferromagnetic components and one nonmagnetic component. We consider that the
nonmagnetic component is attributed to the surface oxidized layer. The values of a hyperfine field, an isomer shift, and a quadrupole splitting of sample A were in good agreement with those reported [5].
However, the relative area ratio of I : II sites was not an ideal value of 1 : 3, but 0.53 : 3. The in-plane
lattice parameter of the Fe4N layer in sample A deduced from x-ray diffraction measurements was 0.3812
nm and is almost the same as that of the bulk value (0.3795 nm) [5]. Thus, we believe that this
extremely-small occupation value for I sites is not attributed to Fe vacancies, but to the excess insertion
and/or site-disorder of the N atoms since I sites are equivalent to II sites when the N atoms are located at
interstitial sites between the two nearest I sites. The results of CEMS measurements for samples B and C
also indicated that Fe atoms in samples B and C are located at both I and II sites and/or there is the
site-disorder of the N atoms. This is consistent with our previous report [4]. This trend is also theoretically
supported by the first-principles calculation, which shows that Co atoms tend to occupy both the I and II
sites in CoFe N from the view point of total energy [6]. In order to obtain highly spin-polarized
IIA site
N I site
IIB site
-10 -8 -6 -4 -2 0 2 4 6 8 10 (a) sample A
Int
ens
it
y [
ar
b.
uni
t]
Velocity [mm/s]
Data Total I IIA IIB Doublet References[1] S. Kokado, N. Fujima, K. Harigaya, H. Shimizu, and A. Sakuma, Phys. Rev. B 73, 172410 (2006).
[2] Y. Imai, Y. Takahashi, and T. Kumagai, J. Magn. Magn. Mater. 322, 2665 (2010).
[3] Y. Takahashi, Y. Imai, and T. Kumagai, J. Magn. Magn. Mater. 323, 2941 (2011).
[4] K. Ito, T. Sanai, S. Zhu, Y. Yasutomi, K. Toko, S. Honda, S. Ueda, Y. Takeda, Y. Saitoh, Y. Imai, A.
Kimura, and T. Suemasu, Appl. Phys. Lett. 103, 232403 (2013).
[5] J. C. Wood and A. J. Nozik, Phys. Rev. B 4, 2224 (1971).
[6] P. Monachesi, T. Björkman, T. Gasche, and O. Eriksson, Phys. Rev. B 88, 054420 (2013).
Fig. 2 Mössbauer spectra of (a) Fe4N, (b) CoFe3N,
and (c) Co3FeN films.
-10 -8 -6 -4 -2 0 2 4 6 8 10
(b) sample B
Int
ens
it
y [
ar
b.
uni
t]
Velocity [mm/s]
-10 -8 -6 -4 -2 0 2 4 6 8 10
3.5
Cluster effect on the yield of secondary electrons produced by inner
shell electron excitation
S. Tomita, Y. Shiina, S. Tamura, R. Kinoshita, S. Ishii and K. Sasa
The generation rate of scattered electrons is generally assumed to be proportional to the inelastic
stopping power because of the observed proportionality between the secondary electron yield and the
stopping power [1]. However, it is experimentally shown that the proportionality does not hold for the
case of fast carbon cluster ions. The secondary-electron yield for 0.5 MeV/atom C+4 ions is approximately
50% of that of atomic ions with the same velocity [2], whereas the electronic stopping power of C+4 is
approximately the same as that of four atomic ions [3]. There must be a specific mechanism that reduces
the secondary-electron yield despite of the same energy deposit. To investigate this problem further, we
measured the molecular effect on the yield of secondary electrons which stem from close collisions in a
first-excitation process.
The experiments were conducted at Tandem Accelerator Complex at the University of Tsukuba
(UT-TAC). A schematic of the experimental apparatus is shown in Fig.1. The accelerated molecular ions
impinged on a thin carbon foil after passing through an aperture of 1 mm in diameter. The carbon foil
was set with an angle of 45◦with respect to the direction of fast ion beams. The foil was purchased from
Arizona Carbon Foil Co., whose nominal thickness was 5µg/cm2. The ions that penetrated through the
carbon foil were detected by an ion-implanted-silicon charged particle detector (ORTEC ULTRA). The
opening angle of the detector was 1.6◦, which was limited by a tiny aperture placed in front of the detector.
The individual atoms scattered more than 1.6◦ by close collision with a target atom were not detected by
the detector. The secondary electrons produced in backwards by a fast-molecule impact were extracted
towards a micro channel plate (MCP) detector. The MCP signal was amplified with a charge-sensitive
preamplifier and recorded with an ADC coincident with a signal from SSD event by event, using CAMAC
data acquisition.
The coincident measurement with the projectile atoms allows us to measure backward
secondary-electron yields as a function of the number of detected atoms. The mean values of secondary-secondary-electron
yields are shown in Fig. 2 together with the results of single carbon atom impacts, γi
( C+)
(i = 0,1).
φ1.0 aparture φ3.0 aparture SSD MCP 0.5 MeV/atom Cn + Grid Carbon foil Secondary electrons
0 1 2 230 235 240 245 i (C +)
Number of detected atoms i
345 350 355 360 365 i (C2 +) -15 -10 -5 0 (a rb . uni t)
Fig. 2. Secondary electron yields for C+2,γi (
C+2 )
, (open circles) and C+
,γi (
C+), (crosses) as a function
of the number of detected projectile atomsi.∆γshows the difference in secondary electron yields
from that of the case that no constituent projectile atom was detected by the silicon detector.
The yields for both cases are plotted together to show the difference from the case that no projectile atoms
were detected by silicon detector; therefore, the total yield of secondary electrons is shown on a different
axis. It is clear that the secondary-electron yield decreases with the number of detected atoms. This can
be reasonably understood as a contribution of inner shell electron excitation, similar to the case reported
by Ogawa et. al. [4] for proton impacts. The classical trajectory calculation with Moli´ere potential
results a closest distance of 0.02 ˚Afor a scattering angle of 1.6◦, which is much smaller than the radius of
0.092 ˚Awhere the K-shell electron density of a carbon atom has its maximum value [5].
Note that there seems to be no molecular effect on the contribution of inner shell electron excitation,
whereas total secondary electron yields are strongly suppressed. These results can be generally described
as that there is no molecular effect in the phenomena involving violent collisions, such as inner-shell
elec-tron excitation in the present case. The enhancement for inner shell excitation stems from single-elecelec-tron
excitation, i.e., it excludes collective excitation such as plasmon excitations. However, it is difficult to
conclude that the cluster effect occurs in a collective excitation.
References
[1] H. Rothard, K. Kroneberger, A. Clouvas, E. Veje, P. Lorenzen, N. Keller, J. U. Kemmler, W.
Meck-bach, and K.-O. Groeneveld. Physical Review A, 41:2521, 1990.
[2] S. Tomita, S. Yoda, R. Uchiyama, S. Ishii, K. Sasa, T. Kaneko, and H. Kudo. Physical Review A
(Atomic, Molecular, and Optical Physics), 73:060901, 2006.
[3] S. Tomita, M. Murakami, N. Sakamoto, S. Ishii, K. Sasa, T. Kaneko, and H. Kudo. Physical Review
A, 82:044901, 2010.
[4] H. Ogawa, H. Tsuchida, and N. Sakamoto. Physical Review A, 68:052901, 2003.
3.6
Limit of detection for hydrogen by developed high-resolusion ERDA
system
D. Sekiba1, K. Chito1, I. Harayama1, Y. Watahiki1, S. Ishii1 and K. Ozeki2
Recently we have developed high-resolution ERDA system on the D-course of the 1 MV Tandetron
accelerator in UTTAC (University of Tsukuba, Tandem Accelerator Complex). The system is optimized to
detect the hydrogen in the surface and subsurface of solids, taking into account the design of K. Kimura et
al. of Kyoto University [1]. The analyzer consists of 90 degree sector lens and PSD (position sensitive
detector) with MCP (micro channel plate made by Hamamatsu Photonics K.K.). While high-resolution
ERDA with the sector lens demonstrates the nice depth resolution (~ 0.28 nm for the Si substrate), the
detection limit for hydrogen is not good enough compared to that of SIMS (Secondary Ion Mass
Spectroscopy) ~ 1018 particle/cm3. The detection limit of analysis is generally determined by an intrinsic background produced by the detection system itself. In the case of ion beam analysis with sector lens and
PSD, the origins of the background are mainly dark current of MCP and stray particles. Hashimoto et al.
recently tried the system, which distinguishes the dark current and/or real signals, taking the coincidence
of ion detection and secondary electron detection by means of two MCP [2,3]. There 200 ppm for As in
the Si substrate with the data acquisition time of 1000 s for RBS (Rutherford Backscattering
Spectroscopy) and 0.08 at.% B in the Si substrate for ERDA were achieved. On the other hand, the
detailed detection limit of high-resolution ERDA for hydrogen has never been reported. We show the
result of detection limit analysis for hydrogen with high-resolution ERDA employing a-C:H
(hydrogenized amorphous carbon) film.
The 500 keV 16O+ beam was shaped to 1 mm square with a four-quadrant slit and was irradiated onto the sample. The typical beam current was the several tens nA. The recoil angle was set at 30 degree from
the beam incident direction. The dimension of the detection system is the same reported in Ref [2]. A thin
Mylar foil (0.5 µm thickness) was put in front of the MCP to remove the forward scattered incident
particles (16O). The coincidence system reported in Ref. [2,3] was not used in the present study. The sample, a-C:H film (~150 nm thickness) deposited on Si(100) by chemical vapor desorption, was prepared
by K. Ozeki in Ibaraki University. The contained hydrogen amount was carefully determined by means of
conventional ERDA with the condition previously reported [4]. As a result, the composition ratio of
hydrogen and heavy hydrogen in a-C:H were estimated as H : D : C = 33.1 : 11.5 : 55.4. By using SRIM
code, the concentration of hydrogen in the sample was determined as 7.05 x 10²² particles/cm3.
Figure 1(left) shows the high-resolution ERDA spectra taken on the above described sample. The
surface peak is observed at ~ 500 ch indicating the adsorbed water on the surface. The edges at ~ 150 ch
and 830 ch are artifacts due to the edges of MCP. To determine the limit of detection of hydrogen from Fig.
ch. According to the simple definition suggested by Hashimoto et al. [2,3], the limit of detection for
hydrogen with this system was estimated as 1.6 x 10²⁰ particles/cm3 with the data acquisition time of 308 s.
The beam irradiation necessary for this measurement was 2.2 µC.
Figure1: (left) The high-resolution ERDA spectrum taken on a-C:H film with the 500 keV 16O+ beam. The sample surface corresponds to ~ 500 ch, while the edges at ~ 150 ch and ~ 830 ch indicate the edges of MCP. (right) The change of the spectrum feature of high-resolution ERDA on a-C:H due to the damage. The spectra were taken with every ~2.2 µC.
Interestingly the contribution of stray particles, in this case mainly hydrogen scattered by inner wall of
the chamber, was observed in Fig. 1(right). The spectra in Fig. 1(right) were taken with every ~ 2.2 µC on
the same position of the sample. The intensity corresponding to the hydrogen concentration was
continuously decreases indicating the desorption of hydrogen due to the beam irradiation damage.
Accompanying the decrease of the signal intensity in the subsurface region, the intensity of background
seen in the vacuum region also is suppressed. This implies that the stray hydrogen ions, which recoils
from the subsurface and bulk, are not negligible compared to the dark current of MCP, when the sample is
thick enough and contains a lot of hydrogen. In fact, in the case of thin oxide film (~ 4 nm) on SiC which
contains much less hydrogen in bulk, we obtained a better limit of detection for hydrogen ~ 2.8 x 10¹⁹ particles/cm3.
As a future work the development of a system, which can distinguish not only the dark current of MCP
but also the stray recoil particle, will be necessary to take the further improvement of limit of detection in
high-resolution ERDA.
References
[1] K. Kimura, K. Nakajima, H. Imura, Nucl. Instr. and Meth. B 140 (1998) 397-401.
[2] H. Hashimoto, K. Nakajima, K. Sasakawa, K. Kimura, Rev. Sci. Instrum. 82 (2011) 063301.
[3] H. Hashimoto, S. Fujita, K. Nakajima, M. Suzuki, K. Sasakawa, K. Kimura, Nucl. Instr. and Meth. B
273 (2012) 241-244.
4.
4.1
Depth profiles of
129I and
129I /
127I ratio in soil at the near-field site of
the Fukushima Dai-ichi Nuclear Power Plant
T. Matsunaka, K. Sasa, K. Sueki, T. Takahashi, M. Matsumura, Y. Satou, N. Shibayama, J. Kitagawa1, N. Kinoshita2, and H. Matsuzaki3
Massive nuclear fission products such as radioiodine were deposited on the surface in Fukushima via
radioactive plume derived from the Fukushima Dai-ichi Nuclear Power Plant (FDNPP) accident. In order
to evaluate inventory and penetration of accident-derived 129I in the highly-contaminated area, depth profiles of 129I concentration and 129I / 127I ratio in 5-cm-long soil cores after the accident were investigated at three sites shown in Fig.1: NM-6 site at Namie town (7.5 km northwest site from the FDNPP), Iw-2 site
at Okuma town (4.3 km west site from the FDNPP) and Iw-8 site at Okuma town (8.2 km west site from
the FDNPP).
Total 129I inventories in the soil cores were estimated to be 1.80 Bq m−2 at NM-6, 1.84 Bq m−2 at Iw-2 and 0.68 Bq m−2 at Iw-8. Average 129I / 127I ratio in each soil cores after the accident (NM-6: 8.6 × 10⁻⁷, Iw-2: 2.1 × 10⁻⁶, Iw-8: 4.2 × 10⁻⁷) shows typical ratios of the contaminated surface soils in Fukushima (1.5 × 10⁻⁸ – 7.2 × 10⁻⁶) [1]. Therefore, accident-derived 129I deposited at NM-6 and Iw-2 were 2.7 times higher than that at Iw-8. Depth profiles of 129I concentration and 129I / 127I ratio exponentially declined with depth (Fig.2). Approximately 90% of deposited 129I in 5-cm-long soil cores were observed in the surface
Fig.1. Sampling sites of 5-cm-long soil core within 10 km from the FDNPP on the
distribution map of radiation dose as of November 5, 2011 (4th) mapping by
layer of 16.1 – 17.8 kg m−2 (1.6 – 2.5 cm) in depth. In addition, the relaxation mass depths (h0) of 129
I were
determined to be 8.2 kg m−2 at NM-6, 9.5 kg m−2 at Iw-2 and 9.2 kg m−2 at Iw-8.
References
[1] Miyake et al. (2012) Geochemical Journal, 46, 327-333.
Fig.2. Cumulative 129I inventories (A) and depth profiles of 129I concentrations (B) in 5-cm-long soil core from NM-6, Iw-2 and Iw-8. Total 129I inventories in the core, estimated activity 129I concentration of surface soil (C(0)) and relaxation mass depth (h0) of
129
I are shown in the
profiles. 0 10 20 30 40 50 60
0 0.5 1 1.5 2
M ath d ep th (k g m -2 )
0 0.5 1 1.5 2
0 10 20 30 40 50 60
0 0.5 1 1.5 2
0 10 20 30 40 50 60 0 10 20 30 40 50 60
0 50 100 150
0 10 20 30 40 50 60
0 50 100 150
0 10 20 30 40 50 60
0 50 100 150
M ath d ep th (k g m -2 )
Iw-2
Iw-8
NM-6
Cumulative
129I inventory (Bq m
-2)
129
I concentration (mBq kg
-1)
A)
B)
Total 129I inventory = 1.80 Bq m-2
Total 129I inventory = 1.84 Bq m-2
Total 129I inventory = 0.68 Bq m-2
Iw-2
Iw-8
NM-6
h
0 = 8.2 kg m -2
h
0 = 9.5 kg m -2
h
0 = 9.2 kg m -2 C(0) = 71.1 mBq kg-1 C(0) = 193mBq kg
-1
C(0) = 150 mBq kg
4.2
Study on monitoring of volcanic activity using
129I /
127I ratios in crater
lake and hot spring at Zao volcano, Miyagi Prefecture
T. Matsunaka, K. Sasa, K. Sueki, N. Shibayama, T. Takahashi, M. Matsumura, Y. Satou, H. Matsuzaki1, A. Goto2, T. Watanabe3, N. Tsutchiya3, N. Hirano3 and A. Kizaki4
Volcanic tremors and mountain gradient changes have been detected at Zao volcano in Miyagi since
January 2013, volcanic activity has become higher after the 2011 Tohoku Earthquake although the volcano
will not erupt immediately [1]. Basic water quality of crater lake and hot spring at Zao volcano have been studied by the group of Tohoku University from September 2013 since the water quality of crater lake are
correlating with volcanic activity [2] [3]. As a part of this project, we are trying to monitor the volcanic activity using 129I / 127I ratios (atomic ratio of radioiodine and stable iodine) in crater lake and hot spring of Zao volcano. Natural 129I (half-life: 15.7 million year) are produced by nuclear spallation reaction of 129Xe with cosmic ray in the atmosphere and spontaneous fission of 238U in the geological layer. In the ocean,
steady-state 129I / 127I ratio of the seawater is estimated to be 1.5 × 10⁻¹² [4]. Sunken iodine by the ocean plate having lower 129I / 127I ratio (older 129I age) compared to the steady-state ratio of seawater, are supplied to the atmosphere mainly via magmatic activity. In general, 129I / 127I ratio in hot spring water and brine water are used as indicator of origin and behavior of iodine in the groundwater [5] [6]. 129I / 127I ratio of hydrothermal at Zao volcano are considered to become lower by the supply of chronologically-old iodine
in terms of global iodine cycle.
In September 2013, water samples of 2 L were collected from the surface of crater lake (Okama,
diameter: 350 m, maximum depth: 35 m) located at 1,560 m in elevation and hot spring (Kamoshika Hot
Spring) located at 1,230 m in elevation in the eastern side of Zao volcano (Fig.1). Water temperature and
pH were measured on site. After water samples were filtered by 0.2 µm filter, 129I / 127I ratio were measured by AMS for the isotopic diluted water samples adding carrier (127I standard) at MALT, The
Fig.1. Photographs of sampling sites; A: Okama (crater lake), B: Kamoshika Hot Spring. B)
University of Tokyo. 127I concentrations were measured by ICP-MS, and original 129I / 127I ratio of water samples were estimated (Fig.2).
Water temperature and pH were 10.2℃ and 3.3 at Okama; 40.0℃ and 3.3 – 4.0 at Kamoshika Hot
Spring. 129I / 127I ratios of Okama and Kamoshika Hot Spring were respectively, estimated to be (1.5 ± 0.4) × 10-9 and (0.78 ± 0.15) × 10-9, 500 – 1,000 times higher than the steady-state ratio of sea water (1.5 × 10⁻¹²) [4]. Since 129I / 127I ratio of anthropogenic metric water were over 9.0 × 10⁻¹² [7], surface water of Okama and Kamoshika Hot Spring water were very likely to be strong affected by the meteoric water
including anthropogenic 129I. For the monitoring of volcanic activity using 129I / 127I ratio, it is necessary to decide the site as few anthropogenic 129I as possible through the measuring of 129I / 127I ratio of the Okama bottom water and some hot spring around Zao volcano. Continuous water quality survey of 1 time for
Okama and 1 time per 2 months for hot springs are planned for this year.
References
[1] Japan Meteorological Agency, (2013) Monthly Volcanic Activity Report.
[2] Ohba et al., (2000) Journal of Volcanology and Geothermal Research, 97, 329-346.
[3] Ohba et al., (2008) Journal of Volcanology and Geothermal Research, 178, 131-144.
[4] Moran et al., (1998) Chemical Geology, 152, 193-203.
[5] Snyder and Fehn, (2002) Geochimica et Cosmochimica Acta, 66, 3827-3838.
[6] Muramatsu et al., (2001) Earth and Planetary Science Letter, 192, 583-593.
[7] Tomaru et al., (2007) Applied Geochemisty, 22, 676-691.
Fig.3. 129I / 127I ratios of Okama (crater lake) and Kamoshika Hot Spring at September
2013; red dashed line: 129I / 127I ratio of anthropogenic metric water, blue dashed
line: 129I / 127I ratio of sea water. Fig.2. Sample preparation of water for the determinations
4.3
Successive searches of
129I contamination in the chemical sample
preparation room
M. Matsumura, K. Sasa, K. Sueki, N. Shibayama, T. Matsunaka, T. Takahashi, Y. Satou and H. Matsuzaki1
We have addressed measurements of trace radionuclides such as 36Cl and 129I by AMS. It is important that the sample preparation room must be kept clean for accurate measurement. “Clean” means that it is
far from not only visible state but also invisible contamination including isobars of interests. The
contamination induces confusion in experimental results for AMS. However, the sample preparation room
tends to be gradually contaminated in the process of chemical treating with a high concentration of
radionuclides. Especially, halogen family of elements have volatile species, and contaminant diffusion
occurs in the sample preparation room easily. In this work, we show the extent of contamination in the
sample preparation rooms over time, particularly pertaining to 129I.
Alkaline trap solutions were placed in the several sample preparation rooms with each three weeks, at
University of Tsukuba Tandem Accelerator Complex (UTTAC) and Center for Research in Isotopes and
Environmental Dynamics (CRiED). After the iodine carrier was added to the part of trap solutions, the
Table 1. Measurement of 129I/127I ratio in different rooms by AMS
Room No. MT date
2013/8/11 1.3 ± 0.0 1.9×10⁴ ± 0.1×10⁴ 39 ± 5
2013/11/3 0.78 ± 0.13 6.1×10³ ± 3.6×10³ 7.2 ± 4.8
2013/8/11 0.59 ± 0.024 1.9×10³ ± 1×10³
2013/11/3 0.36 ± 0.03
2013/8/11 3.0 ± 0.1 6.2×10⁴ ± 0.2×10⁴ 4.7×10² ± 2.4×10²
2013/11/3 4.96 ± 0.52 1.1×10⁵ ± 0.1×10⁴ 1.4×10² ± 0.3×10²
C210 2013/11/3 0.84 ± 0.06 7.0×10³ ± 1.7×10³ 3.3 ± 0.8
CRiED hot
room 2013/11/3 62 ± 2 1.5×10
6 ±
0.05×10⁶ 1.2 ± 0.2
CRiED cold room
129
I/127I (×10-12)
N.D. N.D.
N.D. 129
I (atom g-1) 129I/127I (×10-9)
C108
C209
Note: 129I/127I ratios were normalized by Purdue STD (63.6×10⁻¹²) in the measurement. The amount of carrier was 2 mg.
The carrier solution was produced by Orion ionplusR(Thermo Fisher Scientific, USA). The 129I/127I ratios of this carrier reported were around 1.7
×10-12 [2].
Fig.1. Comparison of 129I/127I ratios of the different rooms. References
[1] Matsuzaki, H. et al., Nucl. Instr. and Meth. B 259 (2007) 721.
4.4
Comparison between
36Cl-AMS simulations using PHITS code and
experiments
D. Izumi, K. Sasa, T. Takahashi, T. Matsunaka, Y. Satou, M. Matsumura, K. Sueki, M. Kinoshita1, Y. Miyake2 and H. Matsuzaki2
Update of the tandem accelerator is planned in the University of Tsukuba Tandem Accelerator Complex
(UTTAC). Our group had worked on applied studies using 36Cl-AMS with an old accelerator system. The maximum terminal voltage will fall down from 12 MV to 6 MV due to the update. We have investigated a
material of window and gas pressure of a gas ionization detector because separation of isobars depends on
energy of projectile and these detector condition. As the first step of that purpose, we simulated energy
spectrum and the energy loss of 36Cl in the detector using PHITS code (Particle and Heavy Ion Transport code System) [1] and results of the simulation were compared with those performed at MALT, the
University of Tokyo. As shown in experimental results (Fig. 1), 36Cl couldn’t be separated completely
from 36S on two-dimensional spectrum.
Ions of 36Cl7+ with 40 MeV were measured with the gas ionization detector which was filled with 60 Torr
P10 gas (Ar 90% +CH4 10%). A 3 µm of Mylar foil was used in the detector window. We obtained
two-dimensional energy spectra of 36Cl and 36S. On the other hand, the spectra were compared with simulations using PHITS code. As a spectrum is seen in Fig. 2, the simulation showed that tail of 36S interfered detection of 36Cl. The tail would be caused by multiple scattering in the Mylar foil. To avoid multiple scattering, If a 150-nm-thick-silicon nitride foil (Si3N4) is used in the detector window, the
scattering would be avoided because of its small energy loss [2]. As a spectrum is seen in Fig. 3, these
results and more analysis of detector condition for optimization using the simulation would allow us to
separate the isobars in the 36Cl-AMS. As a result of simulation in Fig. 3, the silicon nitride entrance window will apply the new 36Cl-AMS system at UTTAC.
Fig.1. Two-dimensional spectrum of AMS for
References
[1] T. Sato, K. Niita, N. Matsuda, S. Hashimoto, Y. Iwamoto, S. Noda, T. Ogawa, H. Iwase, H. Nakashima,
T. Fukahori, K. Okumura, T. Kai, S. Chiba, T. Furuta and L. Sihver, Particle and Heavy Ion Transport
Code System PHITS, Version 2.52, J. Nucl. Sci. Technol. 50, 913–923 (2013).
[2] C. Maden, P.A.F. Anastasi, A. Dougans, S.P.H.T. Freeman, R. Kitchen, G. Klody, C. Schnabel, M.
Sundquist, K. Vanner, S. Xu, SUERC AMS ion detection, Nucl. Instr. Meth. B 259, 131–139 (2007). Fig.2. Two-dimensional spectrum for
40-MeV-36Cl and 36S with 3-µm-thick-Mylar foil simulated using PHITS code.
Fig.3. Two-dimensional spectrum for


![Table 1. Parameters used for the SAMMY R-matrix fit[5] for the 45 Sc(p, α) 42 Ca reaction as shown in the Fig](https://thumb-ap.123doks.com/thumbv2/123deta/6802025.230554/17.892.84.818.367.430/table-parameters-used-sammy-matrix-reaction-shown-fig.webp)