Thermal boundary resistance between single-walled carbon nanotubes and surrounding matrices
Carl Fredrik Carlborg
Microsystem Technology Laboratory,
KTH - Royal Institute of Technology, SE - 100 44 Stockholm, Sweden
Junichiro Shiomi∗ and Shigeo Maruyama Department of Mechanical Engineering, The University of Tokyo, 7-3-1 Hongo,
Bunkyo-ku, Tokyo, 113-8656, Japan (Dated: September 28, 2008)
Abstract
Thermal boundary resistance (TBR) between a single-walled carbon nanotube (SWNT) and matrices of solid and liquid argon was investigated by performing classical molecular dynamics simulations. Thermal boundary conductance (TBC), i.e. inverse of TBR, was quantified for a range of nanotube lengths by applying a pico-second heat pulse to the SWNT and observing the relaxation. The SWNT-length effect on the TBC was confirmed to be absent for SWNT lengths from 20 to 500 ˚A. The heat transfer mechanism was studied in detail and phonon spectrum analysis provided evidence that the resonant coupling between the low frequency modes of the SWNT and the argon matrix is present both in solid and liquid argon cases. The heat transfer mechanism was qualitatively analyzed by calculating the spectral temperature of the SWNT in different frequency regimes. It was found that the low frequency modes that are resonantly coupled to the argon matrix relaxes roughly ten times faster than the overall TBC time-scale, depending on the surrounding matrix. However, such resonant coupling was found to transfer little energy despite a popular picture of the linear transfer path. The analysis suggests that intra nanotube energy transfer from high frequency modes to low frequency ones is slower than the interfacial heat transfer to the argon matrix.
PACS numbers: 61.46.Fg, 65.80.+n,67.40.Pm
Keywords: carbon nanotube, thermal boundary resistance, molecular dynamics
I. INTRODUCTION
The expectations for new micro- and nanoscale applications have steadily increased since the discovery of single-walled carbon nanotubes (SWNTs)1, due to their remarkable electri- cal and thermal properties2,3. For many such applications, the complete characterization of the thermal properties of SWNTs is of a great importance. Previous work in this area has investigated the high thermal conductivity of carbon nanotubes through both experiments and simulations4–13. Considering integrated systems in practical situations, interfacial heat transfer between nanotubes and surrounding materials becomes important and determines the maximum heat load in the system10,14–19. A representative case with particular impor- tance of the interfacial heat transfer is SWNT composites, where the thermal boundary conductance (TBC) between an SWNT and surrounding matrix plays an important role14. Carbon nanotubes are of great interest as additives for enhancing the thermal conductivity of insulating materials15,16. The mechanical strength and light weight of polymers, combined with high thermal and/or electrical conductivity of the nanotubes would find numerous ap- plication areas17,18. It has been experimentally shown that a relatively low concentration of nanotubes increases the thermal conductivity of polymers and organic fluids14–16. On the other hand, Huxtable et al.19 demonstrated that the effective thermal conductivity of carbon nanotube suspensions was much lower than the values estimated from the intrinsic thermal conductivity of the nanotubes, due to an extremely low interface thermal conduc- tance. Conventional heat conduction models for solid/liquid interfaces fail to accurately predict the TBC20, and hence fundamental investigations of TBC between an SWNT and surrounding materials are of a great importance.
The physics of TBC is confined in atomic-scale layers at the boundary and strongly depends on local properties of the adsorption layer on the surface. While the general impor- tance of TBC has attracted a number of studies, molecular dynamics (MD) simulations have served as a powerful tool to resolve such atomic-scale dynamics. Maruyama and Kimura21 demonstrated that the TBC can not be neglected over solid-liquid interfaces, and Barrat and Chiarutini22 showed that the thermal boundary resistance at a solid-liquid interface can reach appreciable values if the liquid does not wet the solid. Ohara and Suzuki23investigated the thermal resistance at a solid-liquid interface in terms of intermolecular energy transfer.
Molecular dynamics of TBC has also been investigated for an SWNT surrounded by liquid
octane24. Based on the dependence of the TBC on the nanotube-length, they discussed that the local packing of adsorbed liquid octane layer gives rise to resonant coupling with the nanotube, i.e. a linear coupling of the vibrational modes. However, the study was limited to SWNTs far shorter than the ones in practical situations and thus encourages further studies on TBC to clarify the limit of the length effect and mechanism of heat transfer.
In the current work, the dependence of the TBC between an SWNT and a surrounding matrix on the nanotube-length, and the phase of the matrix have been calculated using non- equilibrium classical MD methods. By adopting a simple system with the matrix modeled by the Lennard-Jones (L-J) potential function, the study explores a wider range of nanotube lengths than that in the previous work24. Contribution of the modal energy transfer between the SWNT and the matrix, and its dependence on the matrix phase, have been quantified by analyzing the vibrational spectra of the composite system.
II. SIMULATION METHOD
In the molecular dynamics simulations, we use the Brenner potential25 in a simplified form26 to express the interactions between carbons. The formulation of the potential is based on the covalent-bonding treatment developed by Tersoff27. The total potential energy of the systemEb is expressed as the sum of the bonding energy of each bond between carbon atoms i and j
Eb =X
i
X
j(i<j)
VR(rij −Bij∗VA(rij)
, (1)
where VR and VA are repulsive and attractive force terms, which take the Morse type form with a cutoff function. Bij∗ represents the effect of the bonding condition of the atoms. For the potential parameters, we employ the set that was shown to reproduce the force constant better27. The potential has been shown to reproduce phonon dispersion relations of SWNTs with sufficient accuracy6,7,11.
The intractions between argon atoms are represented by the L-J potential function with parameters in Table I, which takes the form
Φ(rij) = 4ǫ σ
rij
12
− σ
rij
6!
, (2)
whereǫand σare the energy and length scales and rij is the distance between atomiandj.
This potential function describes well the van der Waals forces between argon atoms. The
Lorentz-Berthelot mixing rules are adopted to obtain the cross-interaction term of Ar-C (Table I). The cutoff distance of the L-J function was set to 3.5 ˚A. The velocity Verlet algorithm was adopted to integrate the equation of motion with the time step of 0.5 fs.
Simulations were conducted for armchair SWNTs with chirality (5, 5), which gives a radius of 0.69 nm. The cross-sectional area of the simulation box was 35 × 35 ˚A2 and periodic boundary conditions were applied in all directions. The carbon nanotube length was varied from 10 to 500 ˚A. Temperature was controlled by auxiliary velocity scaling control. To generate solid and liquid phase matrices, argon atoms were packed in a face-centered cubic structure around an SWNT with densities of 3000 kg/m3 and 1200 kg/m3, respectively.
Both systems were equilibrated at 300 K in supercritical phase and then cooled down at a rate of 1 K/ps to their respective target temperatures, 40 K for the solid matrix and 120 K for the liquid matrix.
Figure 1 shows the complete temperature history during the simulations of a 225 ˚A long SWNT surrounded by a solid argon matrix. After equilibration, the matrices were disturbed out of equilibrium by ramping up the temperature of the SWNT by 200 K for 10 ps and adiabatically relaxing them towards equilibrium without temperature control. During relax- ation, the velocity components of the atoms were sampled and the temperature difference between the SWNT and the surrounding argon matrix was calculated. The temperature difference between the SWNT and the matrix during the relaxation can be well expressed by a single exponential function with the relaxation time τ. The thermal boundary con- ductance (TBC) K can be determined using the lumped-heat capacity method assuming that the TBC of the SWNT/matrix interface is smaller than the internal heat conduction of the SWNT (small Biot number)4 (Fig. 1). Equation 3, derived from the expression of two coupled objects, describes the temperature difference (∆T = TSWNT−TAr) between the two domains as a function of time and can be fitted to the results from the simulation to obtain K,
∆T = ∆T0e
“
−
“ 1
mArcAr+mSWNTcSWNT1 ” KSt”
. (3)
Here, the masses mAr and mSWNT, the heat capacities (cAr= 312 J/kgK and cSWNT=1000 J/kgK) and the contact area S are known. The contact area S, can be calculated as
S =πL(d+σC-Ar), (4)
whered is the diameter of the (5,5) SWNT, σC-Ar is the equilibrium distance of the carbon-
argon interaction and L is the length of the respective tube.
The mechanism of the heat transfer can be studied based on the phonon energy spectrum of the nanotube that is extracted by calculating the power spectral density of the velocity fluctuations6,7,
g(f) = 1 N
N
X
j
Z
e−2πif tvjdt
2
, (5)
wheref is the frequency, vj is the velocity of carbon atomj, andN is the number of atoms in the SWNT. The same method was employed to calculate the phonon spectrum for the solid argon matrix at the interface, but only for argon atoms surrounding the SWNT in order to avoid influence from the bulk phonon spectrum of argon. For the liquid argon matrix, the vibrational spectrum was obtained through the autocorrelation function of the velocity components (VACF). The autocorrelation of the argon atoms adsorbed at the surface can be written as
VACF(t) =
*N
ads
X
i=1
vi(0)·vi(t) +
, (6)
where Nads is the number of argon atoms in the absorption layer. The argon adsorption layer was defined as a cylindrical control volume with the surface located 4 ˚A away from the SWNT surface. The Fourier transform of the autocorrelation function is proportional to the phonon energy spectrum.
Finally, 2-D phonon energy spectrum can be computed by the two-dimensional Fourier spectrum over each unit cell of the nanotube11. Here it is presented as the energy density in (f,k)-space,
Θ(f, k) = m 2
p
X
3
X
α
1 Nz
Nz−1
X
n=0
eink/Nz
Z
vα(n, t)e−i2πf tdt
2
, (7)
whereNzis the number of carbon atoms in thez-direction (i.e. unit-cells in the nanotube),p is the number of atoms per unit cell,mis the mass of a carbon atom, andαis the cylindrical coordinate directions (z,r,φ). The data are discrete due to the finite length of the nanotube and the broadening of the spectral peaks indicate phonon scattering.
In the current paper, we present results in a temperature range from 40 K to 310 K. The lower temperature limit is low enough to violate the quantum limit of a classical carbon nanotube system where the reduction of the heat capacity is significant. Thus the current model system serves to highlight the classical molecular dynamics of the heat conduction.
III. RESULTS AND DISCUSSION
A. Molecular structure
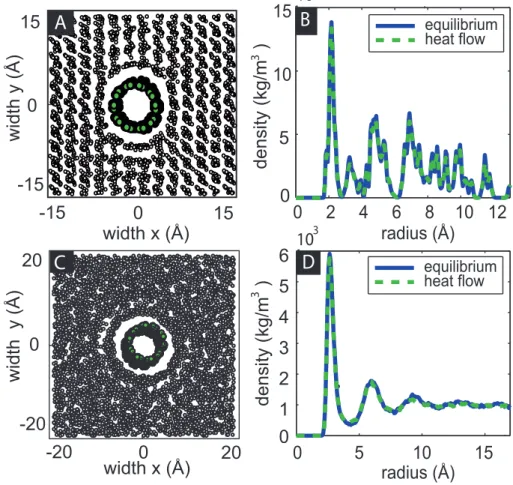
Snapshots of the systems were taken during the simulation, and the radial density of the argon matrix was measured. The equilibrated structure of the solid argon matrix structure (Fig. 2A) is locally influenced by the presence of the (5, 5) SWNT and the argon atoms adjacent to the tube are deformed from the bulk matrix structure as visible in the peak at 2
˚A in Fig. 2B, which is determined by the interaction potentialσC-Ar representing the weak van der Waals force. The radial density distribution (Fig. 2B) shows that the argon crystal structure remains unchanged between the thermal equilibrium case and non-equilibrium case with heat flow. The bulk crystal structure appears to have limited influence on the interfacial heat conduction as was verified by changing the initial crystal configuration from face-centered cubic to body-centered cubic.
In the equilibrated liquid matrix, argon atoms form a dense adsorption layer around the SWNT (Fig. 2C). Two other denser layer formations are revealed in a plot of the radial density function (Fig. 2D). The temperature increase during heat flow does not alter the equilibrium structure of the system, as seen in Fig. 2D.
B. Length dependence of the TBC
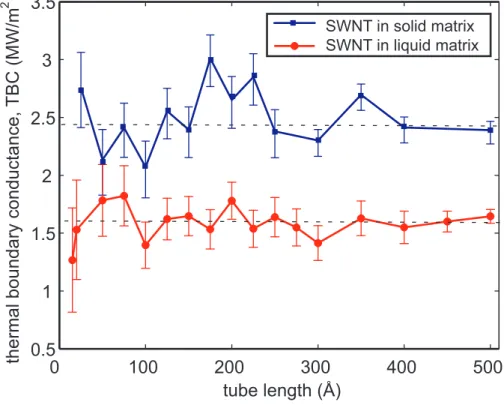
The TBC of SWNT-matrix was calculated for nanotube-lengthsL, ranging from 20 to 500
˚A and matrices of both solid and liquid phases. As shown in Fig. 3, for both solid and liquid argon cases, K is nearly constant at values of 2.4 MW/(m2K) at 40 K and 1.6 MW/(m2K) at 120 K, respectively, for the entire range of L explored in the current study. We did not observe the length-effect previously discussed for the case of octane matrix24, where K increased withL. The idea is that if significant energy is transported through linear coupling of low frequency SWNT phonons and the vibrational modes of adsorbed layer of liquid octane, the energy flux should vary with the number ratio of the low frequency phonons, i.e.
the length of SWNTs. Although the length effect may be present, the effect is limited for very short nanotubes24. The critical SWNT lengthLcr, below which the length effect should takes place can be estimated by comparing the frequency of the lowest-energy phonon of the SWNT fSWNT0 and the maximum argon matrix phonon frequency fArmax. Considering
the heat transfer from the transverse acoustic modes to the solid argon matrix, fSWNT0 = cg/L, under Debye approximation and fArmax≈ 7 THz from Fig. 4A. Therefore, from cg = 8 km/s6,7,11,Lcr can be approximated as 12 ˚A which is close to the smallestL explored in the current study.
C. Spectral analysis of the TBC
The phonon spectral analysis demonstrates linear coupling between the low frequency oscillations in the SWNT and the adsorbed argon layer in both liquid and solid argon matrices. In Fig. 4, the spectra are compared with those of isolated SWNTs with same lengths and average temperatures. It can be seen that the lower frequency vibrations of SWNT surrounded by the argon matrix are damped out. This frequency range corresponds with the vibrational spectrum for the adsorbed layer of argon (close-ups are shown in Fig.
4B and 4D), which demonstrates resonant coupling between the adsorbed argon and the SWNT spectrum.
In the solid matrix, the argon spectrum stretches from 0 up to about 7 THz which is reflected in the damped SWNT spectrum. We also observe a significant suppression of overlapping modes in the liquid matrix. The spectrum of the adsorbed liquid argon stretches from 0 to 3 THz and has a peak centered at about 1 THz (Fig. 4). The adsorbed argon atoms in the liquid matrix have a solid-like vibrational spectrum and it has previously been proposed that density variations can modify the heat transfer through their acoustic impedance, similar to how optical coatings can modify the light transmission28. The phonon energy spectra of the SWNTs were based on 57,344 time steps sampled at 133 THz and ensemble averaged in 2048-sample windows during heat transfer. The argon spectra are sampled for 4096-time steps with 20 THz in 1024-sample windows.
A 2-D power spectral map was calculated based on 30,720 time steps, sampled at 133 THz and ensemble averaged in 4096-sample windows. In the solid matrix (Fig. 5A), the acoustic branches and the optical modes in the overlap range are significantly diffused in the 2-D power spectral map. The scattering only diminishes around 7 THz where the solid argon spectrum overlap vanishes. In the liquid matrix (Fig. 5B), the spectral overlap is smaller and only the first 3 THz of the accoustic modes and the first optical modes are damped. It is worth noting that the SWNT acoustic modes are the primarily carriers of heat conduction
along the SWNT and the coupling with the surrounding matrix suggests a reduced thermal conductivity of SWNTs mixed in solid materials compared to isolated SWNT.
At equilibrium, in the classical limit, energy is evenly distributed among all vibrational modes of the SWNT. Therefore, the thermal energy spectra g(f) can be written as
geq(f) = ρ(f)kBTeq, (8)
where ρ(f) is the phonon density of states and Teq is the kinetic temperature of the equi- librium system. When the SWNT is momentarily heated, the equilibrium is disturbed, such that the energy distribution of the SWNT depends on the mode-dependent intrinsic and interfacial phonon scattering, and the energy transport to the surrounding argon ma- trix. By introducing the spectral temperature Tsp(f, t), the time and frequency dependent non-equilibrium energy spectra can be written as
gneq(f, t) = ρ(f)kBTsp(f, t). (9) Now, we intend to examine the time scales of the mode-dependent interfacial energy transfer mechanism by calculating the time history of the SWNT spectral temperature.
From Eq. (8), the phonon density of state can be expressed as ρ(f) = geq(f)
kBTeq. (10)
Note that the phonon density of state of the SWNT is severely altered from that of the isolated SWNT due to the presence of surrounding argon matrix. Assuming that the phonon density of states is independent of temperature, Eq. (10) is substituted in Eq. (9), which results in,
Tsp(f, t) = gneq(f, t)
geq(f) Teq (11)
Therefore, Tsp(f, t) can be obtained by calculatinggeq(f, t) andgneq(f, t) separately by using equilibrium and non-equilibrium molecular dynamics simulations, respectively.
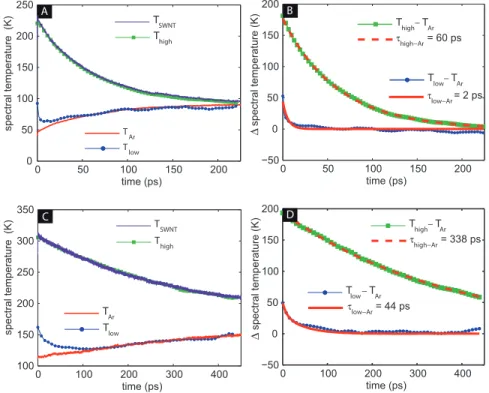
We now split the frequency range into the low frequency regime [f0, fc], where the SWNT spectrum overlaps with the argon spectrum, and the high frequency regime [fc, fmax], where the spectra do not overlap. The value of the cut-off frequency, fc was set to 7 THz in the solid matrix and 2 THz in the liquid matrix, slightly lower than the limits observed in fig 4. Then, the average spectral temperatures in the low and high frequency regimes can be
expressed as,
Tsplow(t) = Tfeq
c
Rfc
0
gneq(f,t)
geq(f) df (12)
Tsphigh(t) = fmaxTeq
−fc
Rfmax
fc
gneq(f,t)
geq(f) df. (13)
The SWNT was given a heat pulse ( ∆T= 200 K, ∆T= 10 ps) and the spectral temperature, along with the average kinetic temperature of the SWNT and the argon matrix, were plotted during the relaxation to a new equilibrium (Fig. 6A). In both matrices, the frequency range overlapping with the argon spectrum has a lower spectral temperature than the rest of the tube, while the non-overlap frequency dominates the heat transfer and decays with the total kinetic temperature of the SWNT. In fact, even in the solid matrix, the energy transfer associated with a relaxation in the overlap region amounts for less than 1 % of the total heat transferred to the argon. On the other hand, the spectral temperature of the frequency range that overlaps with the argon spectrum quickly relaxes to coincide with the argon matrix temperature (Fig. 6A and 6C). Heat in the overlap regime is transferred more efficiently due to the resonance between SWNT and the argon (through linear channels).
The spectral temperature, in both solid and liquid matrix cases, relaxes roughly ten times faster than in the non-overlap regime.
The spectral temperature decays in both the overlap and non-overlap regions are governed by single time scales as can be seen by plotting their differences with the argon temperature (Fig. 6B and 6D) and fitting with single exponential functions. There should also be another time scale representing interband heat transfer, which was not observed in the current analyses. This suggests that the interband heat transfer of the SWNT is either much longer or shorter than the analyzed time window. The former scenario may be more likely on considering the long mean free paths of low frequency phonons in SWNTs, which limits the number of collisions and thus the interband energy transfer. Such slow interband energy transfer may be particularly pronounced in the current system, where low frequency modes of the SWNT are severely damped (Fig. 5). One may also suspect that this interband energy transfer determines the time scale of TBC, i.e. the single exponential relaxation (Fig. 1) is caused by the intrinsic interband energy transfer of the SWNT instead of the interfacial energy transfer. However, that does not explain the observed density effect, where TBC increases with density.
Current results show energy transfer can be divided into two regions; fast but small heat
transfer from low spectral region to the surrounding argon matrix and relatively slow but dominating heat transfer from high frequency region to the argon matrix. The impact of the fast resonant heat transfer appears to be small, but if we consider quantum effects - with a higher population of low frequency phonons - this impact may become larger.
IV. CONCLUSIONS
Thermal boundary resistance (or conductance) between single-walled carbon nanotubes and surrounding matrices of solid and liquid argon has been studied using molecular dynamics simulations. It was shown that TBC between SWNT and liquid/solid argon remains constant for a wide range of SWNT lengths (20-500 ˚A). The TBC was 1.6 MW/m2 for the liquid argon matrix and 2.3 MW/m2 for the solid argon matrix. From the phonon spectral analysis, an evidence of resonant coupling was observed, in both solid and liquid matrices, through significant damping of the low frequency SWNT phonon modes that overlap with the argon matrix phonon spectrum. On instantaneously heating the SWNT, the spectral temperature of the resonant low frequency modes rapidly relaxes to that of the argon matrix within a few picoseconds both in the solid and liquid matrix cases. Even though this resonant energy transfer is by far the fastest heat conduction mechanism, it carries very little energy. This is because the slow inter-mode energy transfer of the SWNT prevents energy of high frequency modes to be redistributed to the low frequency modes. The results suggest that the relaxation time of intrinsic phonon collisions of the low frequency SWNT modes is much larger than that of the diffusive energy transfer from the SWNT high frequency modes to the argon matrix, and even larger than the simulation time. The current results could be useful in predicting the maximum thermal load of SWNT composites.
Acknowledgments
Carl Fredrik Carlborg wishes to acknowledge financial support from the Sweden-Japan Foundation. This work is supported in part by Grants-in-Aid for Scientific Research
19051016 and 19860022.
∗ Corresponding author. Electronic address: [email protected]
1 S. Ijima and T. Ichihashi, Nature363, 603 (1993).
2 R. Saito, G. Dresselhaus, and M. S. Dresselhaus,Physical properties of carbon nanotubes (Im- perial College Press, 1998).
3 A. Jorio, G. Dresselhaus, and M. S. Dresselhaus, Carbon Nanotubes: Advanced Topics in the Synthesis, Structure, Properties and Applications (Springer-Verlag, 2008).
4 J. Hone, M. Whitney, C. Piskoti, and A. Zettl, Physical Review B 59, R2514 (1999).
5 S. Berber, Y.-K. Kwon, and D. Tom´anek, Physical Review Letters 84, 4613 (2000).
6 S. Maruyama, Microscale Thermophysical Engineering7, 41 (2003).
7 S. Maruyama, Physica B 323, 193 (2002).
8 C. Yu, L. Shi, Z. Yao, D. Li, and A. Majumdar, Nano Letters 5, 1842 (2005).
9 E. Pop, D. Mann, Q. Wang, K. Goodson, and H. Dai, Nano Letters 6, 96 (2006).
10 S. Maruyama, Y. Igarashi, Y. Taniguchi, and J. Shiomi, Journal of Thermal Science and Tech- nology 1, 138 (2006).
11 J. Shiomi and S. Maruyama, Physical Review B 73, 205420 (2006).
12 J. Lukes and H. Zhong, Journal of Heat Transfer129, 705 (2007).
13 J. Shiomi and S. Maruyama, Japanese Journal of Applied Physics 47, 2005 (2008).
14 M. B. Bryning, D. E. Milkie, M. F. Islam, J. M. Kikkawa, and A. G. Yodh, Applied Physics Letters 87, 161909 (2005).
15 M. J. Biercuk, M. C. Llaguno, M. Radosavljevic, J. K. Hyun, A. T. Johnson, and J. E. Fischer, Applied Physics Letters 80, 2767 (2002).
16 S. U. S. Choi, Z. G. Zhang, W. Yu, F. E. Lockwood, and E. A. Grulke, Applied Physics Letters 79, 2252 (2001).
17 A. B. Dalton, S. Collins, E. Munoz, J. M. Razal, V. H. Ebron, J. P. Ferraris, J. N. Coleman, B. G. Kim, and R. H. Baughman, Nature 423, 703 (2003).
18 J. K. W. Sandler, J. E. Kirk, I. A. Kinloch, M. S. P. Shaffer, and A. H. Windle, Polymer 44, 5893 (2003).
19 S. T. Huxtable, D. G. Cahill, S. Shenogin, L. Xue, R. Ozisik, P. Barone, M. Usrey, M. S. Strano,
G. Siddons, M. Shim, et al., Nature Materials2, 731 (2003).
20 E. T. Swartz and R. O. Pohl, Reviews of Modern Physics 61, 605 (1989).
21 S. Maruyama and T. Kimura, Thermal Science & Engineering 7, 63 (1999).
22 J.-L. Barrat and F. Chiaruttini, Molecular Physics 101, 1605 (2003).
23 T. Ohara and D. Suzuki, Microscale Thermophysical Engineering 4, 189 (2000).
24 S. Shenogin, L. Xue, R. Ozisik, P. Keblinski, and D. G. Cahill, Journal of Applied Physics95, 8136 (2004).
25 D. W. Brenner, Physical Review B 42, 9458 (1990).
26 Y. Yamaguchi and S. Maruyama, Chemical Physics Letters 286, 336 (1998).
27 J. Tersoff, Physical Review B 39, 5566 (1989).
28 L. Challis, K. Dransfeld, and J. Wilks, Proceedings of the Royal Society of London. Series A A260, 31 (1961).
Figure Captions
Fig. 1: (color online) (A) The different stages of the MD simulation. The matrix including the SWNT is first temperature annealed, then relaxed without heat sinks or sources. The temperature of the SWNT is then ramped up for 10 ps and the system is let to relax to a new equilibrium without temperature control. (B) The temperature is monitored during relaxation, and (C) the difference between the SWNT and the argon matrix is fitted to an exponential function, from which the relaxation time and the thermal boundary conductance can be calculated.
Fig. 2: (color online) (A) Molecular structure of the equilibrated solid argon matrix (argon density 3000 kg/m3). (B) Radial density function of the argon matrix. The density peaks reflect the crystal arrangement of the solid. Close to the SWNT the crystal structure is broken and the density is significantly higher. (C) Molecular structure of equilibrated liquid argon matrix (argon density 1200 kg/m3). (D) The density oscillation with three distinct peaks within 10 ˚A of the SWNT surface. During heat flow, the matrix radial density function does not changed significantly.
Fig. 3: (color online) Thermal boundary conductance (TBC) as a function of SWNT length (20-500 ˚A). The TBC converges to a stable value for both the solid and liquid systems and shows no apparent length dependence. The density of the solid argon and the liquid argon are 3000 kg/m3 and 1200 kg/m3 respectively.
Fig. 4: (color online) (A) The phonon energy spectrum of the 225 ˚A long (5,5) SWNT submerged in the solid argon matrix (blue line, diamonds), compared to that of an isolated SWNT with the same temperature (green line). (B) A close-up on the first 9 THz together with the phonon spectrum of the adsorbed argon layer (red line, circles). (C) The phonon spectrum of the same SWNT in the liquid argon matrix compared with the isolated case (D) A close-up of the first 9 THz compared with the vibrational spectrum of the adsorbed argon atoms. Damping is clearly visible in the spectral overlap range for both matrices.
Fig. 5: (color online) 2D phonon spectrum maps for the SWNTs in (A) solid and (B) liquid matrices. In both the solid and liquid matrices, the dispersion branches in the range that overlaps with the argon spectra (0-7 THz solid, and 0-2 THz liquid) are diffused because the phonons are scattered by interacting with the argon matrix (insets). The scattering is more pronounced in the solid matrix.
Fig. 6: (color online) Spectral temperatures in the low frequency region, Tsplow, where the SWNT spectrum overlaps with the adsorbed argon layer, and in the high frequency region, Tsphigh, where no overlap occurs, compared to the kinetic temperature of the SWNT, TSW N T, and the argon matrix, TAr. (A) Solid matrix. The spectral temperature in the low frequency region (0-7 THz) drops within 50 ps to the argon matrix temperature. (B) The difference between Tsphigh and TAr (green, squares), and the difference between Tsplow and TAr
(blue, dotted) for the solid matrix are fitted with single exponential functions. (C) Liquid matrix. Also in the liquid matrix, the spectral temperature in the low frequency region (0-2 Thz) is not in equilibrium with the rest of the SWNT but drops to the argon matrix temperature within 100 ps after the external heating is turned off. (D) The difference between Tsphigh and TAr (green, squares), and the difference between Tsplow and TAr (blue, dotted) for the liquid matrix are fitted with single exponential functions.
Table Captions
Table 1: Parameters for Lennard-Jones (LJ) potential.
50
time (ps) annealing relaxation
200 SWNT
100
K, A
B C
temperature difference (K)temperature (K)
time (ps) time (ps)
temperature difference (K)
200 150 100 50 0
0 100 200 300 400 500 600 700 800 900
300 600 900 300 600 900
surrounding matrix
fitted exponential fitted exponential
temperature difference temperature difference heat ramp
relaxationand sampling
150 250
200 150 100 50 0
FIG. 1: (A) The different stages of the MD simulation. The matrix including the SWNT is first temperature annealed, then relaxed without heat sinks or sources. The temperature of the SWNT is then ramped up for 10 ps and the system is let to relax to a new equilibrium without temperature control. (B) The temperature is monitored during relaxation, and (C) the difference between the SWNT and the argon matrix is fitted to an exponential function, from which the relaxation time and the thermal boundary conductance can be calculated.
15
-15 0
-15 0 15
width y (Å)
20
-20 0
-20 0 20
0 2 4 6 8 10 12 0
5 10
15 equilibrium
heat flow
0 5 10 15
0 1 2 3 4 5 6 width x (Å)
width y (Å)
width x (Å)
radius (Å)
radius (Å)
3 density (kg/m )
C
103
103
3 density (kg/m )
D
A B
equilibrium heat flow
FIG. 2: (A) Molecular structure of the equilibrated solid argon matrix (argon density 3000 kg/m3).
(B) Radial density function of the argon matrix. The density peaks reflect the crystal arrangement of the solid. Close to the SWNT the crystal structure is broken and the density is significantly higher. (C) Molecular structure of equilibrated liquid argon matrix (argon density 1200 kg/m3).
(D) The density oscillation with three distinct peaks within 10 ˚A of the SWNT surface. During heat flow, the matrix radial density function does not changed significantly.
0 100 200 300 400 500 0.5
1 1.5
2 2.5
3 3.5
thermal boundary conductance, TBC (MW/m )2
tube length (Å)
SWNT in solid matrix SWNT in liquid matrix
FIG. 3: Thermal boundary conductance (TBC) as a function of SWNT length (20-500 ˚A). The TBC converges to a stable value for both the solid and liquid systems and shows no apparent length dependence. The density of the solid argon and the liquid argon are 3000 kg/m3 and 1200 kg/m3 respectively.
0 2 4 6 8 0
0.05 0.1 0.15 0.2 0.25 0.3
frequency (THz)
normalized intensity (a.u.)
isolated in solid matrix
argon layer
0 10 20 30 40 50 60
0 0.2 0.4 0.6 0.8 1
frequency (THz) isolated in solid matrix
A B
B
0 2 4 6 8
0 0.05 0.1 0.15 0.2 0.25 0.3
frequency (THz)
normalized intensity (a.u.)
in liquid matrix argon layer
B
D
0 20 40 60
0 0.2 0.4 0.6 0.8 1
frequency (THz) isolated in liquid matrix C
D
10 30 50
isolated
FIG. 4: (A) The phonon energy spectrum of the 225 ˚A long (5,5) SWNT submerged in the solid argon matrix (blue line, diamonds), compared to that of an isolated SWNT with the same temperature (green line). (B) A close-up on the first 9 THz together with the phonon spectrum of the adsorbed argon layer (red line, circles). (C) The phonon spectrum of the same SWNT in the liquid argon matrix compared with the isolated case (D) A close-up of the first 9 THz compared with the vibrational spectrum of the adsorbed argon atoms. Damping is clearly visible in the spectral overlap range for both matrices.
frequency (THz)
0 0.5 1
0 5 10 15 20 25 30 35 40 45 50
B
wave number k (Å )−1
frequency ( THz)
0 0.5 1
0 2 4 6 8
0 0.5 1
0 5 10 15 20 25 30 35 40 45 50
frequency (THz)
0 0.5 1
0 5 10 A
wave number k (Å )−1
frequency (THz)
wave number k (Å )−1
wave number k (Å )−1
FIG. 5: 2D phonon spectrum maps for the SWNTs in (A) solid and (B) liquid matrices. In both the solid and liquid matrices, the dispersion branches in the range that overlaps with the argon spectra (0-7 THz solid, and 0-2 THz liquid) are diffused because the phonons are scattered by interacting with the argon matrix (insets). The scattering is more pronounced in the solid matrix.
0 100 200 300 400 100
150 200 250 300 350
time (ps) TSWNT
TAr
Tlow
Thigh
C
0 50 100 150 200
0 50 100 150 200 250
time (ps)
spectral temperature (K)
TSWNT
TAr
Tlow
Thigh A
0 50 100 150 200
−50 0 50 100 150 200
time (ps)
∆ spectral temperature (K)
Thigh−T
Ar
τhigh−Ar = 60 ps
Tlow−TAr τlow−Ar = 2 ps B
0 100 200 300 400
−50 0 50 100 150 200
time (ps) Tlow−T
Ar
τlow−Ar = 44 ps Thigh−TAr τhigh−Ar = 338 ps D
spectral temperature (K) ∆ spectral temperature (K)
FIG. 6: Spectral temperatures in the low frequency region, Tlow
sp , where the SWNT spectrum overlaps with the adsorbed argon layer, and in the high frequency region,Tsphigh, where no overlap occurs, compared to the kinetic temperature of the SWNT, TSW N T, and the argon matrix, TAr. (A) Solid matrix. The spectral temperature in the low frequency region (0-7 THz) drops within 50 ps to the argon matrix temperature. (B) The difference between Tsphigh and TAr (green, squares), and the difference between Tlow
sp and TAr (blue, dotted) for the solid matrix are fitted with single exponential functions. (C) Liquid matrix. Also in the liquid matrix, the spectral temperature in the low frequency region (0-2 Thz) is not in equilibrium with the rest of the SWNT but drops to the argon matrix temperature within 100 ps after the external heating is turned off. (D) The difference between TsphighandTAr (green, squares), and the difference between Tlow
sp andTAr (blue, dotted) for the liquid matrix are fitted with single exponential functions.
TABLE I: Parameters for Lennard-Jones (LJ) potential
ǫ(eV) σ (˚A)
Argon-Argon 10.33 3.40
Argon-Carbon 4.98 3.38