Thermal conductivity enhancement of liquid and solid with single-walled carbon nanotubes
(単層CNTを用いた液体/固体の熱伝導率増大効果)
シブシャンカラン ハリーシュ
Thermal conductivity enhancement of liquid and solid with single-walled carbon nanotubes
(単層CNTを用いた液体/固体の熱伝導率増大効果)
Approved, Thesis committee:
Shigeo Maruyama, Thesis advisor Professor, Department of Mechanical Engineering The University of Tokyo, Japan.
Yuji Suzuki Professor, Department of Mechanical Engineering The University of Tokyo, Japan.
Hirofumi Daiguchi Associate Professor, Department of Human and Engineered Environmental Studies The University of Tokyo, Japan.
Junichiro Shiomi Associate Professor, Department of Mechanical Engineering The University of Tokyo, Japan.
Shohei Chiashi Lecturer, Department of Mechanical Engineering The University of Tokyo, Japan.
Declaration
I, hereby declare that the investigation presented in the thesis entitled “Thermal conductivity enhancement of liquid and solid with single-walled carbon nanotubes”
submitted to The University of Tokyo, Japan for the award of Doctoral degree is the record of work carried out by me during the period from October 2010 to August 2013 under the supervision of Dr. Shigeo Maruyama. The work is original and has not been submitted earlier as a whole or in part for a degree at this or any other academic institutions.
Abstract
Fluids with higher thermal conductivities are necessary for cooling applications especially in micro-electronic devices. The low thermal conductivity of conventional heat transfer fluids remains a limitation in improving the performance of micro-electronic cooling systems. Metallic and metal oxide particles possess significantly higher thermal conductivity than those of the conventional heat transfer fluids. Hence it is speculated that the addition of such highly conductive particles may enhance the thermal conductivity of heat transfer fluids. Advancement in the development of Nano science and Nanotechnology in the last decade have attracted the heat transfer engineers to utilize nano sized particles for this purpose because of their stability against sedimentation and, as a result, reduction in potential for clogging a flow circulating system. Recent experimental reports of anomalous enhancements in thermal conductivity above the predictions of classical Maxwell theory with low volume fraction of metallic and metallic oxide nano-particles have drawn much focus among the heat transfer researchers. This has led to numerous experimental and numerical investigations on the thermal conductivity of nanofluids suspensions.
Despite numerous efforts, it still remains unclear whether the thermal conductivity enhancement in nanofluids is anomalous or within the predictions of classical theories.
Non reproducibility and lack of agreement among the nanofluids community is due to the lack of proper materials synthesis and characterization techniques and inability to form suspensions with long term stability.
To understand the real potential of nanofluids, systematic investigation of the thermal conductivity enhancement is carried out with spherical, one-dimensional and two dimensional carbon allotropes is carried out in this present research. Single-walled carbon nanohorns, single-walled carbon nanotubes and exfoliated graphite nanoplatelets were used as the nano inclusions. Stable nanofluids suspensions were created using sodium deoxycholate as the surfactant in water and ethylene glycol. The nanofluid suspensions were thoroughly characterized using transmission electron microscopy, optical absorbance spectroscopy, dynamic light scattering, photoluminescence spectroscopy and atomic force microscopy.
Thermal conductivity measurements were carried out using a custom built transient hot- wire technique for different temperature and loadings of nano inclusions. Thermal conductivity enhancement results were analyzed based on effective medium theory considering the role of interfacial thermal resistance into account. The experimental results reveal that the aspect ratio of the nano inclusion plays a significant role in the thermal conductivity improvement owing to its high specific surface area and ability to form high heat transport pathways.
Experimental results show that two-dimensional inclusions lead to higher thermal conductivity improvement followed by one-dimensional and spherical inclusions. It was also found that the thermal conductivity enhancement in ethylene glycol is higher than the case of water irrespective of the nature of nano inclusion. Dynamic light scattering studies, optical absorbance and atomic force microscopy clearly reveals the nature of
agglomeration is different in the case of ethylene glycol compared to the case of water.
This leads to the conclusion that the particle agglomeration has a profound effect in the thermal conductivity enhancement of nanofluid suspensions. The experimental results are in reasonable agreement with the predictions of effective medium approach which leads to the conclusion that the thermal conductivity enhancement in nanofluids is ‘not anomalous’ and the classical heat conduction approach holds for well characterized and stable suspensions.
In the last part of this work, fine tuning the thermal conductivity enhancement via temperature regulation is demonstrated for a phase change alkane by successively melting and freezing the alkane with different nano inclusions. Solidification of n- Octadecane resulted in higher thermal conductivity enhancement in the solid state compared to the liquid state irrespective of the dimensionality of the nano inclusion. In the solidified state carbon nanotubes outperformed graphite nanoplatelets and carbon nanohorns due to their ability to form percolating networks at low loading. It is hypothesized that this phase-dependent enhancement is due to the formation of a quasi- two-dimensional percolating structure, which is formed by the nanotubes during the phase transition. The present experimental results will stimulate further theoretical research on developing models to explain such behaviour, and will contribute to the development of high conductivity thermal energy storage materials for buildings and in solar power plants.
x
xi
Acknowledgements
I would like to express my sincere heart of gratitude to my advisor Professor Shigeo Maruyama for his support and encouragement to complete my research successfully. He gave me the freedom to choose a topic and mold my project together and provided invaluable insight and support. His valuable suggestions and guidance filled me with courage and confidence whenever I was let down by various problems during the research.
I am particularly grateful to Dr. Junichiro Shiomi who gave consistent feedback on my research topic throughout my stay. I would also like to thank Dr. Shohei Chiashi for helping on many occasions in the laboratory, and giving feedback on my thesis. I also like to thank Professor Yamaguchi in Chemical Engineering department for providing facilities to perform Dynamic Light Scattering measurements. I would also like to thank Yamamoto san at AIST for his willingness to help performing viscosity measurements. I also appreciate the technical support from Mr. Watanabe in the laboratory.
I also wish to thank all my colleagues in the lab for their kind help and friendship during the period of my graduation thesis. I would like to thank Dr. Kei Ishikawa who helped me in many ways while the design of my experimental setup. I would also like to thank Dr.
Shinya Aikawa and Taiki Inoue for their tremendous support in TEM and AFM
xii
measurements. I would also like to thank Dr. Erik Einarsson and Dr. Pei Zhao who spent plenty of time to discuss the spectroscopic analysis results. I also like to thank my friend Theerapol Thurakitseree and junior members Sho Hida, Takuma Hori and Yoshinori Nakamura who helped me in many ways throughout my stay.
I also could not have reached this milestone without the support and tolerance of my family and friends. I owe my mother big thanks for providing me with all of the opportunities and support. I also wish to thank my soon to be wife Sowmyaa for her patience and affection which helped to get to this point.
xiii
List of Tables
Table 1.1: Summary of thermal conductivity values reported for SWCNTs and MWCNTs Table 1.2: Summary of Molecular dynamics results of thermal conductivity of SWCNTs Table 1.3: Summary of thermal conductivity enhancement of CNT nanofluids
Table 3.1: Activation Energy of SWCNT/water nanofluids from viscosity measurements
xiv
xv
List of Figures
Figure 1.1: ITRS Prediction of the performance of single chip microprocessors [1].
Figure 1.2: Structure of CNT
Figure 1.3: Diameter dependent thermal conductivity of CNTs
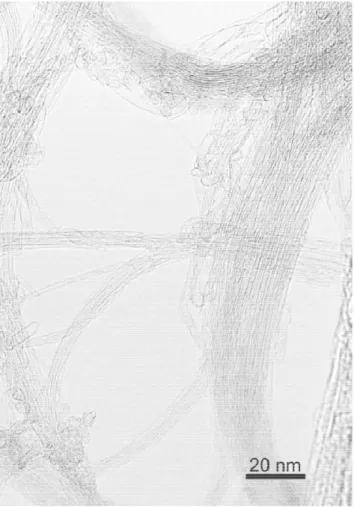
Figure 2.1: TEM image of SWCNTs synthesized from ethanol feedstock. Image captured at an acceleration voltage of 120 kV.
Figure 2.2: Resonance Raman spectra of ACCVD SWCNTs. The G-band, D-band and the radial breathing mode (RBM) peaks are shown. An expanded view of the RBM signals with an added diameter scale is shown in the inset.
Figure 2.3: Thermogravimetric analysis of SWCNTs. Measurement was performed at a heating rate of 0.5 °C/min.
Figure 2.4: Chemical structure of Sodium deoxycholate (C24H39NaO4)
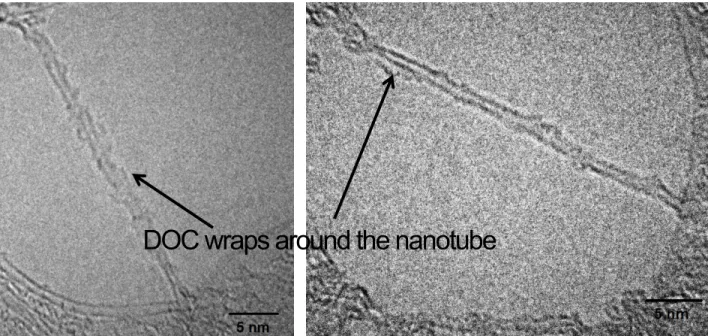
Figure 2.5: TEM visualization of surfactant-encapsulated SWCNTs. Image captured at an acceleration voltage of 200 kV.
Figure 2.6: Size distribution of SWCNTs in water
Figure 2.7: Size distribution of SWCNTs in Ethylene Glycol
Figure 2.8: UV-Vis-NIR absorbance spectrum of SWCNTs dispersed in water and EG using DOC as the surfactant.
Figure 2.9: Photoluminescence excitation map of SWCNT/water nanofluid. Figure 2.9 (b) corresponds to the PLE map taken at 0.005 vol %. Figure 2.9(b) corresponds to the PLE map taken post centrifugation. Improved signal intensity due to the elimination of bundles is clearly evident in Figure 2.9(b).
xvi
Figure 2.10: (a) AFM image of surfactant-encapsulated SWCNTs post sonication (SWCNT loading – 0.005 vol %). (b): Size wise length distribution of the SWCNTs.
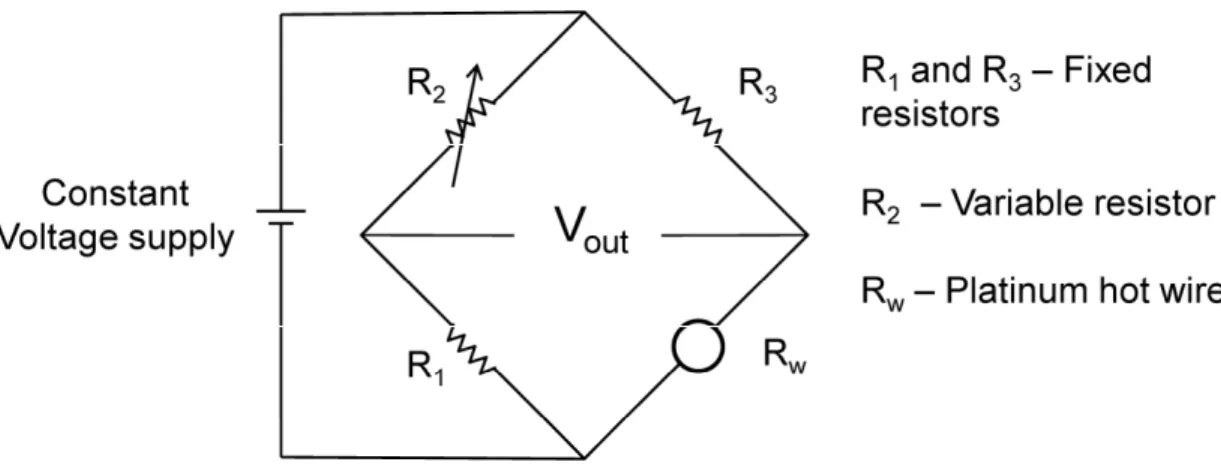
Figure 2.11: Schematic representation of the Transient Hot Wire (THW) setup
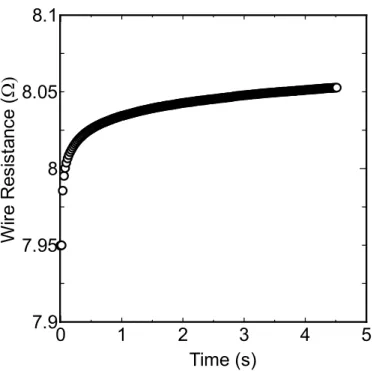
Figure 2.12: Resistance change of the THW when a constant voltage supply is provided.
Figure 2.13: Temperature raise as a function of time
Figure 2.14: Logarithm of time Vs Temperature Rise
Figure 2.15: Comparison of thermal conductivity values measured in this work with the reference literature. Open and filled circles correspond to the measured thermal conductivity of water (top) and EG (bottom), respectively. Solid lines correspond to the literature data.
Figure 2.16: Thermal conductivity enhancement as a function of ratio of nanoparticle thermal conductivity to base fluid conductivity from Maxwell’s model.
Figure 2.17: Thermal conductivity enhancement as a function of ratio of nanoparticle thermal conductivity to base fluid conductivity from Hamilton – Crosser model for cylindrical inclusions.
Figure 2.18: Thermal conductivity enhancement as a function of aspect ratio without taking thermal boundary resistance by EMT model.
Figure 2.19: Thermal conductivity enhancement as a function of thermal boundary resistance for varying aspect ratio of 1 vol % CNTs.
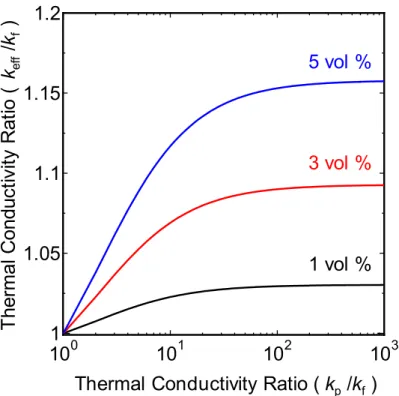
Figure 2.20: Thermal conductivity enhancement as a function of ratio of CNT thermal conductivity to base fluid conductivity from EMT model considering the effect of thermal boundary resistance.
xvii
Figure 2.21: Thermal conductivity enhancement as a function of ratio of CNT thermal conductivity to base fluid conductivity from Yamada - Ota model considering the effect of thermal boundary resistance.
Figure 3.1: Thermal conductivity enhancement of Ethylene Glycol as a function of SWCNT Loading.
Figure 3.2: Thermal conductivity enhancement of Water as a function of SWCNT Loading.
Figure 3.3: Electrical Conductivity of SWCNT/water nanofluids. A two-parameter fit as per classical percolation theory [81] yielded a low percolation threshold of 0.0152 vol %.
Figure 3.4: Thermal conductivity increase as a function of SWCNT loading in Water and Ethylene Glycol
Figure 3.5: Thermal conductivity increase as a function of fluid temperature in Water Figure 3.6: Comparison of thermal conductivity improvement during the heating and cooling process in water (SWCNT loading: 0.3 vol. %). The effective conductivity enhancement remains the same with respect to temperature irrespective of whether the fluid is heated or cooled.
Figure 3.7: Temperature dependent thermal conductivity in SWCNT/water and SWCNT/EG nanofluids. Open circles correspond to base fluid measurements and open triangles correspond to SWCNT nanofluids.
Figure 3.8: Rotational Diffusion co-efficient of water based nanofluid as a function of SWCNT length
Figure 3.9: (a) Thermal conductivity enhancement of ethylene glycol compared with H-C model. (b) Thermal conductivity enhancement of water compared with H-C model.
xviii
Figure 3.10: Comparison of experimental results of Ethylene Glycol with EMT model and Yamada-Ota model.
Figure 3.11: Comparison of experimental results of water with EMT model and Yamada- Ota model.
Figure 3.12: AFM visualization of 0.05 vol % SWCNTs. The presence of smaller aggregates and percolated networks to form a long heat transport path is clearly seen.
Figure 3.13: Viscosity of SWCNT/water nanofluids
Figure 3.14: Arrhenius Plot of viscosity of SWCNT/water nanofluids.
Figure 3.15: Effective viscosity of water and EG based nanofluids with SWCNT inclusions.
Figure 3.16: Shear Rate dependent viscosity of EG/SWCNT based nanofluids.
Figure 4.1: Scanning Electron Microscopy Visualization of (a) Single Walled Carbon Nanohorns (SWCNH) (b) Exfoliated Graphite Nanoplatelets (GnP).
Figure 4.2: Transmission Electron Microscopy Visualization of (a) Single Walled Carbon Nanohorns (SWCNH) (b) Exfoliated Graphite Nanoplatelets (xGnP).
Figure 4.3: AFM visualization of xGnP. The graphite flake thickness distribution lies in the range of 4-10 nm predominantly.
Figure 4.4: Size distribution of SWCNH in water Figure 4.5: Size distribution of SWCNH in EG
Figure 4.6: Enhanced thermal conductivity of Water as a function of SWCNH Loading and comparison with theoretical models. Predictions of Maxwell’s model are in good agreement with the experimental results.
xix
Figure 4.7: Enhanced thermal conductivity of EG as a function of SWCNH Loading and comparison with theoretical models. The experimental results are approximately a factor 2 higher than the predictions of Maxwell’s model. Similar results are obtained for SWCNH/Octadecane (OD) suspensions. For Nano-diamond/Ethylene Glycol suspensions the enhancement is marginally higher than Maxwell model’s prediction. The experimental results are fitted using EMT model assuming the aggregates to acts as rods of aspect ratio 10. EMT model predictions with and without the presence of TBR is also shown.
Figure 4.8: Enhanced thermal conductivity of water/GnP nanofluids and comparison with EMT prediction.
Figure 4.9: Enhanced thermal conductivity of EG/GnP nanofluids and comparison with EMT prediction.
Figure 4.10: Effect of fluid temperature on the thermal conductivity enhancement in carbon based nanofluids.
Figure 5.1: Comparison of the GnP (graphene nanoplatelets) dissolved into OD (n- octadecane) with different loadings and the graphite dispersed into n-hexadecane reported by Zheng et al. [137]. Sharp increase in thermal conductivity is noticed during freezing with two dimensional graphite nanoplatelets as inclusions.
Figure 5.2: (a) Thermal conductivity of n-Octadecane as a function of temperature for varying SWCNT loadings. The freezing point of the n-Octadecane is approximately 300 K. A sharp increase in thermal conductivity in the solid state is seen. (b) Contrast ratio (solid state thermal conductivity to liquid state thermal conductivity) as a function of SWCNT loading. Maximum contrast ratio of 2.92 is achieved at a SWCNT loading of
xx
0.25 wt %. (c) Thermal conductivity enhancement as a function of temperature for different SWCNT loading.
Figure 5.3: Recycling behaviour of thermal conductivity during successive phase transition cycles at SWCNT loading of 0.25 wt %. Arrows indicate the sequence of cycles.
Figure 5.4: (a) Thermal conductivity enhancement in liquid state as a function of SWCNT loading. Modified Yamada-Ota model predict the present experimental results with a TBR of 2.5 x 10⁻⁸ m2KW-1. EMT model prediction for the same TBR in the liquid state is marginally lesser compared to modified Yamada-Ota model. (b) Thermal conductivity enhancement in solid state as a function of SWCNT loading. The theoretical models fail to predict the enhancement in solid state as the influence of aggregation during first order phase transition is not included in the models. The experimental results were fitted with a power law equation of form Awb where A and b were fitting constants and w is the SWCNT weight fraction. The fit parameters were 12.6 and 1.53 for A and b respectively.
Figure 5.5: (a) Differential Scanning Calorimetry plot of melting cycle in n-octadecane and n-octadecane/SWCNT nano composite. (b) Differential Scanning Calorimetry plot of freezing cycle in n-octadecane and n-octadecane/SWCNT nano composite. Note that the peaks are shifted by 3.5 ºC for calibration correction of the DSC.
xxi
Table of Contents
Abstract v
Acknowledgements ix
List of Tables xi
List of Figures xiii
Chapter 1
Introduction 1.1 Electronics Cooling 231.2 Concept of Nanofluids 25
1.3 Enhanced Thermal Conductivity of Nanofluids with Spherical Inclusions 25
1.4 Thermal Conductivity of Carbon Nanotubes 27
1.4.1 Experimental Measurement of Thermal Conductivity of CNTs 29
1.4.2 Molecular Dynamics Simulations of Thermal Conductivity of CNTs 33
1.5 Review of Thermal Conductivity Enhancement in CNT Based Nanofluids 37
1.6 Mechanism of heat conduction in nanofluids 41
1.7 Objective of present work 43
1.8 Organization of the thesis 44
Chapter 2
Materials, Experimental methods and Models 2.1 Synthesis of Single-Walled Carbon Nanotubes from Alcohol 47xxii
2.2 Transmission Electron Microscopy (TEM) Raman Spectroscopy and
Thermogravimetric Analysis (TGA) Characterization 47 2.3 Nanofluid Preparation and Characterization 52 2.3.1 Preparation of SWCNT-based nanofluids 52
2.3.2 Nanofluids Characterization 56
2.3.3 Dynamic Light Scattering 57
2.3.4 Optical absorption and Photoluminescence Characterization 60
2.4 Measurement Methods 64
2.4.1 Thermal Conductivity Measurement 64 2.4.2 Description of the Transient Hot-Wire Method 65 2.4.3 Experimental Setup 68 2.4.4 Calibration of the THW Setup and Uncertainty Analysis 71 2.4.5 Electrical Conductivity Measurements 73
2.4.6 Viscosity Measurements 74
2.5 Thermal Conductivity Models and the Role of Thermal Boundary Resistance 75
2.6 Viscosity Models 84
2.7 Conclusions 86
Chapter 3
Enhanced Thermal Transport in Ethylene Glycol and Water with Single Walled Carbon nanotube Inclusions
3.1 Introduction 87
3.2 Experiments Results of Thermal and Electrical Conductivity Measurements 87
xxiii
3.3 Temperature Dependence 93
3.4 Viscosity of Nanofluids and Nanofluids Favourability 104
3.5 Conclusions 109
Chapter 4
Effect of Carbon Nano Additive Dimensionality in the Thermal Conductivity Enhancement of Nanofluids
4.1 Introduction 111
4.2. Materials and Methods 111
4.3 Enhanced Thermal Conductivity with SWCNH and GnP 115
4.4 Conclusions 122
Chapter 5
Enhanced Thermal Conduction Characteristics of Phase Change Composites with Single Walled Carbon Nanotube Inclusions
5.1 Introduction 123
5.2 Thermal Conductivity in Phase Change Materials 123 5.3 Materials and Methods 125 5.4 Experimental Results and Discussion 126
5.5 Conclusions 136
Chapter 6
Conclusions and Scope for Future Research 137
xxiv
Bibliography
141Appendix
A Signal analysis of the transient hot wire setup 159 B Uncertainty analysis of the transient hot wire setup 161 C Background Correction for Optical Absorbance from Ethylene Glycol Based
Nanofluids. 165
D Dynamic Light Scattering, Optical Absorbance and Photoluminescence results of SWCNT/water based nanofluids for varying concentrations. 167 E Electrical Conductivity Measurements using Linear Sweep Voltage Supply 171 F Shear Rate Data of Cannon Fenske Viscometer 173 G Influence of Sonication Time on the Thermal Conductivity Enhancement 175 H Viscosity Measurements of SWCNH and GnP based Nanofluids 177 I One-Dimensional Steady State Thermal Conductivity Measurements of Phase
Change Nano Composites 181
J Contrasting Thermal Conductivity in Phase Change Alkanes with SWCNH
inclusions 187
List of Publications 189
Chapter 1
Introduction
1.1 Electronics Cooling
Cooling has become one of the major challenges in the generation of micro/nanotechnology.
In a broad spectrum of fields such as micro and nano electronics, automobiles and manufacturing, the performance of the systems are greatly hindered by the absence of efficient cooling methods. Micro and nano electronic devices unavoidably produce heat, which need to be minimized to prevent the failure of the device. The necessity to reduce the chip size and increase the speed and performance of such electronic devices has lead to the development of high density multi-chip packaging which has lead to high heat dissipation requirements.
The International Technology Roadmap for Semiconductor (ITRS), 2012 report [1] projects the performance of the processors to increase from 6.82 GHz in 2012 to 16.18 GHz in 2026.
The ITRS projection for the performance of single-chip microprocessor is shown in Figure 1.1. Increasing the processor performance often results in the dissipation of higher power density which in turn demands a proper cooling system. However, the lack of a sufficient cooling system remains a concern to meet the projected trajectory of ITRS. It is apparent
from these predictions that meet the roadmap set by ITRS, more efficient cooling solutions are required.
Figure 1.1: ITRS prediction of the performance of single chip microprocessors [1].
The most widely used cooling method adapted to this date for electronics cooling has been forced air convection, but this method has a serious limitation due to its inability to meet with the increasing level of heat flux due to the necessary increase in size of the metal fin-array heat sinks [2]. An alternative to this approach is the utilization of single phase micro-fluidic heat sinks [3]. However, this technology also has significant limitation owing to the thermal
2010 2015 2020 2025 2030 8
10 12 14 16 18
P er for m anc e ( G H z)
Year
properties of the cooling fluid. Conventional heat transfer fluids exhibit poor heat transfer performance due to their inherent low thermal conductivities.
1.2 Concept of Nanofluids
Fluids with inclusions of higher thermal conductivity particles are being considered as an option to improve the thermal properties of such fluids with a minimal increase in viscosity.
Many research activities have been carried out in the past to improve the thermal properties of these fluids by seeding a small quantity of highly thermally conductive macro/micro sized particles in it [4]. However, this has not been very successful because of settling of the solid particles due to their large size [4]. Recent developments in the field of nanoscience have led to the development of a new class of fluids termed “nanofluids” [5]. Over the past decade, nanofluids—colloidal dispersions prepared by uniformly dispersing nanostructures such as nanoparticles, nanotubes and nanosheets in conventional heat transfer fluids—have gained attraction worldwide because of their superior thermal performance [6-8].
1.3 Enhanced Thermal Conductivity of Nanofluids with Spherical Inclusions
Many research groups experimentally reported a substantial increase in the thermal conductivity [7] and the convective heat transfer coefficient [6] of such fluids. The first measurements of the thermal conductivity enhancement with ultrafine particles in fluid were reported by Masuda et al [9]. They reported thermal conductivity enhancements of SiO2, TiO2, and Al2O3 in water at various particle volume fractions. Later, Argonne National
Research Laboratory reported an ‘anomalous’ enhancement in the thermal conductivity up to 40 % at 0.3 vol % of dispersed copper and copper oxide nanoparticles in ethylene-glycol and termed such fluids as “nanofluids” [10]. Patel et al. [11] showed that ultra-low inclusion of 0.026 vol % of silver nanoparticles in water and toluene, resulted in a thermal conductivity enhancement of 5-21 % [8]. The reported enhancements in thermal conductivity were considered to be “anomalous” and cannot be predicted by Maxwell’s theory [12].
Nanofluids consisting of spherical particles have used various metals and metallic oxides.
These predominantly include copper, copper oxide, aluminum, aluminum oxide, zinc oxide, titanium dioxide, gold, silver etc [6-8]. Studies on thermal conductivity enhancement of nanofluids for varying particle volume fraction show conflicting results. Very high improvement in the thermal conductivity was reported with the inclusion of spherical particles by few researchers [10, 11, 13-15] while many research groups failed to observe such anomalous improvement [16-20].
Most importantly the dependence of thermal conductivity enhancement as a function of temperature reported by Das et al. [21] sparked much interest on the mechanism surrounding the thermal conductivity enhancement in nanofluids. Many reports show an increase in thermal conductivity with increase in temperature of the base fluid [22-25] while a least/no significant effect was shown by few groups [26-28]. There also exist few reports which report a reduction in thermal conductivity as a function of temperature [29, 30].The effect of temperature on the thermal conductivity enhancement and the mechanism surrounding the contradictory results still remains unclear and highly controversial.
There are also conflicting reports on the effect of nanoparticle size on thermal conductivity enhancement of nanofluids. Few reports show an enhancement with decrease in particle size because of the increase in specific surface area as the size of the nanoparticle decreases [13, 15, 24] whereas few reports show a contradictory behaviour [22]. Many reports show an increase in thermal conductivity enhancement with decrease in base fluid conductivity while a recent study show the thermal conductivity of base fluid has least effect on the thermal conductivity enhancement [20]. Similarly, the role of thermal conductivity of nano material also remains unclear. Significant reports show that higher the thermal conductivity of the nanomaterial greater is the thermal conductivity enhancement while other reports show that the thermal conductivity of nano particles is not necessarily a primary factor for it. Thermal conductivity enhancement studies in alumina based nanofluids with particle shapes of platelets, blades, cylinders and bricks showed that the enhancement follows the sequence as platelets<bricks<cylinders indicating the role of particle shape in the thermal conductivity enhancement [31]. A recent benchmark study carried out by 33 research groups found no such anomalous improvement happens with spherical nanoparticles but high improvement for the inclusion of cylindrical structures [32]. Their results show that the particle shape/aspect ratio is an important factor to increase the thermal conductivity of fluids. The influence on thermal conductivity increment caused by seeding the above-mentioned spherical particles in different base fluids has been well summarized by several researchers [7, 8, 33-35].
1.4 Thermal Conductivity of Carbon Nanotubes
Among nano suspensions, those seeded with cylindrical structures namely carbon nanotubes have gained interest recently. The discovery of carbon nanotubes (CNTs) by Iijima in 1991 [36] spawned a tremendous amount of research, largely due to its remarkable mechanical, thermal and electrical properties. Experimental and numerical studies have reported very high thermal conductivity for CNTs. Hence, it is natural to expect that the suspensions consisting of CNTs would result in higher thermal conductivity increase compared to other nanoparticles.
The structure of CNT is shown in Figure 1.2. A carbon nanotube consists of an atomic layer of carbon atom which is rolled into the form of a tubular structure. The axis of the CNT can form along many different directions (i.e. chiral vectors (n,m)) in the carbon layer, yielding CNTs with different chiralities and diameters. Multi-walled carbon nanotubes (MWCNTs) include several concentric tubes that can have varying chiralities and diameters. Single walled carbon nanotubes usually have armchair (n,n) or zigzag (n,0) and other chiralities (n,m). Armchair (n,n) nanotubes are always metallic, while zigzag (n,0) and other (n,m) chiralities are semiconducting [37]. Heat conduction in CNTs is always dominated by the phonons rather than electrons even in the metallic nanotubes. The phonon conduction in CNTs is influenced by several factors such as the number of phonon active modes, boundary scattering, the diameter and length of the nanotubes, structural defects and also on the presence of impurities [38].
Figure 1.2: Structure of CNT (Image Source: Wikipedia)
1.4.1 Experimental Measurements of Thermal Conductivity of CNTs
Table 1.1 summarizes the reported values of thermal conductivity of SWCNTs and MWCNTs based on experimental methods. Hone et al. [15] estimated a room temperature thermal conductivity of 1750-5800 Wm-1K-1 for single-walled CNTs (SWCNT) based on the thermal conductivity measurements of SWCNT mats of tangled nanotube bundles. Kim et al.
[40] reported a thermal conductivity value of over 3000 Wm-1K-1 for an individual suspended MWCNT of 2.5 µm long and 14 nm diameter. They made use of an external heat source and passively generated a temperature difference by placing a heat source at one end of the nanotube. The heat generated by one resistor was detected using sensors at the other end. Yu et al.[41] measured a thermal conductivity of greater than 8000 Wm-1K-1 for SWCNTs of diameter 1 nm using the similar measurement technique. Pettes and Shi [42] recently found that the thermal conductivity of CNTs decreased with the number of walls but this is also correlated to the defect concentration of CNTs with increasing number of walls. The authors
also made use of the measurement method reported by kim et al. [40] but applied a sinusoidal heating pulse in their measurements.
Table 1.1: Summary of experimental thermal conductivity values reported for SWCNTs and MWCNTs
Reference CNT diameter
(nm)
CNT Length (µm)
Thermal Conductivity
(Wm-1K-1)
Kim et al. [40] 14 2.5 3000
Yu et al. [41] 1-3 2.6 1800-8000
Pettes and Shi [42] 1.5-12 2-4 600 - 40
Fujii et al. [43] 9.8,16.1,28.2 3.7,1.9,3.6 2800,1800,500
Choi et al. [44,45] 20,42,46 1-1.4 300,650,830
Wang et al. [46,47] 1.9 0.5,4.9,6.9 2600,3160,3210
Pop et al. [48] 1.7 2.6 3500
Li et al [49] 1.8 41 2749
Fujii et al. using a T-type sensor experimentally measured a room temperature thermal conductivity of 2069 Wm-1K-1 for an individual multi-walled nanotube (MWCNT) of 9.8 nm diameter [43]. Choi et al. [44] used the 2 pad 3ɷ technique and reported a lower thermal conductivity value of 300 Wm-1K-1 for an MWCNT of diameter 20 nm and length 1.4 µm at room temperature. Choi et al. [45] previously reported a thermal conductivity in the range of 650 - 830 W m-1 K-1 for MWCNTs of diameter 46 nm and 42 nm respectively using a 4 pad
3ɷ technique. Wang et al. [46, 47] reported a thermal conductivity value of 4500 Wm-1K-1 for a SWCNT of 1.7 nm diameter and 6.9 µm in length using 3 ɷ technique. Besides, they also showed that thermal conductivity of the nanotube is length dependent [46].
Figure 1.3: Diameter dependent thermal conductivity of CNTs
0 10 20 30 40 50
10
210
310
4T her m al C on duct iv ity ( W m
−1K
−1)
Diameter (nm)
SWCNTs MWCNTs
kim et al. [40]
Fujii et al. [43]
Yu et al. [41]
Pettes & Shi [42]
Wang et al. [46]
Pop et al. [48]
Wang et al. [47]
Pettes & Shi [42]
Choi et al. [44]
Choi et al. [45]
Pop et al.[48] measured the room temperature thermal conductivity to be around 3500 Wm-1K-1 for individual SWCNT of 1.7 nm diameter. They also reported that the thermal conductivity decreases to 1200 Wm-1K-1 when the temperature increases to 800 K. Pop et al.
[48] made use of self-heating technique to measure the thermal conductivity of suspended nanotube. In this technique, heat is generated by applying a voltage across the CNT which results in an electrical heating of the CNT. In this case the temperature distribution is deduced from the resulting electrical resistance change. Li et al. [49] reported a novel measurement technique using self-heating of CNTs and made the temperature measurements using Raman spectroscopy. They reported a thermal conductivity 1810 Wm-1K-1 and 1400 Wm-1K-1 for SWCNT of diameter 1.8 nm and MWCNT of diameter 8.2 nm respectively. A summary of the thermal conductivity of CNTs as a function of CNT diameter is shown in Figure 1.3.
1.4.2 Molecular Dynamics Simulations of Thermal Conductivity of CNTs
Another approach to compute the thermal conductivity of CNTs is using molecular dynamics (MD) simulations. MD simulations calculate the thermal transport based on the interaction potentials between the carbon atoms. In general, there are three ways to compute the thermal transport in CNTs using atomistic simulations. They are equilibrium molecular dynamics (EMD), Non-Equilibrium Molecular Dynamics (NEMD) and Homogeneous Non- Equilibrium Molecular Dynamics (HNEMD) respectively. EMD simulations use the Green – Kubo formula derived based on the linear response theory [50]. NEMD simulations use the Fourier’s conduction law to obtain the thermal conductivity by applying either a fixed
temperature gradient or heat flux to the system. HNEMD simulations apply an external field to mimic the system without actually imposing a temperature gradient or the heat flux to the system [51]. Table 1.2 summarizes the results of thermal conductivity of CNTs obtained from many of the molecular dynamics simulations in the literature.
Most of the thermal conductivity of CNTs based on MD simulations reported in the literature was performed with the chiral vector (10, 10). Based on HNEMD simulations, Berber et al.
[52] obtained a thermal conductivity of 6600 Wm-1K-1 for an isolated SWCNT. The results of their simulation showed that the thermal conductivity increases with increasing temperature and reaches a maximum at 100 K. Above this temperature the thermal conductivity decreases to 6600 Wm-1K-1 at room temperature. Periodic boundary conditions along the axis of the nanotube are utilized to approximate nanotubes of infinite length in their calculations.
Similar behaviour was reported by Osman et al. [53] with the thermal conductivity peak at 400 K. However they reported lower room temperature thermal conductivity of 1700 Wm-1K-
1. Padgett and Brenner [54]and Moreland et al. [55] found much lower thermal conductivity values compared to previous results, reporting only 160 Wm-1K-1 and 215 Wm-1K-1 respectively at room temperature at 300 K. Moreland et al. [55] found that the thermal conductivity of the CNT is length dependent. They reported that the thermal conductivity at 300 K increases from 215 Wm-1K-1 to 831 Wm-1K-1 when the length of the CNT increased from 50 nm to 1000 nm.
Maruyama [56] for a finite length of CNT also reported this length–dependence of thermal conductivity for SWCNTs up to 400 nm. However, length convergence was not found in
either of these studies. Che et al.[57] reported a length-convergent thermal conductivity of 2980 Wm-1K-1 for a 40 nm long SWCNT at 300 K. Lukes and Zhong [51] also reported a length dependent thermal conductivity of up to 375 Wm-1K-1, also for a 40 nm long SWCNT.
Mingo and Broido [58] solved the linearized Boltzmann-Peierls phonon transport equation to predict the thermal conductivity values of SWCNTs. They reported that ballistic transport occurs for short SWCNTs, thus length-convergence was not achieved. However, the thermal transport becomes diffusive as the length increases, and they report a length-convergent thermal conductivity value of 9500 Wm-1K-1 for a 100 nm long (10, 0) CNT at 316 K.
Table 1.2: Summary of Molecular dynamics results of thermal conductivity of SWCNTs Reference CNT Chirality CNT Length
(nm)
Thermal Conductivity
(Wm-1K-1)
Berber et al. [52] (10, 10) 2.5 6600
Osman et al. [53] (10, 10) 30 1700
Padgett and Brenner [54]
(10, 10) 20-300 160
Moreland [55] (10, 10) 50-1000 215
Maruyama [56] (10, 10) 250-400 250-400
Che at al. [57] (10, 10) 40 2980
Lukes and Zhong [51]
(10, 10) 40 375
The thermal conductivity values obtained by numerical methods span a wide range, and in most cases are lower than the experimentally obtained values. One major reason for this discrepancy is the choice of CNT area which influences the calculated thermal conductivity value. Berber et al. [52] calculated the area based on the assumption that tubes have an inter- wall separation of about 3.4 Å in nanotube bundles. Maruyama [56] used a ring of van der Waals thickness of 3.4 Å, while Che et al. [57] used a ring of 1 Å thickness for the cross- sectional area. The rest of the simulations calculated the area as a circle with circumference defined by the centers of the atoms around the nanotube [51, 53-55]. Variations in the length of CNT, boundary conditions, simulation methods (EMD, NEMD, and HNEMD), and interatomic potentials also contribute to the range of simulated values.
Berber et al. [52] and Lukes and Zhong [51] utilized periodic boundary conditions along the axis of the nanotube to approximate nanotubes of infinite length. Lukes and Zhong [51]
reported that with periodic boundary conditions, increasing the simulated length of the SWCNT increased the predicted thermal conductivity. They suggested that longer nanotubes have more vibrational modes which provide new pathways for heat transfer. The phonon mean free path in SWNCTs is of the order of few microns [37]. For CNTs of length shorter than the phonon mean free path, phonon scattering from free boundaries will be important.
Hence Lukes and Zhong [51] argued that CNTs modeled with periodic boundary conditions have no free boundary which artificially eliminates boundary scattering. This allows the possibility of phonon–phonon interactions as the only scattering mechanism which is the reason for high thermal conductivity values obtained by this boundary condition.
For a finite-length CNT in which the phonons are scattered at the tube ends, it is more physically meaningful to use free boundary conditions in the simulations to obtain accurate thermal conductivity values. However, in all these MD simulations, the simulated CNT length is shorter than the expected phonon mean free path and the conduction is not completely diffusive. The thermal conductivity may saturate if the simulation is extended to further longer lengths of CNTs. The simulations discussed above were usually performed using isolated (5, 5) or (10, 10) SWCNTs [51-58]. Since the structural details of the SWCNTs used for experiments were not clearly stated, it is quite difficult to directly compare the thermal conductivity values obtained from simulations. It can be concluded that there still exist a significant uncertainty in the thermal conductivity of CNTs, especially for the case of SWCNTs.
1.5. Review of Thermal Conductivity Enhancement in CNT Based Nanofluids
From the experimental and simulation results on the thermal conductivity of CNTs, it is natural to expect that nanofluids seeded with carbon nanotubes would outperform nanofluids seeded with spherical particles due to their high thermal conductivity and large aspect ratio.
In the past decade, several groups have made use of CNTs for making nanofluids and have reported thermal conductivity values of such fluids. The first experimental results on CNT- based nanofluids were reported by Choi et al. [59] They reported an enhancement of 160 % for MWCNTs dispersed in poly alpha olefin oil (PAO), and termed the enhancement
’anomalous’. The reported results were much higher than theoretical predictions, and also found a non-linear relationship with respect to the nanotube loading. The magnitude of
enhancement they reported was also very high, and much greater than the earlier reports for fluids seeded with nanoparticles. However, the authors of this work failed to describe in detail the sample preparation procedure for their experiments.
Following the work by Choi et al. [59] Xie et al. [60] measured the thermal conductivity enhancements of water, ethylene glycol and decene seeded with MWCNTs. They functionalized the CNTs by acid treatment to make the suspensions stable. Their experimental results indicate that the thermal conductivity enhancement increased with respect to the CNT volume concentration but decreased with increase in the thermal conductivity of the base fluid.
Assael et al. [61] prepared stable MWCNT dispersions in water consisting of 0.1 wt % SDS as the surfactant. They reported a maximum thermal conductivity enhancement of 38 % with 0.6 vol % MWCNT at room temperature. Assael et al. [62] also performed similar measurements with MWCNTs in water dispersed using CTAB and nanosphere AQ as the surfactants. They found an enhancement of 34 % at 0.6 vol % loading for CTAB dispersed MWCNTs. Hwang et al. [63] reported an 11.3 % increase in thermal conductivity of MWCNTs in water at 1 vol % loading. Choi et al. [64] reported a 19.4 % increase in thermal conductivity of water consisting of 1.14 wt % of SWCNTs. Liu et al. [65] measured the thermal conductivity of MWCNTs in ethylene glycol (EG) and synthetic oil. The increase of thermal conductivity was 12.4 % for ethylene glycol/MWCNT suspensions at 1 vol % while a 30 % increase was seen for synthetic oil/MWCNT suspensions at 2 vol %. Yang et al. [66]
reported an enhancement of up to 300 % for PAO consisting of only 0.35 vol % of CNTs.
Nanda et al. [67] reported an enhancement of 36 % at for SWCNT/EG nanofluids at 1 vol %.
Cherkasova et al. [68] reported a thermal conductivity enhancement of 7 % at 0.1 vol % for SDBS functionalized MWCNTs.
Wen and Ding [69] reported the temperature-dependent thermal conductivity enhancement of SDBS-dispersed MWCNTs in water. They report an approximately linear dependence of thermal conductivity enhancement for temperatures below 303 K. The dependence levels-off, however, when the temperature becomes higher than 303 K. Ding et al. [70] also reported the temperature-dependent enhancement of MWCNTs dispersed using Gum Arabic. Nasiri et al.
[71] systematically studied the temperature-dependent enhancement of SDS-encapsulated and chemically functionalized SWCNTs, DWCNTs and MWCNTs in water. They reported a linear increase in thermal conductivity with increase in temperature for SDS-encapsulated dispersions. On the other hand, level-off behaviour at temperatures above 313 K was found for dispersions consisting of chemically functionalized CNTs. Their experiments showed that suspensions consisting of SWCNTs had the highest enhancement of approximately 40 % at a loading of 0.25 wt %. From their experiments, they also showed chemically functionalized CNTs performed marginally better compared to SDS-encapsulated CNTs. A summary of the existing experimental results for CNT nanofluids are also tabulated in Table 1.3.
Table 1.3: Summary of thermal conductivity enhancement of CNT nanofluids
Type of CNT
Base Fluid
Preparation Technique
Observations Reference
MWCNT PAO No information Non-linear enhancement.
250 % at 1 vol % loading
Choi et al.
[59]
MWCNT Water, EG, decene
Chemical
Functionalization
20 %, 12 % and 8 % at 1 vol % loading for Water, EG, Decene respectively
Xie et al.
[60]
MWCNT Water SDS 38 % increase at 0.6 vol %
loading
Assael et al. [61]
MWCNT Water CTAB 34 % increase at 0.6 vol % loading
Assael et al. [62]
MWCNT Water SDS 11.4 % at 1 vol % loading Hwang et al. [63]
SWCNT Water No information 19.4 % at 1.14 wt % loading
Choi et al.
[64]
MWCNT EG, Synthetic oil
N-
hydroxysuccinimide
12.4 % increase at 1 vol % for EG. 30 % increase at 2 vol % for synthetic oil
Liu et al.
[65]
MWCNT PAO Polyisobutene
succinimide
300 % at 0.35 vol % loading
Yang et al.
[66]
SWCNT EG Chemical Functionalization
36 % at 1 vol % loading Nanda et al. [67]
MWCNT water SDBS 7 % increase at 0.1 vol % Cherkasov a et al. [68]
MWCNT Water SDBS Upto 50 % increase. Wen and
Ding [69]
MWCNT Water Gum Arabic Non-linear increase at temperature above 300 K.
Ding et al.
[70]
SWCNT, DWCNT, MWCNT
Water SDS Non-linear increase with
respect to temperature.
Nasiri et al. [71]
1.6 Mechanism of heat conduction in nanofluids
The reported thermal conductivity enhancements sparked interests among researchers to understand the mechanism behind the nanofluids. Keblinski et al. [72] and Eastman et al.
[73] proposed four possible heat conduction mechanisms. They are: Brownian motion of the nanoparticles, molecular level layering of the liquid at the liquid/solid interface, nature of heat transport (diffusive or ballistic), and the influence of nanoparticle aggregation.
Analytical calculations by Keblinski et al. [74] showed that the contribution of Brownian motion to heat transport is insignificant because the contribution due to thermal diffusion is much higher than the Brownian motion. Tsai et al. [75] performed systematic experiments on fluids with different viscosities seeded with Fe3O4 particles. From their experiments, they
showed that Brownian motion could play an important factor in the thermal conductivity enhancement. In addition to Brownian motion, liquid layering, nature of heat transport, and clustering of particles, Lee et al. [76] showed that the particle charge state influences the thermal conductivity enhancement.
Recently Gao et al. [77] performed thermal measurements and structural analysis of phase reversible materials. From their investigations they showed that particle aggregation is the major reason for thermal conductivity improvement. Biercuk et al. [78] also suggested the formation of three dimensional percolating networks as the primary reason for the conductivity enhancement from their investigation on CNT composites. Wen and Ding [69]
argued that the formation of ordered nano layer was not possible, especially in the case of surfactant-encapsulated CNTs. Due to the large diameter of CNTs they also ruled out the possibility of Brownian motion playing a significant role in heat conduction. However, the authors were not able to explain the conductivity enhancement at higher temperatures.
To summarize, all studies performed so far have reported a thermal conductivity enhancement with respect to the CNT loading. Temperature-dependent enhancement has also been reported in some cases. Attempts to interpret these contradictory thermal conductivity enhancements with CNT inclusions in the light of existing classical theoretical models showed anomalous under-estimate of measured conductivities. Classical models such as Maxwell [12], Hamilton-Crosser [79], Hashin-Shtrikman [80] did not take the aspect ratio of CNTs into account and often restricted to spherical particles. The data from different groups vary to a great extent, making it impossible to obtain a trend line directly from the available
data for CNT nanofluids. In general, most of the reports on CNT based nanofluids shows anomalous enhancement beyond the predictions of effective medium theory. The possible reasons for this discrepancy is that the lack of proper characterization techniques and knowledge on the thermal conductivity of the CNT itself. In addition, sample preparation techniques, aspect ratio of the CNTs after sonication, and purity level of the material used have not been explained in detail by many groups. Moreover there are no general mechanisms available to explain the superior thermal performance of nanofluids. Especially for nanofluids seeded with CNTs, the mechanism is far more difficult to understand due to the surface chemistry involved and the complex structure of the percolating network. The above discussion indicates other factors such as surface functionalization, aspect ratio, purity level, and straightness factor would significantly impact the thermal conductivity of CNT nanofluids.
1.7 Objective of Present Work
The objective of present work is an experimental investigation of the thermal conductivity of aqueous and non-aqueous fluids with different carbon nano additives to better understand the potential of nanofluids. The goals of the proposed work are as follows:
1) To measure the thermal conductivity increase of carbon based nanofluids in water and ethylene glycol using transient hot wire technique with well characterized single walled carbon nanotubes. SWCNT based nanofluids in water and ethylene glycol were prepared using sodium deoxycholate as the surfactant for this purpose. SWCNT
were characterized using transmission electron microscopy, resonance Raman spectroscopy, atomic force microscopy, optical absorption spectroscopy, dynamic light scattering and photoluminescence excitation spectroscopy.
2) To understand the role of temperature in the thermal conductivity enhancement and the associated mechanism behind the nanofluids. For this purpose experiments were carried out with fluids of different viscosities. Further to understand the role of Brownian motion, freezing experiments are carried out using a phase change material.
3) The role of carbon nano filler dimensionality in enhancing the thermal conductivity is investigated systematically. Single walled carbon horns and exfoliated graphite nanoplatelets are used for this purpose.
4) The experimental results of thermal conductivity enhancement with different carbon allotropes were modeled using classical theories. The possible mechanism behind the thermal conductivity enhancement, the role of nano filler shape and thermal boundary resistance is discussed.
5) Experimental prediction of viscosity of nanofluids with different carbon allotropes to probe the feasibility of nanofluids for engineering applications.
1.8 Organization of the Thesis
This thesis aims at investigating the thermal conductivity enhancement in aqueous and non- aqueous suspensions with carbon nanofillers of different dimensionality though the material of most interest is single walled carbon nanotubes. The thesis is organized as organized as follows.
Chapter 1 introduces the concept of nanofluids and gives a review of literature on thermal conductivity of single walled carbon nanotubes and thermal conduction in nanofluids.
Chapter 2 explains the synthesis of carbon nanotubes and material characterization techniques, thermal, electrical and viscosity measurement methods and theoretical models used in this research for analyzing the experimental results.
Chapter 3 reports the thermal conductivity and viscosity measurement results with single walled carbon nanotube suspensions. The experimental results are analyzed with the theoretical models and the possibility of utilizing SWCNT based nanofluids is discussed in this chapter.
Chapter 4 reports the results on thermal conductivity enhancement with single walled carbon nanohorns and exfoliated graphite filler materials.
Chapter 5 presents the unusual thermal conductivity improvement results in the solid and liquid state of phase change alkanes.
Chapter 6 summarizes the thesis and discussions for future research.
Chapter 2
Materials, Experimental Methods and Models
2.1 Synthesis of Single-Walled Carbon Nanotubes from Alcohol
Single walled carbon nanotube (SWCNTs) synthesis was synthesized by the alcohol catalytic chemical vapour deposition (ACCVD) technique. This technique employs cobalt and iron bi- metallic catalysts supported on a zeolite particle (HSZ-390HUA). It utilizes ethanol vapour as the carbon feedstock, and the reaction temperature was maintained at 800°C. Amorphous carbon impurities and metal particle impurities were dramatically suppressed at the reaction temperature of 800°C. The etching effect caused by the decomposed hydroxyl (-OH) radical, which removes carbon atoms with dangling bonds during the CVD process was reported as the reason for the high purity of the SWCNTs [81]. After CVD synthesis zeolite particles were removed by dissolving in sodium hydride solution.
2.2 Transmission Electron Microscopy (TEM) Raman Spectroscopy and Thermogravimetric Analysis (TGA) Characterization
The SWCNTs were analyzed using transmission electron microscopy (JEOL, JEM-2000EX) and resonance Raman spectroscopy. For TEM imaging, the samples were prepared by sonicating in ethanol for 30 minutes, after which 10 µl of the solution was dropped on a TEM microgrid and allowed to evaporate. A typical TEM image of the SWCNTs synthesized from
ethanol feedstock is shown in Figure 2.1. The TEM image clearly shows that the SWCNTs were devoid of both amorphous carbon and metal nanoparticle impurities.
Figure 2.1: TEM image of SWCNTs synthesized from ethanol feedstock. Image captured at an acceleration voltage of 120 kV.
Raman spectra of the SWCNTs were acquired using a micro-Raman apparatus with a 50 cm single monochromator and a CCD detector (Chromex 501is with Andor DV401-F1). An argon ion laser with a wavelength of 488 nm (2.54 eV) and a Helium–Neon laser with a wavelength of 633 nm (1.96 eV) were used to obtain the spectra. Raman scattering is an inelastic scattering of light which is used to investigate the vibrational and rotational
frequencies of atoms. In Raman scattering, an electron is excited from the valence band to the conduction band by absorbing a photon. Then the excited electron is scattered by emitting (or absorbing) phonons, and gradually reaches the valence band by emitting a photon. During this process, the interaction between phonon and electron results in the energy of the laser photons being shifted. This shift in photon energy corresponds to the vibrational frequencies of the material. A typical spectrum obtained from the SWCNT sample is shown in Figure 2.2. Two dominant features noticed in RRS are the radial breathing mode (RBM) at low frequencies and the tangential multi-feature (G-band) at higher frequencies.
Figure 2.2: Resonance Raman spectra of ACCVD SWCNTs. The G-band, D-band and the radial breathing mode (RBM) peaks are shown. An expanded view of the RBM signals with an added diameter scale is shown in the inset.
500 1000 1500
100 200 300
2 1 0.9 0.8 0.7
RBM D−band
G−band
Raman Shift (cm
−1)
In te ns ity ( ar b. u ni ts )
Diameter (nm)
E = 1.96 eV
E = 2.54 eV
RBM peaks seen in the low-frequency region (100–400 cm-1) are unique to SWCNTs and are not observed in other carbon allotropes [82]. An interesting feature of the RBM is that the RBM frequency (ωRBM) is proportional to the inverse of the nanotube diameter, following the equation ωRBM = A/dt + B, where dt (nm) is the diameter of the nanotube, and A (cm-1 nm) and B (cm-1) are empirical constants. For the present case, values of 217.8 and 15.7 are used for A and B respectively [83]. The expanded RBM signal along with the diameter scale is shown in the inset of Figure 2.2. From the inset it can be seen that the sample contains SWCNTs with diameters ranging from 0.8-1.6 nm [81].
The G-band observed at 1592 cm-1 is a characteristic feature of sp2-bonded graphitic carbon and corresponds to in-plane vibrations of the carbon atoms. In addition to the G-band and RBM, a third feature found near 1350 cm-1 (the D-band) arises from defects in the tube walls or from amorphous carbon impurities. The relative intensity of the G-band with respect to the D-band (IG/ID) is representative of the crystallinity of the SWCNTs. In the as grown sample, a large IG/ID indicates good crystallinity of the SWCNTs.
Thermo Gravimetric Analysis (TGA) is a commonly used technique to determine a material’s thermal stability and the fraction of volatile components by continuously monitoring the weight change of the material when it is heated. The SWCNTs are placed in a platinum cup that is supported on a mass balance located outside the furnace chamber. The balance is zeroed, and the SWCNTs are gradually heated at a heating rate of 0.5 °C. The TGA curve plots the TGA signal, converted to percent weight change on the Y-axis against the reference material temperature on the X-axis. Thermo gravimetric analysis of the
SWCNTs shown in Figure 2.3 reveals that the SWCNTs uniformly burnt at a temperature of 600 °C. Since amorphous carbon decomposes at around 300 °C - 500 °C, which is lower than the decomposition temperature of SWCNTs, the TGA result proved absence of amorphous carbon impurities. The TEM investigation, the Raman spectra, and the TGA analysis showed the absence of structural defects or impurities such as metals or amorphous carbons in the ACCVD grown SWCNTs.
Figure 2.3: Thermogravimetric analysis of SWCNTs. Measurement was performed at a heating rate of 0.5 °C/min.
0 20 40 60 80 100
200 400 600 800 1000
0 50 100
TG %DTG %/min
Temperature (ºC)
2.3 Nanofluid Preparation and Characterization
2.3.1 Preparation of SWCNT-Based Nanofluids
An important prerequisite for a nanofluid is the preparation of a stable and homogenous suspension. Single-step and two-step synthesis techniques have been commonly adopted to prepare nanofluid dispersions. The single-step technique was often used to prepare nanofluids seeded with metallic/metal oxide spherical nanoparticles. However, for the case of CNTs, single-step synthesis techniques have not yet been achieved. CNT nanofluids are usually prepared by two-step methods. In the first step, CNTs (SWCNTs/MWCNTs) are synthesized by arc discharge, laser ablation, and chemical vapour deposition. In the second step, stable and homogenous suspensions are prepared by dispersing the ‘as grown’ CNTs in the required base fluid.
The van der Waals force of attraction between carbon nanotubes makes ‘as grown’ CNTs extremely difficult to disperse in polar/non-polar fluids. Furthermore, the forces between CNTs are heavily influenced by both chirality and curvature of the surface. According to theory, the sidewall in a CNT consists of strained double-bonds, resulting in sp2/sp3 orbital hybridization. The strained double bonds would have partial single bond character resulting in a partially unsaturated bond. This phenomenon would explain the high force of attraction between the outer walls of CNTs. Thus the force of attraction can be more pronounced in SWCNTs than for MWCNTs. Henceforth, to create stable CNT dispersions two popular techniques prevail in the open literature. The first technique is to attach a hydrophilic
functional group onto the sidewalls by chemical functionalization. The other method is to encapsulate the CNTs using anionic/cationic surfactants.
Xie et al. [60] first employed a nitric acid/sulfuric acid mixture in the ratio of 1:3 to chemically functionalize CNTs. A known quantity of pristine CNTs were treated with the acid mixture, boiled, and refluxed for a short time period. After the reaction, the samples were collected and diluted using distilled water until a pH of 7 was obtained. The CNTs were further dried to eliminate the water content. Following the work of Xie et al. [60] , more recently Chen et al. [84] have employed mechanochemical reactions to chemically functionalize CNTs. However instead of an acid mixture they made use of an alkaline medium for the nanofluid preparation. They mixed CNTs with potassium hydroxide and ball- milled the mixture.
Chemical functionalization of CNTs heavily damages the structure of the CNTs and reduces the thermal properties of the CNTs. Therefore acid treatment may not be a suitable method to prepare CNT dispersions. Thinner nanotubes are susceptible to more structural damage than large-diameter nanotubes due to the greater strain induced on the bonds in thinner tubes. The mechanochemical reaction method has been found to limit the aspect ratio distribution. On the other hand, when the ball milling time is long, it was reported that the tubes were heavily damaged, which lead to the formation of a large amount of amorphous carbon [85]. The presence of amorphous carbon may modify the thermal properties of the dispersion. Hence, chemical functionalization and mechanochemical reactions may not be a proper method to make efficient, high-quality CNT dispersions.
Apart from chemical functionalization, the other commonly adopted method by many researchers is to encapsulate the CNTs using anionic/cationic surfactants. Jiang et al. [86]
prepared stable CNT suspensions using an anionic surfactant, namely sodium dodecyl sulfate (SDS). They reported that SDS, which consists of a single, straight hydrophobic segment and a terminal hydrophilic segment, tends to modify the interface of the CNTs with the surrounding base fluid thereby creating stable suspensions. Assael et al. [61], Zhang et al.[87], Garg et al. [88] and Nasiri et al. [71] also used SDS to prepare nanofluid dispersions.
Ding et al. [70] used Gum Arabic (GA) to disperse CNTs in water. Wen and Ding [69] used Sodium dodecylbenzene sulphonate (SDBS) to prepare nanofluid dispersions, and reported that the quality of the dispersions was very good compared to SDS and GA. However, they also demonstrated that the surfactant failed when heated to higher temperature, and the suspensions became no longer stable. Cherkasova et al. [68] also used SD
![Figure 1.1: ITRS prediction of the performance of single chip microprocessors [1].](https://thumb-ap.123doks.com/thumbv2/123deta/11735096.0/26.918.201.688.213.688/figure-1-itrs-prediction-performance-single-chip-microprocessors.webp)