Morphology effects on non-isotropic thermal conduction of aligned single- and multi-walled carbon nanotubes in polymer
nanocomposites
Hai M. Duong1,2, Namiko Yamamoto1, Khoa Bui3,Dimitrios V. Papavassiliou3, Shigeo Maruyama4 and Brian L. Wardle1
1Department of Aeronautics and Astronautics, Massachusetts Institute of Technology, USA
2Department of Materials Science and Metallurgy, University of Cambridge, U.K.
3School of Chemical, Biological and Materials Engineering, University of Oklahoma, USA
4Department of Mechanical Engineering, The University of Tokyo, Japan *Contact email: [email protected]
Abstract: An off-lattice Monte-Carlo simulation was used to study non-isotropic heat conduction in aligned carbon nanotube (CNT)-polymer nanocomposites (PNCs) focusing on the effects of CNT-CNT contact and CNT distribution on heat transfer. CNT-CNT contact significantly affects the effective transport properties of PNCs, including anisotropy ratios, but has not been studied extensively either theoretically or experimentally. Previous studies have considered the effective thermal conductivities of CNT-PNCs using only a very large CNT-CNT thermal boundary resistance (TBR) value compared with that of the CNT-matrix. CNT-CNT TBR may be reduced by various techniques, potentially below the CNT-matrix TBR, to further enhance thermal transport. Therefore, in this work, heat transport with CNTs in contact is
studied for a wide range of CNT-CNT TBR values, varying from 2 to 25×10-8m2K/W. Other important factors, such as CNT contact degree (or CNT isolation degree), CNT spatial distribution, and CNT-CNT TBR relative to CNT-matrix TBR are also investigated for 1-20%
volume fraction of CNTs. The simulation results indicate that when CNT-CNT contact is significant or CNT-CNT TBR is low (relative to the CNT-matrix TBR), then heat transport is dominated by CNT-CNT contact effects, rather than CNT-matrix interfacial effects. As an example, effective thermal conductivity on the nanocomposite parallel to the CNT axis is shown to increase by up to ~4X due to CNT-CNT contact effects. These simulation results can be very useful for developing techniques to enhance the effective thermal conductivity of composites using conductive nanomaterials embedded in (polymer) matrices, and assist experimentalists in interpreting heat conduction results.
Key words: CNT, composite, thermal property, thermal boundary resistance, random walk, CNT contact, SWNT, MWNT
Introduction
Carbon nanotubes (CNTs) have exceptional thermal properties, including high thermal conductivity and stability, and should have high potential as components in structures that require high heat dissipation and thermal transport control. Applications vary from micro-scale thermal tapes in electric circuits [1, 2] to macro-scale aerospace structural composites [3, 4] that benefit also from light weight and other multi-functional (mechanical and electrical) property enhancements due to the CNTs.
Heat transfer within an individual single-walled carbon nanotube (SWNT) has been rigorously investigated to identify lattice vibration modes and their allowed energy levels, which are different from other carbon structures (graphenes, graphites) due to the periodic boundary conditions along the CNT circumference [5, 6]. SWNT thermal conductivity has been estimated to be as high as 300-3000 W/m.K at room temperature by molecular dynamics (MD) models [7].
The length dependence of thermal conductivity and ballistic- diffusive features of heat conduction have also been presented [8-10]. Experimentally obtained thermal conductivities in the literature were comparable with these theoretical values for both SWNTs with 1.7-nm diameter and 2.6-mm length [11], and multi-walled carbon nanotubes (MWNTs) with 14-nm diameter and 2.5-mm long measured using a microfabricated suspended device [12]. However, the effective thermal conductivities of SWNT and MWNT bundles (the averaged value of CNTs and their surrounding media, normally air) were experimentally measured [13-18] to show large variation and deviation from the estimated values using rules of mixture based on individual component values. These differences possibly originate from the type of CNTs themselves (quality, defects, diameter, length, chilarity, and number of walls), CNT morphology (alignment, waviness, CNT-CNT contacts, etc.), the inter-wall or inter-tube interactions and phonon transportation inside CNTs (mean free path). An experimental study [18] demonstrated high thermal conductivities of SWNTs at room temperature and phonon mean free path is discussed to be <∼1.0 mm . CNT thermal conductivity is certainly affected when the CNT array length is much longer than the phonon mean free path due to phonon scattering. As the modified effective medium theory (EMT) [19, 20] is limited to simple, non-interacting geometries, the effect of some of these factors on CNTs in a media have so far been investigated solely with MD [21, 22], or Monte-Carlo [23] simulations. The EMT is a macroscopic analysis that may reach its limits with the CNT case, where the phonon mean free path (<~1mm at room temperature) is much
larger than the CNT diameter. Also, the EMT does not normally accommodate for material anisotropy. Models based on MD require significant computational time due to the sample size, and finite element methods require complicated meshing for each configuration of the composite material. A different and meshless approach, based on a random walk algorithm, has been developed by introducing the TBR at the CNT-matrix interface [24, 25] and using Monte Carlo- based models [26, 27] to predict the thermal conductivities of MWNT-[28] and SWNT-[29]
PNCs. This method simulates the quasi-phonon particle at an intermediate physical scale that allows CNT morphology, anisotropy, and interfacial CNT-CNT or CNT-matrix effects [23, 28, 29] to be considered. The first simulation results have been validated by comparison with experimental data of randomly oriented SWNT-PNCs [30, 31]. Duong et al. [23] predicted the effective thermal conductivities of the PNCs having CNTs randomly dispersed with and without CNT contact under a wide range of CNT volume fractions. However, only a single large value of the CNT-CNT TBR was used, and the possibility of better CNT-CNT interaction that can decrease the CNT-CNT TBR has not been considered. In the present paper, the simulation methodology is applied to explore CNT-CNT interactions more appropriately, particularly the effects of a wide range of the CNT-CNT TBRs, CNT isolation degree, and the distribution of aligned CNTs in aligned-CNT PNCs. Non-isotropic (along the CNTs vs. perpendicular to the CNT alignment axis) heat conduction is the focus herein, noting that thermal anisotropic ratios are strongly affected by CNT morphology.
2. Background
Prior work in the area of CNT-matrix and CNT-CNT TBR is not extensive, neither theoretical nor experimental. Maruyama et al. [21] applied MD simulations to estimate the TBR between SWNTs in a bundle. Zhong et al. [22] reported systematic MD studies of the effect of contact
morphology on the TBR. The reported values of the CNT-CNT TBRs range between 8×10⁻⁸ and 25×10-8 m2K/W. This value range is slightly higher than reported CNT-polymer matrix TBRs (i.e., 1.0×10⁻⁸ m2K/W for SWNT-PMMA [29] and 4.3×10⁻⁸ m2K/W for SWNT-epoxy [29]), and it is also higher than the range of SWNT-matrix TBRs (0.1 - 4.4×10⁻⁸ m2K/W) used for simulations in the previous work of Duong et al. [23].
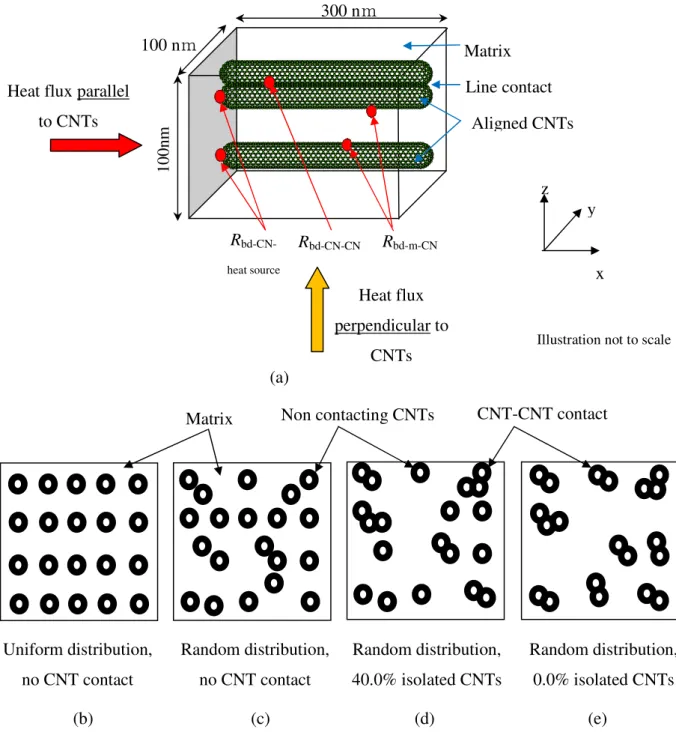
Different interfaces (and TBRs) such as CNT-CNT, CNT-heat source and CNT- matrix TBRs are shown in Figure 1a. CNT line contact is assumed and the CNT-heat source TBR is assumed to be equal to the CNT- matrix TBR for simplicity. As the CNT-CNT TBR can be decreased by functionalizing the CNTs to achieve better contact between the CNTs, this work employed a wider CNT-CNT TBR range, which includes a CNT-CNT TBR lower than that of CNT-matrix TBR (Tables 1 and 2). This work can be beneficial when considering improvements to the effective thermal conductivities of CNT- PNCs by increasing the CNT volume fraction or by keeping the same CNT volume fraction, but increasing better CNT interaction with other components. Several authors [32-34] have predicted that the wavy shape and spatial agglomeration of CNTs have a large detrimental influence on the effective elastic moduli of CNT-reinforced PNCs, and recent work addresses waviness effects on electrical conductivity [35]. Such effects could potentially modify the thermal properties of CNT-PNCs, but the case of curved CNT shapes that results in intermittent CNT-CNT contact is not examined in this paper and is left for future work. Through the CNT isolation degree study (Table 3) in this work, the model allows consideration of spatial CNT agglomeration, a significant parameter that helps to evaluate and select appropriate matrix materials and fabrication procedures in PNC design. The CNT isolation degree is defined as the ratio of the number of isolated CNTs to the total number of CNTs in a computational cell (see illustrations in Figure 1).
Previous experimental work [36] has showed that uniform CNT distribution plays an important role in improving the multifunctional properties of the CNT-composite materials. The major challenge in fabricating the CNT-PNCs is to avoid agglomeration and (if possible) control the PNC morphology via aligned CNTs (Figure 1a). As there is no experimental data available showing systematically the CNT distribution effect on the effective thermal conductivities of the CNT-PNCs, this topic can be investigated through computations (Table 2). Here we consider the effects of the CNT-CNT and CNT-matrix TBR (Figure1a), CNT isolation degree, and the CNT distribution uniformity (see Figures 1b-e) on both SWNT- and MWNT-PNCs with various CNT volume fractions (1-20 vol%) and orientations (heat flux is parallel and perpendicular to the CNT axis). The anisotropy of heat conduction related to the CNT direction and the CNT diameter (SWNT vs. MWNT) influences are also discussed. Duong et al. [23] reported that with CNT- CNT contact effects, high CNT-CNT TBR can have an adverse effect on effective thermal conductivities of the CNT-PNCs assuming a single CNT-CNT TBR value and using a random CNT distribution. CNT distribution effects were studied previously only for CNT-PNCs having no CNT-CNT contact. Comparison of the simulated results with experiments would enable extraction of the TBR values and the CNT isolation degree values that would help experimentalists in selecting an appropriate fabrication process. The results can also be used with a representative volume element (RVE) approach to design optimized heat conduction materials using CNTs [37], including complex 3D hybrid fiber-matrix composites reinforced with aligned CNTs currently under development [38-40].
3. Simulation algorithm
The computational domain for the numerical simulation is a rectangular box (300x100x100 nm3) with CNTs organized in the polymer matrix. The CNTs are collimated and extend from one end of the computational domain to the other. In most of the cases, the locations of the CNTs were randomly assigned (see Figures 1c and 1d) and/or forced to be in contact (see Figure 1e). The computational cell is heated from one surface (the x =0 plane in Figure 1a) with the release of 90,000 hot walkers distributed uniformly (square packing) on that surface at every time step.
Walkers are therefore dropped into either the matrix or the CNTs depending on location of the CNTs, i.e., PNC morphology. The walkers exit the computational domain at the surface opposite to the heated surface. The cell has periodic boundary conditions in the other two directions. The walkers, which are carrying heat, travel in the computational cell until steady-state is achieved.
At each time step, the walkers move through the matrix material by Brownian motion [41] with random jumps in each space direction of length that is evaluated from a normal distribution with a zero mean and a standard deviation (s):
t Dm∆
= 2
σ (1)
where Dm is the thermal diffusivity of the matrix material and ∆t is the time increment.
Once a walker in the matrix reaches the interface between the matrix and a CNT, the walker will move into the CNT with a probability fm−CN, which represents the TBR of the interface, and will stay at the previous position in the matrix with a probability (1− fm−CN). According to the acoustic mismatch theory [42], fm−CN is given by
bdi i i i CN
i C R
f ρ ν
= 4
− (2)
where i can be any material in contact with the CNT seen as the matrix fm-CN; ρ is the density; C is the specific heat; ν is the velocity of sound in the matrix material and Rbd is the thermal
boundary resistance. A walker inside a CNT distributes randomly to give a uniform distribution due to the high CNT thermal conductivity compared to that of the matrix. The walker will re- distribute randomly within the same CNT with a probability (1− fCN−m − fCN−CN) at the end of a time step, or will distribute randomly in other CNTs in contact with the previous CNT with a probability fCN−CN, or will cross into the matrix phase with a probability fCN−m. In this latter case, the walker moves first to a point on the surface of the CNT and then moves into the matrix with a statistical jump whose magnitude takes values from a normal distribution that has a standard deviation given by equation (1) above. Based on thermal equilibrium considerations, fCN−m is given by [23]:
CN CN m f CN m CN
V f − =C σA f − (3)
where ACN and VCN are the surface area and the volume of a CNT, respectively and Cf is a thermal equilibrium factor, which depends on the reinforcement (SWNT and MWNT here) size and shape [23, 28, 29].
The temperature distribution is calculated from the number of walkers found in discretized bins in the domain after steady-state is reached. These bins are used only to count walkers for this calculation; the simulation is meshless. In order to make the calculation of the effective conductivity more rapid and straightforward, heat transfer with constant heat flux through a domain enclosed between a hot and a cold plane is studied. In this case, the two opposite planes release hot or cold (carrying negative energy [43]) walkers, respectively. The input simulation parameters are summarized in Table 1. Simulation runs are conducted with CNT-matrix and CNT-CNT TBRs, CNT orientation related to heat flux, and volume fraction of SWNTs and
MWNTs in epoxy. For each CNT orientation in the computational cell and each value of TBR and volume fraction of CNTs, the thermal conductivity is calculated as the average of three simulations with different initial (randomly generated) CNT y-z plane locations. Further details of the random walk algorithm and assumptions can be found in [23, 28, 29]
4. Simulation results and discussion
Simulation results are presented here on the influences of CNT-CNT TBRs, CNT isolation degree, and CNT distribution on the effective thermal conductivities of the SWNT- and MWNT- PNCs. CNT-CNT contact is a common occurrence as CNTs form bundles and also when SWNTs and MWNTs are grown into forests or spun into macroscopic fibers, which are wavy and in contact [44]. As mentioned already, the results presented here consider collimated CNTs only. The SWNT and MWNT diameters used in the simulations were 2.4 and 8.0 nm, respectively, corresponding to typical CNTs synthesized in the authors’ groups [37-40, 45, 46].
The number of CNTs in the computational cell varied from 22 to 448 (SWNTs) and from 2 to 40 (MWNTs), depending on the volume fractions of CNTs in the polymer matrix (1-20 vol%). The simulations were conducted with different CNT-matrix TBRs (Rbd-m-CN = 0.09, 0.17, 0.44, 4.36, 174 [×10-8 m2K/W] i.e., probability fm-CN = 1.0000, 0.5000, 0.2000, 0.0200, 0.0005, respectively); with different CNT-CNT TBRs, Rbd-CN-CN (Rbd-CN-CN = 1.73, 8.67, 24.8 [×10-8 m2K/W] (fCN-CN = 1.0000, 0.2000, 0.0024, respectively) falling within the wider range (10-8 to 10-7 m2K/W) of TBR values considered in the literature [47]). Different CNT volume fractions (1, 8 and 20 vol%) are considered, and the matrix used for the simulations was epoxy having thermal conductivity Km = Kepoxy = 0.2 W/m.K [29].
4.1. Effects of CNT-CNT TBR on the effective thermal conductivities of PNCs
In both directions (heat flux is parallel and perpendicular to the CNT axis in Figure 2) of
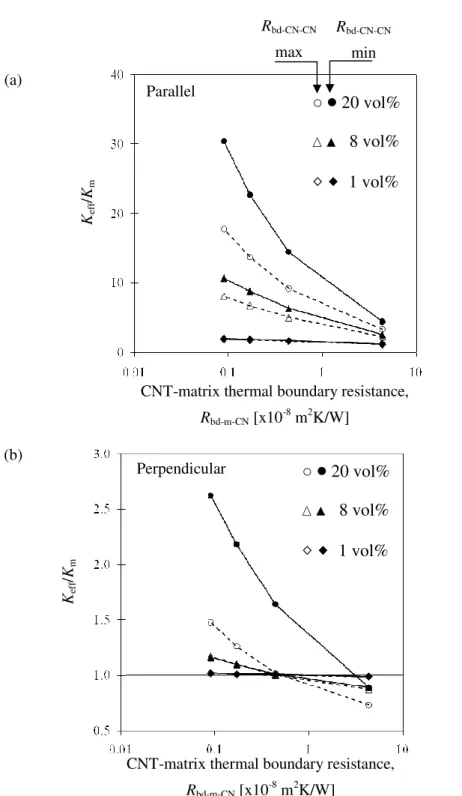
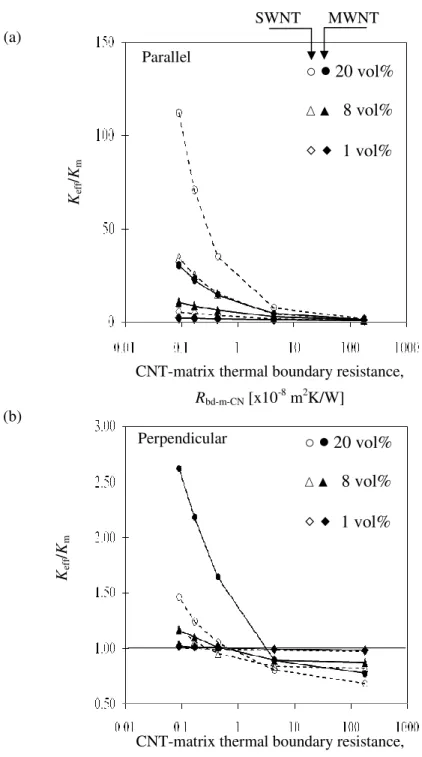
MWNT-PNCs, with the CNT volume fraction and the CNT-CNT TBR fixed, the normalized thermal conductivity of the PNC (Keff/Km) of CNT-PNCs having 40% isolated CNTs increases as the CNT-matrix TBR is reduced, as expected. CNT isolation degree and the associated TBR also have a strong effect on the effective thermal conductivity, again with higher conductivity associated with lower CNT-CNT TBR. CNT-CNT contact has a stronger influence on the effective thermal conductivity along the CNT axis (parallel direction) when the CNT-matrix TBR is relatively low with increasing CNT-CNT TBR. This is explained because heat remains in the matrix longer due to the high CNT-CNT TBR and therefore less phonons enter the high conductivity CNTs. At 20 vol% of CNTs, the CNT-matrix and CNT-CNT TBRs dramatically affect the effective thermal conductivities of the CNT-PNCs. The CNT-PNCs having 20 vol% of CNTs reaches maximum effective parallel thermal conductivity (Keff-maximum/Km = 30.4, or Keff = 6.08 W/m.K) in Figure 2a at the lowest CNT-matrix TBR (0.09x10⁻⁸ m2K/W) and lowest CNT- CNT TBR (1.73x10⁻⁸ m2K/W). For the PNCs having CNTs perpendicular to the heat flux (Figure 2b), the enhancement of the effective thermal conductivity can be reversed depending on the CNT-matrix TBR and a critical CNT-matrix TBR can be defined (e.g., ~0.7×10⁻⁸ m2K/W for 1 and 8 vol%). If the CNT-matrix TBR is smaller than the critical MWNT-matrix TBR, the effective perpendicular thermal conductivity of the PNCs is enhanced, with the usual trends of higher conductivity at higher volume fraction of CNTs and lower CNT-matrix TBRs. Above the critical CNT-matrix TBR, the effective thermal conductivity in the perpendicular direction is reduced and the trends reverse. This is because at high CNT-matrix TBRs, the CNTs are effectively removed from thermal transport and act like excluded volume, rather than high- conductivity additions to the matrix. At 20 vol%, the effective perpendicular thermal conductivity is reduced (lower than thermal conductivity of epoxy matrix) and reaches a minimum (Keff-minimum = 0.77 x Kepoxy ≃ 0.15 W/m.K) with highest CNT-matrix TBR (4.36x10⁻⁸
m2K/W) and highest CNT-CNT TBR (24.8x10⁻⁸ m2K/W).Note that no critical matrix-CNT TBR is identified for heat conduction in the parallel direction, although the effect of CNT-CNT contact can still be quite significant (but not reverse trends).
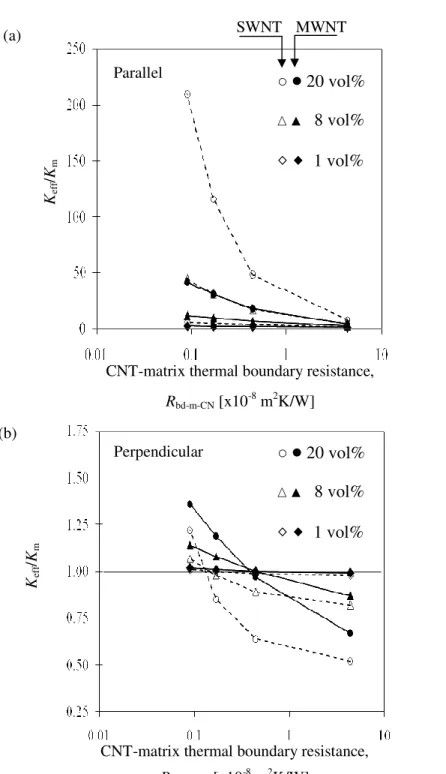
Table 2 summarizes analyses for SWNT and MWNT PNCs with varying volume fraction, having varying CNT-matrix and CNT-CNT TBRs with different CNT arrangements (uniform square packing and random distribution with and without contact). In Table 2, for heat flux parallel to the axis of the CNTs, at the point for 20 vol% and for minimum CNT-matrix TBR, there is a x1.2, x1.6, and x3.8 decrease in effective thermal conductivity with increasing CNT- CNT TBR when SWNT-SWNT contact is considered. This is because the phonons have less interfacial surface to cross into the high-conductivity CNTs from the matrix due to CNT grouping when they are in contact. The thermal conductivity enhancement of SWNT-PNCs is more significant than that of MWNT-PNCs as the CNT volume fraction increases (Figure 3a).
This can be explained because the surface to volume ratio of the SWNTs is higher than that of the MWNTs at the same CNT volume fraction. Therefore, there is more area available for heat transfer between the matrix and the SWNTs than for MWNTs with the same CNT volume fraction. For the PNCs having CNTs perpendicular to the heat flux (Figure 3b), as the MWNTs have a larger diameter than the SWNTs, the walkers can travel farther along the CNT radius in the PNCs giving higher effective thermal conductivity for the MWNTs than SWNTs than that of the SWNT-PNCs, e.g., at 20vol% and the lowest CNT-matrix TBR, Rbd-m-CN = 0.09 x10⁻⁸ m2K/W. The critical CNT-matrix TBR of the SWNT-PNCs (~0.4x10⁻⁸ m2K/W) is smaller than that of MWNT-PNCs (~0.7x10⁻⁸ m2K/W) which is also explained by the greater diameter of the MWNTs. MWNTs relative to SWNTs have a larger critical (point at which adding CNTs has no effect on conductivity due to TBR) CNT-matrix TBR due to the larger distance the heat transfers once inside a MWNT vs. a SWNT in the perpendicular direction (see Figure 3b). The walkers
inside the MWNTs can move much faster along the large MWNT radius and enhance the effective perpendicular thermal conductivity.
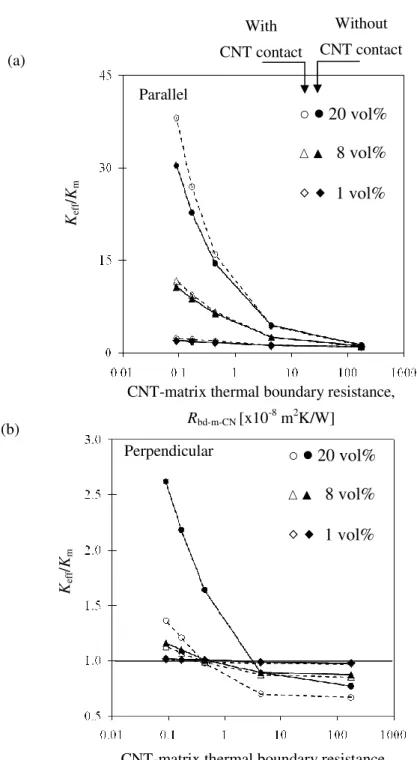
In Figure 4a, when the CNT-CNT TBR (Rbd-CN-CN=1.73×10⁻⁸ m2K/W) is smaller than the CNT- matrix TBRs (Rbd-m-CN = 4.36, 174 ×10-8 m2K/W), the heat transport of the walkers through the CNT-CNT contacts becomes more significant than through the CNT-matrix-CNT contacts. The walkers have greater likelihood to cross into the adjacent CNTs in contact resulting in an increase in the effective thermal conductivity of the PNCs. Therefore, the effective thermal conductivity of the PNCs having CNT-CNT contact with a very low CNT-CNT TBR is larger than that without CNT-CNT contact, when CNTs are parallel to the heat flux. This result is very interesting and helpful for experimental work and for applications. Instead of increasing the CNT volume fraction to enhance the effective thermal conductivity of the CNT-PNCs, the thermal conductivity can be enhanced by improving the CNT-CNT contact, possibly through CNT functionalization. Recent experimental work [48] has reported that the thermal conductivity of SWNT-polystyrene composites does not increase with the CNT volume fraction as much as predicted at higher volume fractions. Such difference might very well be due to the increase of the SWNT-SWNT contact points and higher values or CNT-CNT TBRs relative to the CNT- matrix TBR. For the perpendicular case (Figure 4b), the effective thermal conductivities of the CNT-PNCs without CNT contact is greater than those with the CNT-CNT contact. Below the critical point, and then the trend reverses as discussed previously due to the relative contributions of CNT-CNT TBR vs. CNT-matrix TBR.
4.2. Effects of CNT isolation degree on the thermal conductivity of the PNCs
Here, we consider the effect of CNT-CNT contact degree by controlling (forcing) different degrees of CNT contact considering randomly-dispersed CNTs as summarized in Table 3.
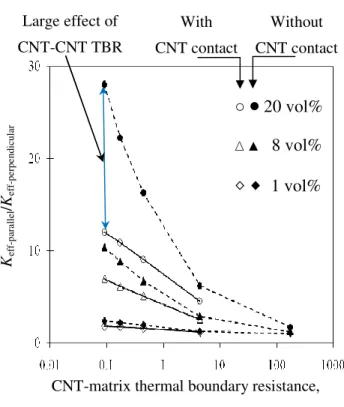
Thermal conduction anisotropy (Keff-parallel/Keff-perpendicular) of MWNT-epoxy composites with and without CNT-CNT contact (largest CNT-CNT TBR, Rbd-CN-CN= 24.8x10⁻⁸ m2K/W) are compared in Figure 5. CNT contact has a significant effect on the anisotropy ratio at high CNT loading, and low CNT-matrix TBR for this case (Figure 5) when the CNT-CNT TBR is very large (largest in the range considered in this work). In Table 2, with lower CNT-matrix TBR and higher CNT volume fraction, the reduction of Keff-parallel/Keff-perpendicular ratios of the CNT-PNCs without and with the CNT-CNT contact is greater. At 20 vol% of MWNTs and the lowest CNT- matrix TBR (0.09x10⁻⁸ m2K/W), the anisotropic heat conduction of the CNT-PNCs with the CNT-CNT contact decreases 2.3X compared with that without the CNT-contact.
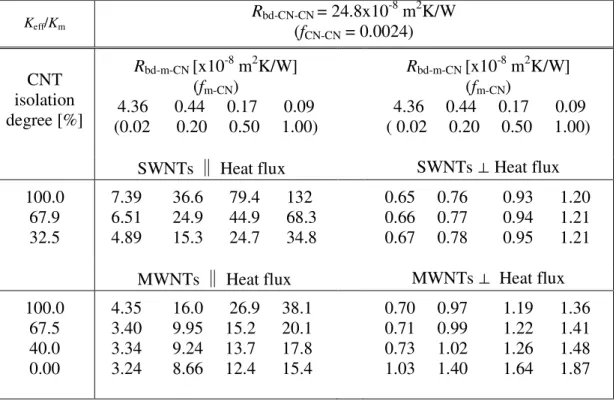
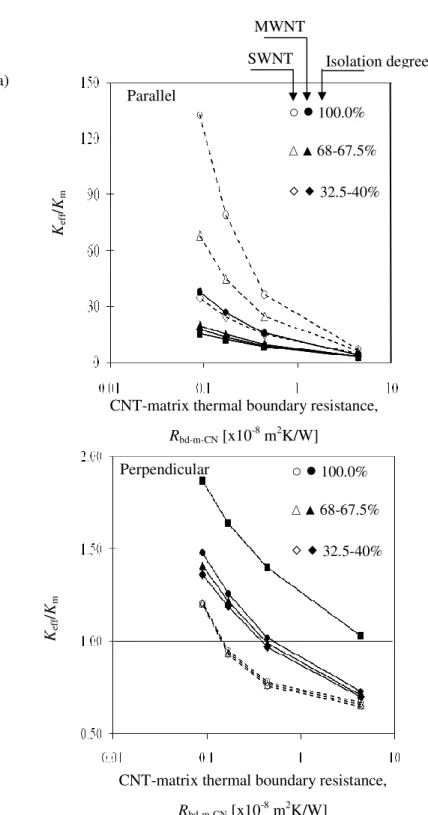
The simulation results of this part could be also very helpful interpreting experimental work. The effective thermal conductivities of the SWNT- and MWNT-PNCs having 20 vol% and the CNT- CNT TBR, Rbd-CN-CN = 24.8 x10⁻⁸ m2K/W were studied over a wide range of the CNT isolation degree, from no isolated CNT (0.0%) to completely isolated CNTs (100.0%). Different isolation degree values (Table 3) are used to calculate the thermal conductivities of directional PNCs having the CNTs parallel and perpendicular to the heat flux. When the CNTs were randomly placed, 40.0% were in isolation for MWNT and 32.5% for SWNT. For the case of heat flux parallel to the CNT axis (Figure 6a and Table 3), the effective thermal conductivities of SWNT- and MWNT-PNCs decrease when the CNT isolation degree decreases. When the CNT-CNT TBR is larger than the CNT-matrix TBR, the more isolated CNTs provide larger the effective thermal conductivity. The effective thermal conductivities of the CNT-PNCs are highest with completely isolated CNTs (100.0%) and lowest with 0.0% isolated CNTs. With the same CNT isolation degree and volume fraction, the effective thermal conductivities of the SWNT-PNCs are larger than those of the MWNT-PNCs due to the larger SWNT-matrix interfacial area. When
CNT-matrix TBR increases, fewer walkers can cross into the CNTs to take advantage of the CNT high thermal conductivity. This makes the effective thermal conductivities of both SWNT- and MWNT-PNCs decrease with the same CNT isolation degree. In Figure 6a (parallel cases), with the same CNT volume faction and the CNT isolation degree, the effect on the effective thermal conductivities of the SWNT-PNCs is larger than those for MWNT-PNCs. This can be explained because the SWNT-matrix interface reduces significantly more than the MWNT-PNCs as the contact between CNTs increases.
For the case of heat flux perpendicular to the CNT axis (Figure 6b and Table 3), with same CNT isolation degree, effective thermal conductivities of MWNT-PNCs are larger than those of SWNT-PNCs. Again this is because walkers can travel faster along the MWNT diameter (8.0nm), which is larger than the SWNT diameter (2.4nm). The effective thermal conductivities of the SWNT- and MWNT-PNCs decrease when CNT-matrix TBRs increase. When decreasing the CNT isolation degree (100.0% down to 32.5% for SWNT-PNCs and 100.0% down to 40.0%
for MWNT-PNCs), the effective thermal conductivities increase slightly (Table 3). Walkers can travel faster along the CNT diameter, cross the CNT-CNT interface, and move faster along next contacting CNT diameter. Especially, with higher CNT volume fraction (20 vol%, Figure 6b), larger MWNT diameter and the smallest CNT isolation degree (0.0%), walkers can move faster along the CNT radius and come out the computational cell quickly.
4.3. Effects of the CNT distribution on the thermal conductivity of PNCs
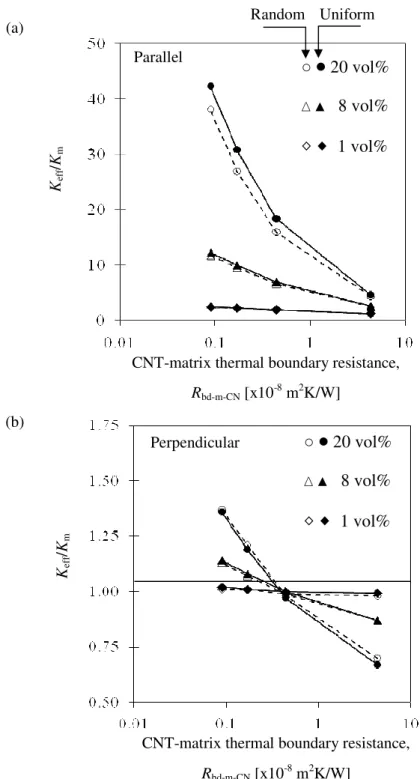
Here we consider the effects of a uniform CNT distribution on the effective thermal conductivities of SWNT- and MWNT- PNCs without CNT-CNT contact (Table 2 and Figures 7 and 8). For uniformly distributed CNTs in the computational cell, the distance between two nearby CNTs in the same row or column was equal. As random distribution of the CNTs cannot
preclude local CNT agglomeration in the PNCs, distributing the CNTs uniformly avoids this issue in the modeling.
For the CNTs parallel to the heat flux (Figure 7a), distribution (random vs. uniform) has very little effect on effective thermal conductivities when CNT-CNT contact is not considered. These local CNT agglomerations prevent phonons from coming into the CNTs from the matrix. The effect of the CNT agglomeration increases with the CNT volume fraction. In Figure 8a, with the same CNT volume fraction and the same CNT-matrix TBR, the thermal conductivities of the SWNT-PNCs are significantly larger than those of the MWNT-PNCs. In Table 2, this is shown for both CNT random and uniform distributions effects due to the larger interfacial area. At 20 vol% and the CNT-matrix TBR, Rbd-m-CN = 0.09×10⁻⁸ m2K/W, the uniform distribution effect can enhance x1.6 and x1.1 the effective parallel thermal conductivities of the SWNT- and MWNT- PNCs, respectively, relative to those with random distribution.
For the CNTs perpendicular to the heat flux (Table 2 and Figure 7b), CNT distribution effects also do not play an important role on the thermal conductivities of MWNT-PNCs. This is true for SWNT-PNCs with low CNT volume fractions (1-8 vol%). For the SWNT-PNCs with CNT uniform distribution at the 20 vol% (Table 2), phonons have an increased chance of contacting a CNT, and there is a small effect. So with the higher CNT-matrix TBR, the CNTs block the phonons/walkers and make them travel slower in the matrix. Localized agglomeration can now have the opposite effect, i.e., when the SWNTs are agglomerized, the excluded area for heat transfer is smaller than when the SWNTs were well distributed in the PNCs. This makes the effective thermal conductivities of the CNT-PNCs with the uniform CNT distribution smaller. In Table 2 and Figure 8b, the ratio Keff/Km for MWNT- and SWNT- PNCs with the CNT uniform distribution at 20 vol% decreases below one when the CNT-matrix TBRs are larger than a
critical CNT-matrix TBR (0.5×10⁻⁸ m2K/W for the MWNT-PNCs and 0.2×10⁻⁸ m2K/W for the SWNT-PNCs). With the same CNT-matrix TBR and the same CNT volume fraction, the thermal conductivities of the MWNT-PNCs are always larger than those of the SWNT-PNCs with the uniform CNT distribution due to larger MWNT diameter and less interfacial area.
5. Conclusions
A Monte-Carlo model was applied to study the effects of CNT array morphology on the effective thermal conductivities of the CNT-PNCs for a wide range of CNT-CNT and CNT-matrix TBRs, CNT distributions (random or uniform), CNT isolation degree, and CNT volume fractions. Heat conduction anisotropy of both SWNT- and MWNT-PNCs was also studied.
It was found that, when the CNT-CNT TBR is larger than the CNT-matrix TBR, the effect of increased nanotube contacts is detrimental to the effective thermal conductivity for PNCs with CNT acting as inclusions oriented in the direction of the heat flux. These detrimental effects are more pronounced for cases of high CNT volume fractions, perhaps explaining some confusing experimental results where thermal conductivity decreases as CNT volume fraction (but also contact) also increases. For the case of heat flux perpendicular to the direction of the axis of the CNTs, it was found that there exists a critical CNT-CNT TBR below which the effective conductivity of the PNC falls below the thermal conductivity of the pure polymer. In this case, the effects of CNT-CNT contacts are more important for MWNTs rather than for SWNTs. The effects of agglomeration of CNTs, even when the CNTs are not in contact and there are no CNT- CNT TBR present, are also detrimental for the effective heat conductivity when the heat flux is parallel to the direction of the CNT axis. Since currently available calculations suggest that the CNT-CNT TBR is higher than the CNT-matrix TBR, it appears that there should be an effort to
improve the quality of the CNT-CNT interface by reducing the thermal resistance at this interface, rather than focusing exclusively on increasing the volume fraction of the CNTs.
The current model does not take into account the CNT wavy shapes that give intermittent CNT- CNT contact. In addition, to validate the simulation results with experiments, future work should include exploration of a wider range of CNT-matrix interface resistance and quantification for different thermal interface materials like CNT-metal composites. The effects on TBRs of other molecules existing on the surface of synthesized CNTs and the possibility that the CNTs cause a local polymer interphase [34, 49] different than the neat polymer should also be considered.
Uneven CNTs topography due to the variation of CNT heights causing uneven contact with heat source [17] and contact in length direction for shorter CNTs than film thickness seems to be the critical problems for at least SWNTs.
Acknowledgements
This work was supported by Airbus S.A.S., Boeing, Embraer, Lockheed Martin, Saab AB, Spirit AeroSystems, Textron Inc., Composite Systems Technology, and TohoTenax through MIT’s Nano-Engineered Composite aerospace Structures (NECST) Consortium. This work was also supported by the TeraGrid under TG-CTS070050 and TG-CTS090017. Namiko Yamamoto acknowledges support from MIT’s Linda and Richard Hardy (1958) Fellowship. Dimitrios Papavassiliou acknowledges support from the DoE-funded Carbon Nanotubes Technology Center – (Award Register#: ER64239 0012293). Shigeo Maruyama acknowledges support from Grant-in-Aid for Scientific Research (19206024) from the Japan Society for the Promotion of Science, SCOPE (051403009) from the Ministry of Internal Affairs and Communications and NEDO (Japan).
Reference
[1] J. Xu and T.S. Fisher, Comp. Pack. Tech., 2006, 29(2), 261
[2] X. J. Hu, M. A. Panzer and K.E. Goodson, J. Heat Trans., 2007, 129(1), 91
[3] P. M. Ajayan, L. S. Schadler, C. Giannaris and A. Rubio, Adv. Mater., 2000, 12, 750
[4] S. U. S. Choi, Z. G. Zhang, W. Yu, F. E. Lockwood and E. A. Grulke, Appl. Phys. Lett., 2001, 79, 2252
[5] J. Hone, M. Whitney, C. Piskoti and A. Zettl, Phys. Rev. B, 1999, 59(4), R2514
[6] M. S. Dresselhaus, G. Dresselhaus and Ph. Avouris, Carbon Nanotubes: Synthesis, Structure, Properties and Applications, Springer, New York, 2001
[7] S. Berger, Y. K. Kwon and D. Tamanek, Phys. Rev. Lett., 2000, 84(20), 4613 [8] S. Maruyama, Physics B, 2002, 323, 193
[9] T. Yamamoto, S. Konabe, J. Shiomi and S. Maruyama, Appl. Phys. Express, 2009, 2, 095003 [10] N. Mingo and D.A. Broid, Nano Lett., 2005, 5, 1221
[11] E. Pop, D. Mann, Q. Wang, K. E. Goodson and H. Dai, Nano Lett., 2006, 6(1), 96 [12] P. Kim, L. Shi, A. Majumdar and P. L. McEuen, Phys. Rev. Lett., 2001, 87(21), 215502 [13] J. Hone, M. C. Llaguno, N. M. Nemes, A. T. Johnson, J. E. Fisher, D. A. Walters, M. J.
Casavant, J. Schmidt and R. E. Smalley, Appl. Phys. Lett., 2000, 77(5), 666
[14] W. Yi, L. Lu, Z. Dian-lin, Z. W. Pan and S. S. Xie, Phys. Rev. B, 1999, 59(14), R9015 [15] S. Shaikh, L. Li, K. Lafdi and J. Huie, Carbon, 2007, 45(13), 2608
[16] I. Ivanov, A. Puretzky, G. Eres, H. Wang, Z. Pan, H. Cui, R. Jin, J. Howe and D. B.
Geohegan, Appl. Phys. Lett., 2006, 89(22), 223110
[17] M.A. Panzer, G. Zhang, D. Mann, X. Hu, E. Pop, H. Dai and K.E. Goodson, ASME J. Heat.
Trans., 2008, 130, 052401
[18] J. Hone, M. Whitney, C. Piskoti, and A. Zettl, Phys. Rev. B, 1999, 59, R2514.
[19] C. W. Nan and R. Birringer, J. Appl. Phys., 1997, 81(10), 6692
[20] C. W. Nan, G. Liu and Y. Lin and M. Li, Appl. Phys. Lett., 2004, 85(16), 3549
[21] S. Maruyama, Y. Igarashi, Y. Taniguchi and J. Shiomi, J. Therm. Sci.Tech., 2006, 1, 138 [22] H. Zhong and J. R. Lukes, Phys. Rev. B, 2006, 74, 125403
[23] H. M. Duong, N. Yamamoto, D. V. Papavassilliou, S. Maruyama and B. L. Wardle, Nanotechnology, 2009, 20(15), 155701
[24] P. L. Kapitza, J. Phys. USSR, 1941, 4, 181
[25] S. Maruyama S and T. Kimura, Therm. Sci. Eng., 1999, 7, 63
[26] M. M. Tomadakis and S. V. Sotirchos, J. Chem. Phys., 1992, 98, 616 [27] M. M. Tomadakis and S. V. Sotirchos, J. Chem. Phys., 1992, 104, 6893
[28] M. H. Duong, D. V. Papavassiliou, J. K. Mullen and L. L. Lee, App. Phys. Lett., 2005, 87(1), 013101
[29] M. H. Duong, D. V. Papavassiliou, J. K. Mullen and S. Maruyama, Nanotechnology, 2008, 19(6), 065702
[30] M. B. Bryning, D. E. Milkie, J. M. Kikkawa and A. G. Yodh, Appl. Phys. Lett., 2005, 87, 161909
[31] F. Du, C. Guthy, T. Kashiwagi,J. E. Fischer and K. I. Winey, J. Pol. Sci.: Part B Pol. Phys., 2006, 44, 1513
[32] H. Cebeci, R. Guzman de Villoria, A. J. Hart and B. L. Wardle, Comp. Sci. Tech., 2009, 69, 2649
[33] F. T. Fisher, R. D. Bradshaw and L. C. Brinson, Applied Physics Letters, 2002, 80, 4647 [34] K. I. Winey and R. A. Vaia, MRS Bulletin, 2007, 32(4), 314
[35] C. Li and E.T. Thostenson, Comp. Sci. Tech., 2008, 68(6) 1445
[36] E. Dervishi, Z. Li, V. Saini, A. R. Biris, D. Lupu, S. Trigwell and A. S. Biris, Mater. Res.
Soc. Symp. Proc., 2007, 1018, EE13-05
[37] B.L. Wardle, D.S. Saito, E.J. Garcia, A.J. Hart and R. Guzman de Villoria, Adv. Mater., 2008, 20, 2707
[38] E. J. Garcia, B. L. Wardle, and A. J. Hart, Composites Part A, 2008, 39, 1065
[39] E. J. Garcia, B. L. Wardle, A. J. Hart, and N. Yamamoto, Comp. Sci. Tech., 2008, 68, 2034 [40] E. J. Garcia, A. J. Hart, B. L. Wardle, and A. H. Slocum, Nanotechnology, 2007, 18, 165602 [41] A. Einstein, Ann. d. Phys., 1905, 17, 549
[42] E. T. Swartz, and R. O. Pohl, Rev. Mod. Phys., 1989, 61, 605
[43] B. Sundqvist, O. Sandberg and G. Backstrom, J. Phys. D: Appl. Phys, 1977, 10, 1397 [44] E. Einarsson, H. Shiozawa, C. Kramberger, M. H. Ruemmeli, A. Gruneis, T. Pichler and S.
Maruyama, J. Phys. Chem. C, 2007, 111(48), 17861
[45] Y. Murakami, E. Einarsson, T. Edamura and S. Maruyama, Carbon, 2005, 43, 1664 [46] Y. Murakami, S. Chiashi, Y. Miyauchi, M. Hu, M. Ogura, T. Okubo and S. Maruyama, Chem. Phys. Lett., 2004, 385(3-4), 298
[47] T. C. Clancy and T. S. Gate, Polymer, 2006, 47, 5990
[48] J. E. Peters, D. V. Papavassiliou and B. P. Grady, Macromolecules, 2008, 41(20), 7274 [49] L. S. Schadler, S. K. Kumar, B. C. Benicewicz, S. L. Lewis and S.E. Harton, MRS bulletin, 2007, 32, 335
[50] Yutopian, Thermal and Mechanical Properties of Epoxy, 2000, June 2008 http://www.yutopian.com/Yuan/prop/Epoxy.html
[51] A. Bick and T. Dorfmueller, NATO ASI Ser., Ser. C, 1989, 291, 389 [52] P. G. Collins and A. Phaedon, Scientific American, 2000, 67, 68 and 69 [53] J. Hone, M. Whitney and A. Zettl, Syn. Metals., 1999, 103, 2499
[54] S. P. Hepplestone, A. M. Ciavarella, C. Janke and G. P. Srivastava, Surface Science, 2006, 600, 3633
Tables
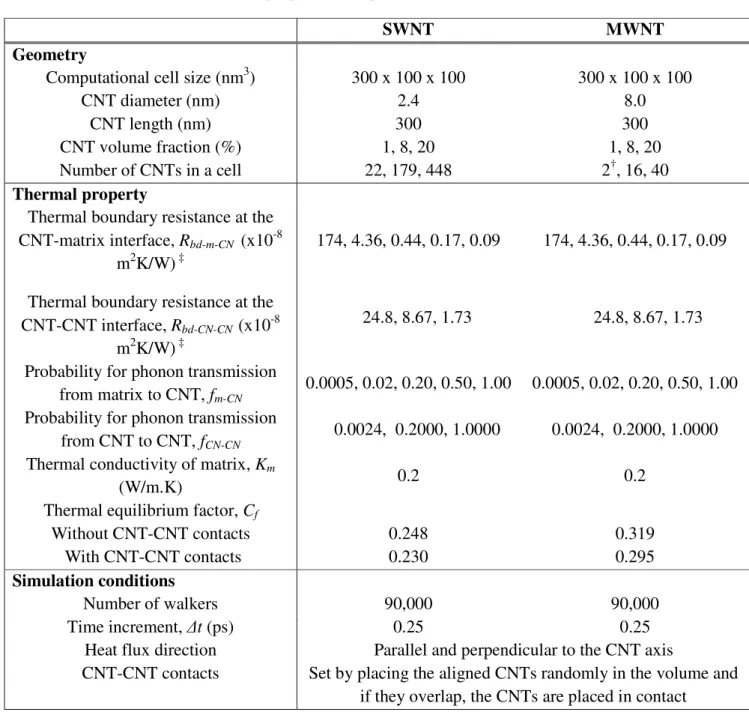
Table 1. Material properties and parameters used in the simulations.
SWNT MWNT
Geometry
Computational cell size (nm3) 300 x 100 x 100 300 x 100 x 100
CNT diameter (nm) 2.4 8.0
CNT length (nm) 300 300
CNT volume fraction (%) 1, 8, 20 1, 8, 20
Number of CNTs in a cell 22, 179, 448 2†, 16, 40
Thermal property
Thermal boundary resistance at the CNT-matrix interface, Rbd-m-CN (x10-8
m2K/W) ‡
174, 4.36, 0.44, 0.17, 0.09 174, 4.36, 0.44, 0.17, 0.09
Thermal boundary resistance at the CNT-CNT interface, Rbd-CN-CN (x10-8
m2K/W) ‡
24.8, 8.67, 1.73 24.8, 8.67, 1.73 Probability for phonon transmission
from matrix to CNT, fm-CN 0.0005, 0.02, 0.20, 0.50, 1.00 0.0005, 0.02, 0.20, 0.50, 1.00 Probability for phonon transmission
from CNT to CNT, fCN-CN
0.0024, 0.2000, 1.0000 0.0024, 0.2000, 1.0000 Thermal conductivity of matrix, Km
(W/m.K) 0.2 0.2
Thermal equilibrium factor, Cf
Without CNT-CNT contacts With CNT-CNT contacts
0.248 0.230
0.319 0.295 Simulation conditions
Number of walkers 90,000 90,000
Time increment, ∆t (ps) 0.25 0.25
Heat flux direction Parallel and perpendicular to the CNT axis
CNT-CNT contacts Set by placing the aligned CNTs randomly in the volume and if they overlap, the CNTs are placed in contact
†Two MWNTs are forced to be in contact in this case rather than a random assignment.
‡Thermal boundary resistance Rbd is calculated from Eq.2; epoxy specific heat is 0.97 J/g.K [50];
epoxy density is 1.97 g/cm3 [50]; sound velocity in epoxy is 2400 m/s [51]; SWNT density is 1.30 g/cm3 [52]; sound velocity in SWNTs is 8,000 m/s [53] and SWNT specific heat is 0.625 J/g.K [54]. The same fCN-CN is assumed for the MWNTs due to unavailable values in the literature to calculate fCN-CN using eq. (2).
23 randomly distributed CNTs with 100% isolated CNTs (no contact), 40% isolated CNTs, and CNTs with no contact and a uniform (square packing) distribution.
Keff/Km CNT-CNT contact No CNT-CNT contact,
Random CNT Distribution
No CNT-CNT contact, Uniform CNT Distribution Rbd-CN-CN [x10-8 m2K/W] (fCN-CN)
24.8 (0.0024) 8.67 (0.2000) 1.73 (1.0000)
Vol%
(#CNTs)
Rbd-m-CN [x10-8 m2K/W]
(fm-CN) 4.36 0.44 0.17 0.09 ( 0.02 0.20 0.50 1.00)
Rbd-m-CN [x10-8 m2K/W]
(fm-CN)
4.36 0.44 0.17 0.09 ( 0.02 0.20 0.50 1.00)
Rbd-m-CN [x10-8 m2K/W]
(fm-CN)
174 4.36 0.44 0.17 0.09 (5x10⁻⁴ 0.02 0.20 0.50 1.00)
Rbd-m-CN [x10-8 m2K/W]
(fm-CN)
174 4.36 0.44 0.17 0.09 (5x10⁻⁴ 0.02 0.20 0.50 1.00)
Rbd-m-CN [x10-8 m2K/W]
(fm-CN)
174 4.36 0.44 0.17 0.09 (5x10⁻⁴ 0.02 0.20 0.50 1.00) SWNTs ∥ Heat flux SWNTs ∥ Heat flux
1.0 (22) 8.0 (179) 20.0 (448)
1.59 3.30 4.22 4.83 3.44 9.52 14.1 17.8 4.89 15.3 24.7 34.8
1.62 3.44 4.48 5.42 3.97 13.2 21.3 28.3 6.63 28.1 53.3 80.8
1.03 1.66 3.59 4.71 5.46 1.21 4.32 15.1 25.3 34.5 1.57 7.79 35.2 70.9 112
1.02 1.64 3.65 4.85 5.60 1.15 4.20 15.1 26.1 37.1 1.36 7.39 36.6 79.4 132
- 1.65 3.75 5.02 5.96 - 4.38 17.4 31.1 44.6 - 8.13 48.6 116 209 SWNTs ^ Heat flux SWNTs ^ Heat flux
1.0 (22) 8.0 (179) 20.0 (448)
0.98 0.99 1.00 1.01 0.83 0.90 0.98 1.07 0.67 0.78 0.95 1.21
0.98 0.99 1.00 1.01 0.84 0.92 1.02 1.12 0.74 0.89 1.07 1.31
0.97 0.98 0.99 1.00 1.01 0.82 0.84 0.95 1.06 1.17 0.68 0.80 1.05 1.24 1.46
0.96 0.97 0.98 0.99 1.01 0.79 0.83 0.89 0.97 1.07 0.59 0.65 0.76 0.93 1.20
- 0.98 0.99 1.00 1.01 - 0.82 0.89 0.98 1.07 - 0.52 0.64 0.85 1.22
24
8.0 (16) 20.0 (40)
2.24 5.09 6.76 8.13 3.34 9.24 13.7 17.8
2.44 5.96 8.17 9.89 4.10 13.0 20.1 26.2
1.08 2.56 6.38 8.83 10.7 1.25 4.47 14.5 22.7 30.4
1.05 2.52 6.65 9.49 11.7 1.15 4.35 16.0 26.9 38.1
- 2.56 6.93 9.94 12.2 - 4.62 18.4 30.8 42.3 MWNTs ^ Heat flux MWNTs ^ Heat flux
1.0 (2) 8.0 (16) 20.0 (40)
0.99 1.00 1.01 1.02 0.87 1.00 1.10 1.17 0.73 1.02 1.26 1.48
0.99 1.01 1.02 1.02 0.88 1.01 1.10 1.16 0.87 1.53 1.97 2.31
0.98 0.99 1.01 1.01 1.02 0.87 0.89 1.01 1.10 1.16 0.77 0.89 1.64 2.18 2.62
0.97 0.98 0.99 1.01 1.01 0.85 0.87 0.99 1.07 1.13 0.67 0.70 0.98 1.21 1.37
- 0.99 1.00 1.01 1.02 - 0.87 1.00 1.08 1.14 - 0.67 0.97 1.19 1.36
Table 3. Effects of CNT isolation degree on thermal conductivities of the 20 vol% SWNT- and MWNT-PNCs with highest CNT-CNT TBR and randomly distributed CNTs.
Keff/Km Rbd-CN-CN = 24.8x10⁻⁸ m2K/W
(fCN-CN = 0.0024) CNT
isolation degree [%]
Rbd-m-CN [x10-8 m2K/W]
(fm-CN)
4.36 0.44 0.17 0.09 (0.02 0.20 0.50 1.00)
Rbd-m-CN [x10-8 m2K/W]
(fm-CN)
4.36 0.44 0.17 0.09 ( 0.02 0.20 0.50 1.00) SWNTs ∥ Heat flux SWNTs ^ Heat flux 100.0
67.9 32.5
7.39 36.6 79.4 132 6.51 24.9 44.9 68.3 4.89 15.3 24.7 34.8
0.65 0.76 0.93 1.20 0.66 0.77 0.94 1.21 0.67 0.78 0.95 1.21 MWNTs ∥ Heat flux MWNTs ^ Heat flux 100.0
67.5 40.0 0.00
4.35 16.0 26.9 38.1 3.40 9.95 15.2 20.1 3.34 9.24 13.7 17.8 3.24 8.66 12.4 15.4
0.70 0.97 1.19 1.36 0.71 0.99 1.22 1.41 0.73 1.02 1.26 1.48 1.03 1.40 1.64 1.87
Figures
Figure 1. This figure is irrespective of SWNT and MWNT, it covers both. Parameters used in this study: (a) Schematic drawing of CNTs with different interfaces and therefore TBRs, and a top (y-z plane) view of 20 CNTs (b) uniform CNT distribution (square packing); (c) 100.0 % CNT isolation degree (no contact); (d) random distribution and random contact (40.0% isolated CNTs); and (e) random distribution with 0.0% isolated CNTs dispersed in the CNT-epoxy composite at 20 vol% of the CNTs, respectively.
Figure 2. These plots consider the effects of high and low CNT-CNT TBR with 40% isolated MWNTs. Comparison of effective thermal conductivity of MWNT-epoxy having the CNT-CNT contact with different CNT-CNT TBRs, Rbd-CN-CN=1.73x10⁻⁸ m2K/W (solid dots) and 24.8x10⁻⁸ m2K/W (open dots) as a function of thermal boundary resistance with different volume fractions of CNTs and the CNTs oriented (a) parallel and (b) perpendicular to the heat flux.
Figure 3. Comparison of MWNT-epoxy (solid dots and solid lines) and SWNT-epoxy (open dots and dashed lines) composites effective thermal conductivity at the lowest CNT-CNT TBR, Rbd-CN-CN= 1.73x10⁻⁸ m2K/W with 40% isolated CNTs and the CNTs oriented (a) parallel and (b) perpendicular to the heat flux as a function of thermal boundary resistance with different CNT volume fractions.
Figure 4. Comparison of effective thermal conductivity of MWNT-epoxy with (open dots, lowest CNT-CNT TBR, Rbd-CN-CN= 1.73x10⁻⁸ m2K/W) and without (solid dots) CNT-CNT contact as a function of CNT-matrix thermal boundary resistance with different volume fractions of CNTs and the CNTs oriented (a) parallel and (b) perpendicular to the heat flux.
Figure 5. Comparison of thermal conductivity anisotropy (Keff-parallel/Keff-perpendicular) of MWNT- epoxy composites with (open dots, highest CNT-CNT TBR, Rbd-CN-CN= 24.8x10⁻⁸ m2K/W) and without (solid dots) the CNT-CNT contact as a function of CNT-TBR thermal boundary resistance with different volume fractions of CNTs.
Figure 6. Comparison of effective thermal conductivity of MWNT-epoxy (solid dots and solid lines) and SWNT-epoxy (open dots and dashed lines) composites having 20vol% and highest CNT-CNT TBR, Rbd-CN-CN= 24.8x10⁻⁸ m2K/W as a function of CNT-matrix thermal boundary
resistance with different CNT isolation degree and the CNTs oriented (a) parallel and (b) perpendicular to the heat flux.
Figure 7. Comparison of effective thermal conductivity of MWNT-epoxy having no CNT-CNT contact with uniform CNT distribution (solid dots) and with random CNT distribution (open dots) effects with as a function of CNT-matrix thermal boundary resistance with different volume fractions of CNTs and the CNTs oriented (a) parallel and (b) perpendicular to the heat flux.
Figure 8. Comparison of effective thermal conductivity of MWNT-epoxy (solid dots, solid lines) and SWNT-epoxy (open dots and dashed lines) composites having no CNT-CNT contact with uniform CNT distribution as a function of CNT-matrix thermal boundary resistance with different volume fractions of CNTs and the CNTs oriented (a) parallel and (b) perpendicular to the heat flux.
(a)
(b) (c) (d) (e)
Figure 1. This figure is irrespective of SWNT and MWNT, it covers both. Parameters used in this study: (a) Schematic drawing of CNTs with different interfaces and therefore TBRs, and a top (y-z plane) view of 20 CNTs (b) uniform CNT distribution (square packing); (c) 100.0 % CNT isolation degree (no contact); (d) random distribution and random contact (40.0% isolated CNTs); and (e) random distribution with 0.0% isolated CNTs dispersed in the CNT-epoxy composite at 20 vol% of the CNTs, respectively.
Uniform distribution, no CNT contact
Random distribution, no CNT contact
Random distribution, 40.0% isolated CNTs
Random distribution, 0.0% isolated CNTs Non contacting CNTs CNT-CNT contact
Matrix
Line contact Heat flux parallel
to CNTs
Rbd-m-CN
Rbd-CN-
heat source
Rbd-CN-CN
Aligned CNTs Matrix
Heat flux perpendicular to
CNTs
z 300 nm
100 nm
100nm
y
x
Illustration not to scale
Figure 2. These plots consider the effects of high and low CNT MWNTs. Comparison of effective thermal conductivity of MWNT contact with different CNT-CNT TBRs,
m2K/W (open dots) as a function of thermal boundary resistance with different volume fraction CNTs and the CNTs oriented (a) parallel and (b) perpendicular to the heat flux.
Keff/Km
Keff/Km
(a)
(b)
These plots consider the effects of high and low CNT-CNT TBR with Comparison of effective thermal conductivity of MWNT-epoxy
CNT TBRs, Rbd-CN-CN=1.73x10⁻⁸ m2K/W (solid dots) and ction of thermal boundary resistance with different volume fraction CNTs oriented (a) parallel and (b) perpendicular to the heat flux.
CNT-matrix thermal boundary resistance, Rbd-m-CN [x10-8 m2K/W]
○
è
20 vol%∆ò 8 vol%
ù î
1 vol%CNT-matrix thermal boundary resistance, Rbd-m-CN [x10-8 m2K/W]
○
è
20 vol%∆ò 8 vol%
ù î
1 vol%Parallel
Perpendicular
Rbd-CN-CN
max
Rbd-CN-CN min
CNT TBR with 40% isolated having the CNT-CNT K/W (solid dots) and 24.8x10⁻⁸ ction of thermal boundary resistance with different volume fractions of CNTs oriented (a) parallel and (b) perpendicular to the heat flux.
Figure 3. Comparison of MWNT dots and dashed lines) composites Rbd-CN-CN= 1.73x10⁻⁸ m2K/W with perpendicular to the heat flux as a fu volume fractions.
Keff/KmKeff/Km
(a)
(b)
Comparison of MWNT-epoxy (solid dots and solid lines) and SWNT ) composites effective thermal conductivity at the lowest CNT
with 40% isolated CNTs and the CNTs oriented (a) parallel and (b) perpendicular to the heat flux as a function of thermal boundary resistance with different
CNT-matrix thermal boundary resistance, Rbd-m-CN [x10-8 m2K/W]
○
è
20 vol%∆ò 8 vol%
ù î
1 vol%CNT-matrix thermal boundary resistance, Rbd-m-CN [x10-8 m2K/W]
(b)
○
è
20 vol%∆ò 8 vol%
ù î
1 vol%Parallel
Perpendicular
SWNT MWNT
) and SWNT-epoxy (open at the lowest CNT-CNT TBR, CNTs oriented (a) parallel and (b) ction of thermal boundary resistance with different CNT
Figure 4. Comparison of effective thermal conductivity of MWNT lowest CNT-CNT TBR, Rbd
contact as a function of CNT-
of CNTs and the CNTs oriented (a) parallel and (b) perpendicular to the heat flux Keff/KmKeff/Km
(a)
(b)
Comparison of effective thermal conductivity of MWNT-epoxy
bd-CN-CN= 1.73x10⁻⁸ m2K/W) and without (solid -matrix thermal boundary resistance with different CNTs oriented (a) parallel and (b) perpendicular to the heat flux
CNT-matrix thermal boundary resistance, Rbd-m-CN [x10-8 m2K/W]
CNT-matrix thermal boundary resistance, Rbd-m-CN [x10-8 m2K/W]
○
è
20 vol%∆ò 8 vol%
ù î
1 vol%Parallel
Perpendicular
○
è
20 vol%∆ò 8 vol%
ù î
1 vol%With CNT contact
Without CNT contact
epoxy with (open dots, solid dots) CNT-CNT thermal boundary resistance with different volume fractions CNTs oriented (a) parallel and (b) perpendicular to the heat flux.
Figure 5. Comparison of thermal conductivity epoxy composites with (open
without (solid dots) the CNT
resistance with different volume fraction CNT Keff-parallel/Keff-perpendicular
CNT-CNT
Comparison of thermal conductivity anisotropy (Keff-parallel/Keff-
open dots, highest CNT-CNT TBR, Rbd-CN-CN= 24.8 CNT-CNT contact as a function of CNT-TBR resistance with different volume fractions of CNTs.
CNT-matrix thermal boundary resistance, Rbd-m-CN [x10-8 m2K/W]
○
è
20 vol%∆ ò 8 vol%
ù î
1 vol%CNT contact CNT contact CNT TBR
-perpendicular) of MWNT- 24.8x10⁻⁸ m2K/W) and TBR thermal boundary
Figure 6. Comparison of effective thermal conductivity of MWNT lines) and SWNT-epoxy (open dots
CNT-CNT TBR, Rbd-CN-CN= 24.8x10 resistance with different CNT perpendicular to the heat flux.
CNT Keff/Km
(a)
Keff/Km
Comparison of effective thermal conductivity of MWNT-epoxy (solid dots epoxy (open dots and dashed lines) composites having 20vol% and
= 24.8x10⁻⁸ m2K/W as a function of CNT-matrix
CNT isolation degree and the CNTs oriented (a) parallel and (b) perpendicular to the heat flux.
CNT-matrix thermal boundary resistance, Rbd-m-CN [x10-8 m2K/W]
Parallel
CNT-matrix thermal boundary resistance, Rbd-m-CN [x10-8 m2K/W]
Perpendicular ○
è
100.0%∆ò68-67.5%
ù î
32.5-40%○
è
100.0%∆ò68-67.5%
ù î
32.5-40%SWNT Isolation degree
epoxy (solid dots and solid having 20vol% and highest matrix thermal boundary CNTs oriented (a) parallel and (b)
Figure 7. Comparison of effective thermal conductivity of MWNT contact with uniform CNT distribution
dots) effects as a function of
fractions of CNTs and the CNTs oriented (a) parallel and (b) perpendicular to the heat flux.
Keff/KmKeff/Km
(a)
(b)
Comparison of effective thermal conductivity of MWNT-epoxy
with uniform CNT distribution (solid dots) and with random CNT distribution
ction of CNT-matrix thermal boundary resistance with different volume CNTs oriented (a) parallel and (b) perpendicular to the heat flux.
CNT-matrix thermal boundary resistance, Rbd-m-CN [x10-8 m2K/W]
○
è
20 vol%∆ ò 8 vol%
ù î
1 vol%○
è
20 vol%∆ò 8 vol%
ù î
1 vol%CNT-matrix thermal boundary resistance, Rbd-m-CN [x10-8 m2K/W]
Parallel
Perpendicular
Random Uniform
epoxy having no CNT-CNT with random CNT distribution (open thermal boundary resistance with different volume CNTs oriented (a) parallel and (b) perpendicular to the heat flux.
Figure 8. Comparison of effective thermal conductivity of MWNT and SWNT-epoxy (open dots
uniform CNT distribution as a fu different volume fractions of CNTs the heat flux.
Keff/Km
CNT Keff/Km
(b) (a)
effective thermal conductivity of MWNT-epoxy (solid dots epoxy (open dots and dashed lines) composites having no CNT
as a function of CNT-matrix thermal boundary resistance with of CNTs and the CNTs oriented (a) parallel and (b) perpendicular to
CNT-matrix thermal boundary resistance, Rbd-m-CN [x10-8 m2K/W]
○
è
20 vol%∆ò 8 vol%
ù î
1 vol%CNT-matrix thermal boundary resistance, Rbd-m-CN [x10-8 m2K/W]
(b)
○
è
20 vol%∆ò 8 vol%
ù î
1 vol%Parallel
Perpendicular
SWNT MWNT
epoxy (solid dots, solid lines) CNT-CNT contact with thermal boundary resistance with CNTs oriented (a) parallel and (b) perpendicular to