Liquid Droplet in Contact with a Solid Surface
S. Maruyama1, T. Kurashige, S. Matsumoto2, Y. Yamaguchi and T. Kimura Department of Mechanical Engineering, The University of Tokyo
7-3-1 Hongo, Bunkyo-ku, Tokyo 113, Japan
Abstract
A liquid droplet in contact with a solid surface was simulated by the molecular dynamics method, in order to study the microscopic aspects of the liquid-solid contact phenomena and phase change heat transfer. Measured ‘contact angle’ was well correlated by the depth of the integrated potential of the surface. The layered liquid structure near the surface was also explained with the integrated potential field. Furthermore, the evaporation and condensation through the droplet were simulated by preparing two solid surfaces with temperature differences on the top and bottom of the calculation domain. Over all heat flux and temperature distributions of droplets were measured.
Introduction
1To whom correspondence should be addressed: e-mail: [email protected]
2 Current address: Mechanical Engineering Laboratory, Agency of Industrial Science and Technology /MITI, 1-2 Namiki, Tsukuba, Ibaraki 305, Japan
The microscopic mechanism of solid-liquid contact is fundamental to understanding phase change phenomena such as dropwise condensation and the collapse of liquid film on a heated surface. We have applied the molecular dynamics method to understand interphase phenomena, such as surface tension [1,2] and liquid-solid contact [3]. Our previous study [3] demonstrated that the droplet could be regarded as a semi-spherical shape except for a few layers of liquid structure on the surface, and that the cosine of ‘contact angle’ was a linear function of the energy scale of the interaction potential. In this report, by changing more parameters such as the length scale of the interaction potential, system size, and temperature, we give a more general description of the phenomena. As surface molecules were expressed by a single layer of fixed molecules in the previous report, in this report, we show two different levels of approximations for the surface in this report: even simpler one-dimensional function and more complex three layers of harmonic molecules. Finally, through the simulation of actual phase change, the microscopic characteristics of heat transfer are discussed.
Equilibrium droplet
Similar simulations as in the previous report [3] were performed with the modification of the surface condition. A molecular dynamics simulation was designed to achieve an equilibrium state of the liquid droplet and its vapor on a solid surface under the NVE ensemble. Fig. 1
illustrates the initial configuration and liquid vapor equilibrium condition after 1000 ps. Here, the liquid and vapor molecules were distinguished by the potential field felt by each molecule. The liquid droplet and the vapor consisted of Lennard-Jones molecules with the interaction potential expressed as
−
=
6 12
4 )
(r ε σr σr
φ . (1)
For physical insights, we regarded the molecule as argon with the potential parameters set as: σAR
= 3.4 Å, εAR = 1.67 × 10⁻²¹ J. The calculation region had periodic boundaries for four side surfaces and a mirror boundary (or a hard wall boundary) for the top surface. The bottom surface was expressed by either one-dimensional potential function, fixed single layer of solid molecules, or three layers of harmonic molecules. We modeled the fcc (1,1,1) surface with the nearest neighbor distance σS = 2.77 Å, the spring constant k = 46.8 N/m and mass mS = 32.39 × 10⁻²⁶ kg (the platinum crystal was modeled). The interaction potential between solid and argon molecules was also expressed by the Lennard-Jones potential with the parameters σINT and εINT. For the one-dimensional potential function we have integrated the one-layer of fcc (1,1,1) surface as
−
= Φ
4 10
2 2
5 15 2
3 ) 4
(z zINT zINT
S INT
INT σ σ
σ σ ε
π , (2)
where z was the coordinate normal to the surface. There was another one-dimensional function
available in a textbook [4]: the full integration of uniform solid molecules. However, we believe that our form of one-layer integration must give better representation of the potential field very near the surface, and that it is suitable for a direct comparison with our other representations of the surface. The second and third solid layers can be taken into account by just adding the same function with a shift of z of the lattice constant. Here, it should be noticed that the minimum εSURF
of this function in Eq. (2) appears when z = σINT as
εSURF =(4 3π/5)(σINT2/σS2)εINT. (3) The equation of motion was numerically integrated utilizing the Verlet algorithm [4] with a time step of 0.01 ps. Equilibration and data acquisition was the same as in our previous report [3].
Note that the effect of the initial condition was negligible for the equilibrium results and the same equilibrium state could be obtained even from a dense gas-phase initial condition.
Fig. 2 shows the two-dimensional density profiles [3] for various sizes of the droplet. With the increase of the number of liquid molecules, the relative percentage of bulk liquid increases.
The contact angle θ was measured by fitting a circle to the density contour ignoring the layered part as before [3]. It is rather surprising that the contact angle was nearly the same even with only a few hundreds molecules constituting the droplet. The smaller droplet was mostly made of the layered structure[5], and the measurement of the contact angle was difficult.
The effect of the temperature on the contact angle was too small to be described within our
uncertainty, though the two-dimensional density distributions seemed quite different. The liquid- vapor interface was more diffuse, and the first liquid layer was more prominent for higher temperature.
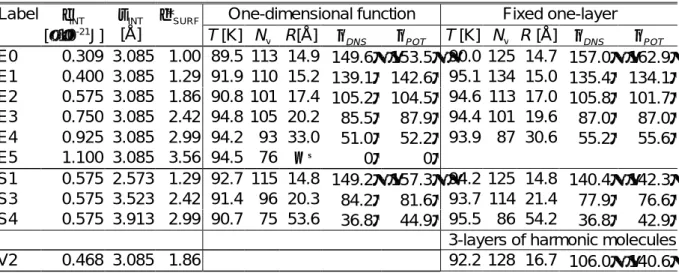
It was found that the contact angle was correlated with the integrated depth of the surface potential εSURF [see Eq. (3)] as demonstrated in Fig. 3. Parameters of the interaction potential σINT and εINT were changed from complete wetting (θ = 0°) through complete drying (θ = 180°) as
shown in Table 1. The representation of the surface molecules did not affect the result as long as the εSURF was the same. Furthermore, the two-dimensional density and potential distributions were almost non-distinguishable among three different surface conditions.
Here, the well-known Young's equation for the macroscopic contact angle is expressed as
cosθ =
(
γsg − γsl)
γlg , (4)where γsg, γsl, and γlg are surface energies of solid-vapor, solid-liquid, and liquid-vapor interfaces, respectively. Even though the early molecular dynamics study concluded that the Young's equation was not applicable to the microscopic system [6], later studies suggested opposite results [7, 8]. If we assume that the difference of the solid related surface energy γsg − γsl is proportional to the potential parameter as expected from [7, 8], our result supports Young's equation for the main body of the droplet.
The layered structure is unique to the microscopic droplets. As the droplet size becomes
smaller, characteristics of this structure dominate the whole shape as shown in Fig. 2. Fig. 4 compares the profiles of liquid density for various energy scale εINT. The first peak appeared at σINT from the solid molecule and successive peaks appeared at intervals of σAR (similar picture
with varying σINT supported this relationship). These relations can be clearly understood by Fig.
5, which compares the density profile with the integrated potential function. The similarity of the density profile and the integrated potential suggests that the density profile is simply determined by the effective potential field and the temperature. As the first liquid layer is built up by the surface molecules, it works as the imperfect surface for the second liquid layer and so on.
Inequilibrium droplet (Phase change heat transfer)
Characteristics of phase change heat transfer were studied with the system as shown in Fig. 6. Solid surfaces on top and bottom of the calculation domain were represented by three layers of harmonic molecules with additional 'phantom' molecules [9]. The phantom molecules, which mimicked the continuous bulk solid, were introduced to give the constant temperature boundary conditions. Solid molecules in the third layer were connected to phantom molecules through springs (vertical and horizontal spring constants were 0.5k and 2k, respectively). Then,
phantom molecules were connected to the fixed frame by springs (vertical and horizontal constants were 3.5k and 2k, respectively) and dampers with the damping constant α = 5.184 × 10-
12 [kg/s]. The phantom molecules were further excited by artificial random force with the standard deviation σF = 2αkBT/∆t, where kB is the Boltzmann constant and ∆t is the time step.
Fig. 7 shows the time sequence of the calculation. We prepared a solid surface and a droplet separately in equilibrium at 100 K, and merged them to the configuration of Fig. 6.
Then, after calculating 200 ps for the relaxation, top and bottom phantom molecules were suddenly set to 85 K and 115 K, respectively. The phase change process can be clearly seen in the change of the number of molecules NLcond(droplet in condensing side), NLevap (evaporating side) and NV (vapor) in the bottom panel of Fig. 7. Since NV was almost constant, the condensation rate and the evaporation rate were almost the same. The temperature of solid surfaces TSevap (bottom) and TScond (top) quickly jumped to the phantom temperature, but the temperature difference of two liquid droplets was very small. This result showed that the liquid- solid contact thermal resistance was dominant compared with heat conduction and phase change thermal resistances. We assumed that the heat transfer was quasi-steady (rate of phase change was constant) after 500 ps, and measured the heat flux, velocity, and temperature distributions. The average heat flux measured at the middle of the calculation domain was 24 MW/m2, which is the
order of the maximum heat flux possible in phase change.
Fig. 8 shows the velocity and temperature distributions on the evaporation side. The velocity distribution compared with the density distribution (top panel of Fig. 8) shows that the evaporation at the three phase contact line (or the first layer of liquid) was most dominant, and some supply flow of liquid from the middle of the droplet to the first layer was observed. The higher droplet temperature at the three phase contact line also supports this observation. The temperature of the first layer of the solid was lower under this area and higher under the center of the droplet due to the thermal insulation provided by the liquid.
The same representations on the condensing side are shown in Fig. 9. Here, the specialty at the three-phase contact line was less pronounced, and rather uniform condensation over the whole liquid surface was observed. The temperature distribution of the liquid exhibited a simple linear increase along z direction, and the decrease of solid surface temperature at the center is simply explained by the thermal insulating effect of the liquid droplet.
The measured contact angle was almost the same for both condensing and evaporating droplets as recognized in Figs. 8 and 9. It seems that the contact angle was principally determined by the surface energy balance and was not very sensitive to the lower-energy temperature distributions.
We noticed that three layer solid molecules had been too thin to consider such a problem
with the temperature distribution in the radial direction. Even though we were confident of the usage of the phantom technique through equilibrium calculations of other systems, imposing the uniform temperature just three-layers below the first layer with temperature distribution as seen in Figs. 8 and 9 was actually unacceptable. If we could use reasonably thicker solid layers, probably the solid layer temperature distribution would be more pronounced. Furthermore, the slight upper shift (about 3 K) of the solid temperature from the phantom set value observed in Fig.
7 seems to be due to this problem. Even though the computer time and memory crucially limit the number of solid molecules, calculations with a thicker solid layer in the future are desired.
Conclusions
A liquid droplet in contact with a solid surface was simulated by the molecular dynamics method. The liquid droplet and surrounding vapor were realized by Lennard-Jones molecules, and the solid surface was represented by three types of models: three layers of harmonic molecules, one layer of fixed molecules, or a simple one-dimensional function. The interaction potential between solid molecules and liquid/vapor molecules was represented by the Lennard- Jones potential with various length and energy parameters.
It was found that the cosine of the contact angle was well expressed by a linear function of the depth of the integrated interaction potential, regardless of surface representations. Assuming
that the surface energy was proportional to the potential depth, the macroscopic Young’s equation was still valid even for such a small droplet. On the other hand, the layered structure appeared in the two-dimensional density profile of droplet was well explained through the shape of the integrated interaction potential.
By preparing two solid surfaces with different temperatures, evaporation in one droplet and the condensation on the other were simulated simultaneously. The contact angle was almost the same as the equilibrium condition. Velocity and temperature distributions of droplets evaporating and condensing as well as the heat flux were measured for the quasi-steady condition.
The importance of the three-phase contact line in the evaporation process in clear contrast to the condensation process was observed.
References
1. S. Maruyama, S. Matsumoto and A. Ogita, Surface Phenomena of Molecular Clusters by Molecular Dynamics Method, Thermal Science & Engineering, vol. 2, no. 1, pp. 77-84, 1994.
2. S. Maruyama, S. Matsumoto, M. Shoji and A. Ogita, A Molecular Dynamics Study of Interface Phenomena of a Liquid Droplet, Proc. 10th International Heat Transfer Conf., Brighton, vol. 3, pp. 409-414, 1994.
3. S. Matsumoto, S. Maruyama and H. Saruwatari, A Molecular Dynamics Simulation of a
Liquid Droplet on a Solid Surface, Proc. ASME · JSME Thermal Engng. Joint Conf., Maui, vol. 2, pp. 557-562, 1995.
4. M. P. Allen and D. J. Tildesley, Computer Simulation of Liquids, Oxford, 1987.
5. J. N. Israelachvili, Intermolecular and Surface Forces, Academic Press, 1985.
6. G. Saville, Computer Simulation of the Liquid-Solid-Vapour Contact Angle, J. Chem. Soc.
Faraday Trans. 2, vol. 73, pp. 1122-1132, 1977.
7. J. H. Sikkenk, J. O. Indekeu, J. M. J. van Leeuwen, E. O. Vossnack and A. F. Bakker, Simulation of Wetting and Drying at Solid-Fluid Interfaces on the Delft Molecular Dynamics Processor, J. Statistical Physics, vol. 52, nos. 1/2, pp. 23-44, 1988.
8. M. J. P. Nijmeijer, C. Bruin and A. F. Bakker, Wetting and Drying of an Inert Wall by a Fluid in a Molecular-Dynamics Simulation, Physical Rev. A, vol. 42, no. 10, pp. 6052-6059, 1990.
9. J. Blömer and A.E. Beylich, MD-Simulation of Inelastic Molecular Collisions with Condensed Matter Surfaces, Proc. of 20th International Symp. on Rarefied Gas Dynamics, Beijing, pp.
392-397, 1997.
Caption to Figures
Fig. 1. Snapshots of a liquid droplet on the solid surface. Gray, dark gray and white circles correspond to solid, liquid and vapor molecules, respectively.
Fig. 2. The effect of liquid size on the two-dimensional density profile.
Fig. 3. Dependency of the contact angle on the depth of the integrated potential. Variable εINT
and σINT correspond to conditions Ex and Sx in Table 1, respectively.
Fig. 4. Density distributions of liquid near the solid surface. See Table 1 for Ex labels.
Fig. 5. Relationship of the density profile and the integrated potential function (E2 condition in Table 1).
Fig. 6. A snapshot of inequilibrium droplets on solid surfaces.
Fig. 7. Variations of temperature and number of molecules. T and N are temperature and number of molecules, respectively. Subscripts S, L, and V represent solid, liquid, and vapor, respectively, and superscripts evap and cond represent evaporation side (bottom) and condensation side (top), respectively.
Fig. 8. Characteristics of evaporating droplet. Top: density profile and velocity vectors, middle:
temperature distribution in the droplet, bottom: temperature distribution of the first layer of solid surface.
Fig. 9. Characteristics of condensing droplet. Top: density profile and velocity vectors, middle:
temperature distribution in the droplet, bottom: temperature distribution of the first layer of solid surface.
Table 1. Calculation conditions and contact angle. Here, ε*SURF = εSURF / εAR, T: temperature, Nv:
number of vapor, R: radius of fitting circle, θDNS: contact angle measured from density profile, θPOT: contact angle measured from potential profile.
One-dimensional function Fixed one-layer Label εINT
[×10-21J]
σINT
[Å]
ε*SURF
T [K] Nv R[Å] θDNS θPOT T [K] Nv R [Å] θDNS θPOT
E0 0.309 3.085 1.00 89.5 113 14.9 149.6° 153.5°90.0 125 14.7 157.0° 162.9° E1 0.400 3.085 1.29 91.9 110 15.2 139.1° 142.6°95.1 134 15.0 135.4° 134.1° E2 0.575 3.085 1.86 90.8 101 17.4 105.2° 104.5°94.6 113 17.0 105.8° 101.7° E3 0.750 3.085 2.42 94.8 105 20.2 85.5° 87.9°94.4 101 19.6 87.0° 87.0° E4 0.925 3.085 2.99 94.2 93 33.0 51.0° 52.2°93.9 87 30.6 55.2° 55.6° E5 1.100 3.085 3.56 94.5 76 ∼ ∞ 0° 0°
S1 0.575 2.573 1.29 92.7 115 14.8 149.2° 157.3°94.2 125 14.8 140.4° 142.3° S3 0.575 3.523 2.42 91.4 96 20.3 84.2° 81.6°93.7 114 21.4 77.9° 76.6° S4 0.575 3.913 2.99 90.7 75 53.6 36.8° 44.9°95.5 86 54.2 36.8° 42.9° 3-layers of harmonic molecules
V2 0.468 3.085 1.86 92.2 128 16.7 106.0° 140.6°
(A ) Initial (B )1 0 0 0p s
(A) N
liq= 130, T = 92 K, θ = 71
o(B) N
liq= 360, T = 99 K, θ = 85
oFig. 2 S . M aruy ama et al.
1 2 3 4 –1
0 1
ε * SURF = ε SURF / ε AR cos θ =–h c /R
Variable ε INT Variable σ INT
Solid: Density
Open: Potential
Surface motion
0 10 0
0.1 0.2
Distance from Surface [Å]
Number Density [1/Å 3 ]
E0 E1 E2 E3 E5 E4
σ INT σ AR
5
0 2 4 6 8 –4
–2 0 2
0 0.05
Distance from Surface z [Å]
Potential E nergy [J] Number Density [1/Å]
Vibration Range K. E. = k B T
[x10 –21 ]
Density Prof.
σ INT
Φ (z)
ε SURF
17 8.0 8 4 Å
77.560 Å
7 6 .7 6 4 Å
}
}
3 solid layers
3 solid layers liquid droplet
liquid droplet
vapor molecules
}
heating
cooling
0 200 400 600 800 200
400 100 120
Temperature [K]
Time [ps]
Number of M o lecules
T
VT
SevapT
ScondT
LevapT
LcondN
VN
LevapN
Lcondinequilibrium
Velocity distribution
30
20
10
Height (Å)
0 10 20 30 40
Radius (Å)
Height (Å)
2010 30
Temperature distribution in the droplet
Tem p er a tur e (K )
Radius (Å)
120
118
0 10 20 30 40
Temperature distribution of the 1st solid layer
20
10
Height (Å)
Temperature distribution in the droplet 30
Radius (Å)
88
86
0 10 20 30 40
Tem p er a tur e (K )
Temperature distribution of the 1st solid layer
Height (Å)
30
20
10
Radius (Å)
0 10 20 30 40
Velocity distribution