Hironori Tsuruzono
Deloitte Tohmatsu Tax Co., Deloitte Touche Tohmatsu Ltd.,
Shin-Tokyo Building 5F, 3-3-1, Marunouchi, Chiyoda-ku, Tokyo 100-8305, Japan E-mail:[email protected]
Yoichiro Fujii† Tatsuya Goto‡ Yoshinori Hattori§ Faculty of Economics, Osaka Sangyo University, 3-1-1, Nakagauchi, Daito, Osaka 574-8530, Japan
E-mail:†[email protected]
Ryuichiro Ishikawa¶
Faculty of Engineering, Information and Systems, University of Tsukuba, 1-1-1, Ten-nodai, Tsukuba, Ibaraki 305-8573, Japan
E-mail:[email protected]
March 31, 2015
Abstract
In the standard economic theory, informed traders have more advantages in economic activities than uninformed ones. In particular, it seems obvious that one can obtain more gains in financial markets by having more information about the fundamental values of an asset. This study examines whether better-informed traders have an advantage over less-informed ones by conducting experimental asset markets following Huber, et al. (2008,Journal of Economic Behavior & Organization). Our experiments show that better-informed traders do not necessarily gain more than less-informed ones.
JEL Classification: C90; D84.
Keywords: Asymmetric information, asset markets, experiments.
Manuscript received, January 15, 2015; final revision received, April 9, 2015.
∗This research is partially supported by financial aids from Inamori Foundation, Ishii Memorial Securities Research Promotion Foundation, the Inter-University Collaborated Research, Osaka Sangyo University, and Grant-in-Aid for Exploratory Research, No. 26590026. Views expressed in this paper are those of the authors and do not necessarily reflect the official views of Deloitte Touche Tohmatsu.
¶Corresponding author.
1. Introduction
As often mentioned in the information economics, agents with more information have an advantage in economic activities, although the advantage often promotes market failure such as adverse selection and moral hazard. However, the recent literature on information acquisition shows that informed traders do not necessarily outperform the uninformed ones in financial markets (cf. Sciubba, 2005). In this study, we consider a simpler setting with no information acquisition costs in experimental asset markets, and examine whether informed traders earn more profits in asset trading than uninformed ones. Moreover, we examine how asymmetric information impacts the decisions of subjects in experimental asset markets.
Information in financial markets means knowledge on the fundamental values of an asset. The fundamental values of an asset comprise the value the asset truly creates. If a trader has this information, she/he can compare it with the price and make a right decision: if the price is higher than the fundamental value, she/he will sell the asset;
otherwise, she/he will buy it. This is theoretically derived from the standard literature of rational expectations equilibrium since Grossman (1976). However, it is doubtful whether the subjects in experiments make such rational decisions.
Several researchers have conducted experimental asset markets to examine such infor- mation advantages in trading. Copeland and Friedman (1992) and Ackert et al. (2002) showed that informed traders outperformed uninformed ones. However, their setting con- sisted of two extreme types of subjects: those completely informed and those completely uninformed. Schredelseker (1984, 2001) and Huber et al. (2008) modified the treatment of information. They considered a case having more than two information levels. In addition, the information was cumulatively given to traders; that is, a better-informed trader knows everything that a less-informed trader knows. This depicts a situation such that better- informed traders usually have both public and private information whereas less-informed ones have only public information. This cumulative information system enabled them to examine the marginal effects of additional information.
Furthermore, Huber et al. (2008) compared the magnitude of information advantage under different mechanisms. They implemented two types of market mechanisms, a call marketanda double auction market. In addition, they distinguished two ways to determine the fundamental values of an asset: (i) a binary process whereby the fundamental values are determined in either 0s or 1s with probability12, and (ii) a Markov process whereby the value of dividend changes within±50% of the present dividend. Thus, they had four types of experiments depending on two different market mechanisms and two rules to determine the fundamental values. However, they conducted only three experiments, leaving out the call market with Markov process, perhaps due to some difficulties in conducting such an experiment.
2
The main difficulty is the different settings between call markets and double auction markets. In the setting of Huber et al. (2008), while subjects hold initial stocks at the beginning in double auction markets, they do not do so in call markets. This is because call markets determine the buyers and sellers based on their orders. We consider this setting because Huber et al. (2008) tried to avoid the effects of loss aversion, as did Dupont and Lee (2002), who examined the prospect theory pioneered by Kahneman and Tversky (1979). However, although Huber et al. (2008, p. 90) introduced fundamental values following the Markov process to approximate real-world financial markets, it is not reasonable to set a call market with no initial stock or money. Therefore, we conduct the case they did not investigate. In particular, we provide initial stocks to subjects at the beginning of experiments.
The remainder of this paper is organized as follows: Section 2 explains our experimental design. While our experiments basically follow Huber et al. (2008), we improve on the difficulties as mentioned above. In Section 3, we show our results and compare them with those of Huber et al. (2008). In Section 4, we give our conclusions and suggestions for future works.
2. Experimental design
Following Huber et al. (2008), we conduct experiments in which a group of 10 subjects trade in assets in call markets. Before an experiment, each subject is given 30 stocks as initial holdings; an experiment consists of 30 trading periods.
Our experiments are computerized using Fischbacher’s (2007) z-tree, and the subjects trade by placing their bids through the individual computer screen, in front of which each of them sits. Subjects can take 40 seconds to decide their orders and another 20 seconds to check the results in each period. In bidding, each subject submits the price that she is willing to pay each period. The computer gathers the bidding prices and then decides the market price based on the median of bids in each period. That is, the market price of a group is determined by the average of the 5th and 6th bids. For example, if the bidding prices at a certain period are{0, 3, 4, 4, 5, 6, 7, 7, 7, 8}, the market price is 5.5, that is, the average of the 5th and 6th bids.
All traders who bid lower than the market price become sellers, and all the others become buyers. The bidding price is used only to determine whether a subject is a seller or buyer. In our call market, traders cannot choose to be either a seller or buyer of an asset; the role of seller or buyer is decided on the prices they turn in and the market price.
If the market price is the same that a subject turned in, the subject is neither a seller nor a buyer.
The traders’ payoff is decided based on the market price and fundamental values. There- fore, we first explain the fundamental values for each period before explaining how to decide the payoffs. When a subject holds an asset, she obtains dividends each period. In our experiment, the dividend is assumed to be determined following the Markov process,
where dividends change within±50% every period. That is, the next-period dividend is randomly chosen in the±50% change of the previous dividend.
We prepare two different schedules1 of dividends, as shown in Table 1. In the table, Game 1 is the schedule used in the first game and Game 2 that used in the second game.The average of the dividends in both the games is set identically.
Once the schedule of the dividends is given, the fundamental valueF Vtper asset at the beginning of periodtis calculated asF Vt=∑30
r=tdr, wheredtis the dividend at periodt.
That is, the fundamental value at periodtis the total value of dividends between period tand the last period. Those in Games 1 and 2 are also shown in Table 1. At the end of each period, subjects can observe the trading results, present dividend, future dividends, and fundamental values of the next period on the screen.
Given the market price and fundamental value at period t, the traders’ role as either seller or buyer is decided as mentioned above. If the market price at periodtisPt, with F Vtthe fundamental value, the payoffs of the buyers and seller are decided as follows:
Buyers’ payoff: F Vt−Pt; Seller’s payoff: Pt−F Vt.
The above payoffs imply that the same role, as either buyer or seller, obtains the same payoff. The payoff structure reflects the actual gains of the traders. Indeed, fundamental value literally means the value that an asset creates. While buyers enjoy the value minus the dealing costPt, sellers enjoy the profit.
Finally, we explain the information asymmetry the traders face. Traders in the ex- periments are explained all the setting we explain above. Then, they know that each of them has different information of fundamental values. Furthermore, as mentioned before, traders can see the trading results, their present dividend, their future dividends, and the fundamental values of the next period on the screen each period.
Information asymmetry is reflected in how to show the future dividends as follows:
Recall that a group consists of 10 subjects. We set 10 types of information for the 10 subjects as follows: Each subject is indexed from 1 to 10.2 We give subjecti∈ {1, . . . ,10} the dividend information for her futurei-period. That is, if the subject’s index is 3, she obtains the information of dividends for three subsequent periods. In the next section, we show how the different information levels impact trade and profits.
3. Results
Our experiments were conducted on December 24, 2013, at the University of Tsukuba with a total of 70 subjects (23 subjects from our department offering economics classes, and 47 from other departments), divided into 7 groups of 10 subjects. Our experiments lasted 90 minutes, in addition to 30 minutes spent for instruction using Microsoft powerpoint
1Game 1 gives the same schedule as in Huber et al. (2008). In their schedule, the change of dividends is within±30%. Then, in Game 2, the change is randomly made within±30%.
2These are hypothetical indices, and the subjects do not know them.
4
Table 1. Schedules of dividend and fundamental value (F.V.)
Game 1 Game 2
Periodt Dividenddt F Vt Dividenddt F Vt
1 20 620 19 620
2 19 600 20 601
3 22 581 18 581
4 21 559 20 563
5 19 538 22 543
6 20 519 23 521
7 21 499 20 498
8 20 478 21 478
9 23 458 28 457
10 25 435 21 429
11 28 410 23 408
12 27 382 25 385
13 25 355 20 360
14 26 330 20 340
15 25 304 21 320
16 22 279 23 299
17 18 257 19 276
18 17 239 17 257
19 14 222 19 240
20 15 208 18 221
21 13 193 22 203
22 17 180 15 181
23 20 163 18 166
24 22 143 20 148
25 26 121 19 128
26 18 95 18 109
27 17 77 20 91
28 20 60 22 71
29 21 40 23 49
30 19 19 26 26
Ave. 20.7 n/a 20.7 n/a
slides. After the instructions, we set three quizzes3for the comprehension of participants, and we took 60 minutes for two games (40 seconds for trading and 20 seconds for checking
3See Appendix A1.
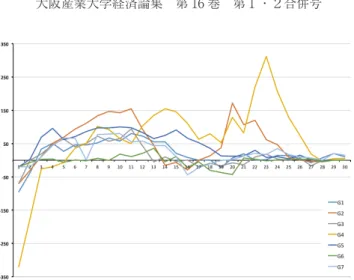
Figure 1. Deviations from fundamental values in Game 1
the results in each period) and 30 minutes for filling in the questionnaire4 and payments.
The subjects’ average earning was 2,753 yen, including 750 yen as participation fee. We used “points” as a money unit in our experiments, and 10 points were exchanged for 1 yen at the payment stage.
3.1. Bubbles under asymmetric information. We first consider the transitions be- tween market prices and fundamental values depicted in Figures 1 and 2. To show the deviation from fundamental valueF Vtat periodt, both the graphs depict the difference between the market pricePtandF Vtacross the seven groups, where the x-axis represents periods and the y-axis the points ofPt−F Vt.
A deviation from fundamental values is often called a bubble5. To compare the degree of bubbles across the groups and games, we use two indicators,RADandRD, introduced
Figure 2. Deviations from fundamental values in Game 2
4See Appendix A2.
5There seems to be no consensus on when bubbles occur and how large a deviation can be.
6
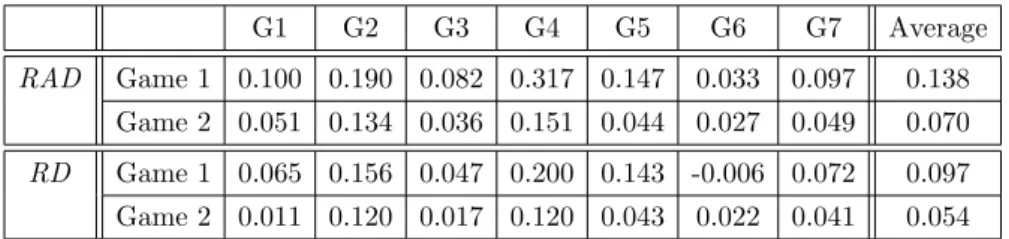
Table 2. RAD and RD in Games 1 and 2
G1 G2 G3 G4 G5 G6 G7 Average
RAD Game 1 0.100 0.190 0.082 0.317 0.147 0.033 0.097 0.138 Game 2 0.051 0.134 0.036 0.151 0.044 0.027 0.049 0.070 RD Game 1 0.065 0.156 0.047 0.200 0.143 -0.006 0.072 0.097 Game 2 0.011 0.120 0.017 0.120 0.043 0.022 0.041 0.054
by Stockl et al. (2010) as follows:
RAD= 1 N
∑N
t=1|Pt−F Vt| F V¯ ; RD= 1
N
∑N
t=1(Pt−F Vt) F V¯ ,
whereN is the number of periods, ptthe market price at periodt,F Vtthe fundamental value at periodt, and ¯F V the average of fundamental values across the periods. RADgives the degree of difference between the fundamental value and market price on average, and RDgives the degree of differencewithout an absolute sign. Thus,RD additionally shows whether their difference is positive or negative. If there are both positive and negative deviations from the fundamental values, the deviations cancel out each other. Thus, it is obvious thatRD is always less than or equal toRAD.
TheRADandRDin Games 1 and 2 are summarized in Table 2. Let us now consider the RADin Game 1. The values are.138 and.070 on average in Games 1 and 2, respectively, meaning that the deviations are 13.8 % and 7.0% per period on average in Games 1 and 2, respectively. Since theRADin Game 1 is larger than that in Game 2, a larger deviation occurs in Game 1. SinceRADis calculated from the absolute value of deviations between the market price and fundamental values, it cannot identify whether a deviation is positive or negative. To examine this, we need to useRD as well.
As the RDs in both games are positive, a deviation from the fundamental values is positive on average. They are 9.7% and 5.4% over the fundamental values on average in Games 1 and 2, respectively. Similarly, theRDin Game 1 is larger than that in Game 2.
This means that totally the deviation is larger in Game 1 than in Game 2.
Furthermore, we calculate the difference between the market price (Pt) and the next fundamental value F Vt+1 at period t, that is, (Pt−F Vt+1), and compare it with the dividend at periodtfor each group as shown in Figures 3 and Fig. 4. In both graphs, the x-axis represents the periods and y-axis the points. These figures show how much the traders earn or lose each period in trading. If the traders are rational, they would bid at a price equivalent to the present fundamental value each period, and would make a profit of the dividend, represented by the black line. Indeed, this is possible because all the traders can observe both the next fundamental value and dividend each period on the computer screen of the last trade even though they may have different information levels.
However, as Figures 3 and 4 show, almost all the market prices do not coincide with the dividend in both games. When (Pt−F Vt+1) is greater than the dividend, sellers earn by the amount of the difference, (Pt−F Vt+1)−dt(=Pt−F Vt). This is because the sellers who sell an asset gain onlydt at the higher price.
3.2. Traders’ returns and Information levels. We next show the subjects’ average returns at each information level. These results for Games 1 and 2 are depicted in Figures 5 and 6, respectively. In these figures, the x-axis represents the information levels of subjects, where 1 indicates the least informed and 10 the most informed. The y-axis represents the payoffs the subjects obtained. Therefore, each dot in these figures shows how many points each subject of an information level obtained. The lines in the figures represent the average payoffs in each information level.
We now examine the results of these two figures. In Figure 5, the subjects who obtain the highest payoff are not on the 10th information level, but on the 7th information level on average. In particular, subjects on the 8th and 9th levels obtain payoffs as high as that of those on the lower information levels. This tendency is also observed in Figure 6.
Indeed, the payoffs on information levels 3, 4, and 5 dominate those on level 6 and above information level. Therefore, we conclude that more information does not necessarily give the traders more payoffs. This result is the same6as in Huber et al. (2008).
3.3. Understanding games. We showed that better-informed traders do not necessarily outperform the less-informed ones. Indeed, less-informed traders gain more profits in some
Figure 3. Relationship between traders’ profits in Game 1
6In fact, we tried to conduct a statistical test by gathering more data. Unfortunately, the additional experiments we conducted failed and we could not obtain additional data. To overcome this failure, we tried to merge the data of Games 1 and 2. We made the following null hypothesis for a statistical test: the distributions of every information level are same. However, the Friedman test did not reject the hypothesis on the 5% level (p=.087). We therefore gave up merging the data. As a result, we could not conduct more statistical tests.
8
Figure 4. Relationship between traders’ profits in Game 2
cases. What kind of subjects earns more profits in our experiments? We examine this question from the viewpoint of the understanding level of subjects. To classify their understanding level, we asked them to fill in the questionnaire shown in Appendix A2 after completing each game; we obtained 70 valid responses.
For example, in Q8, we asked the subjects how they understood the way to trade from this experiment. The alternative answers are as follows: (1) not at all, (2) a little bit, (3) neither, (4) almost all, (5) completely. The answers are summarized in Table 3. We consider their answers as their level of understanding the trading rules and classify the alternatives by the corresponding numbers from 1 to 5, where 1 is the least and 5 the most.
In another questionnaire on free-writing style, the subjects are asked how they bid in trading. Those with an understanding level of 1 or 2 seemed to trade with less un- derstanding, because their answers were like “groping in the dark.” Those with good
Figure 5. Subjects’ payoffs based on information levels in Game 1
Figure 6. Subjects’ payoffs based on information levels in Game 2 Table 3. Understanding of subjects in Games 1 and 2 Understanding levels 1 2 3 4 5 Total Average
Numbers in Game 1 7 35 13 11 4 70 2.57
Distribution 10% 50% 19% 16% 6% 100%
Numbers in Game 2 4 28 13 21 4 70 2.9
Distribution 6% 40% 19% 30% 6% 100%
understanding, that is, those with an understanding level of 4 or 5, seemed to trade by in- ferring the (hidden) fundamental values. Thus, they could avoid the mismatch of demand and supply, and tried to buy more stocks.
Next, we examine whether subjects’ understanding levels are related to their profits.
The relationship is depicted in Figures 7 and 8. In the figures, the x-axis represents the understanding levels from 1 to 5, and the y-axis the payoff points. Each dot represents
Figure 7. Relationship between payoffs and understanding levels in Game 1
10
Figure 8. Relationship between payoffs and understanding levels in Game 2
a subject’s profit with the corresponding understanding level. The red line shows the average profit for each understanding level. These graphs show that the average profit rises in Game 1 when the understanding level rises; however, in Game 2, the understanding level does not affect their profits. This could be because the subjects understood the rules of our experiments and the variance between the understanding levels became smaller.
Thus, those with better understanding levels did not have an advantage.
4. Conclusion and future research
In this study, we examined how subjects with more information can expect larger returns in financial markets. We conducted experimental asset markets in this study following Huber et al. (2008). Huber et al. (2008) found that subjects gain more returns only if they are well informed. On the other hand, indecisive information does not contribute to returns, but rather makes them worse off.
Following Huber et al. (2008), we conducted call market experiments with two types of Markov dividend processes and compared the results. One dividend schedule is the same as in Huber et al. (2008), and the other is the same as in our experiment. In both schedules, more information did not increase subjects’ returns.
Then, we examined subjects’ understanding levels in our experiments. Indeed, some studies such as Huber and Kirchler (2012) and Kirchler et al. (2012) show that subjects’
understanding levels play a central role in such experiments. However, we found only one game (Game 1) in our experiment showed that better understanding could lead to more payoffs.
In these experiments, we could not conduct a statistical test because we failed to gather enough data. We need to have more statistical experiments to examine how several fac- tors relate to each other. In particular, we need to investigate the effects of asymmetric
information. In fact, the 2008 global financial crisis was caused by asymmetric informa- tion. As mentioned in the information economics literature, such information structures could lead to market failure and economic agents may have incentives of moral hazard.
In comparison with theoretical studies, there are very few experimental investigations. In future studies, we intend to conduct more experiments with asymmetric information to arrive at clearer conclusions.
References
[1] Ackert, L., B. Church and P. Zhang (2002) “Market behaviour in the presence of divergent and imperfect private information: Experimental evidence from Canada, China and the United States,”
Journal of Economic Behavior and OrganizationVol. 47: pp. 435–450.
[2] Copeland, T. and D. Friedman (1992) “The market value of information: Experimental results,”
Journal of Business, Vol. 65: pp. 241–265.
[3] Dupont, D. Y. and G. S. Lee (2002) “The endowment effect, status quo bias and loss aversion:
Rational alternative explanation,”Journal of Risk Uncertainty, Vol. 25: pp. 87–101.
[4] Fischbacher, U. (2007) “z-Tree: Zurich toolbox for ready-made economic experiments,”Experimental Economics, Vol. 10 (2): pp. 171–178.
[5] Grossman. S. J. (1976) “On the efficiency of competitive stock markers where traders have diverse information,”Journal of Finance, Vol. 31: pp. 575–585.
[6] Huber, J., and M. Kirchler (2012) “The impact of instructions and procedure on reducing confusion and bubbles in experimental asset markets,”Experimental Economics, Vol. 15: pp. 89–105.
[7] Huber, J., M. Kirchler, and M. Sutter (2008) “Is more information always better? Experimental financial markets with cumulative information,”Journal of Economic Behavior & Organization, Vol.
65: pp. 86–104.
[8] Kahneman, D. and A. Tversky (1979) “Prospect Theory: An Analysis of Decision under Risk,”
Econometrica, Vol. 47: pp. 263–291.
[9] Kirchler, M., J. Huber, and T. St¨ockl (2012) “Thar she bursts: Reducing confusion reduces bubbles,”
American Economic Review, 102(2): pp. 865–883.
[10] Schredelseker, K. (1984) “Anlagestrategie und Informationsnutzen am Aktienmarkt.”Schmalenbachs Zeitschrift fur Betriebswirtschaftliche Forschung, Vol. 36: pp. 44–59.
[11] Schredelseker, K. (2000) “Is the usefulness approach useful? Some reflections on the utility of public information,” In S. McLeay and A. Riccaboni (Eds.)Contemporary Issues in Accounting Regulation, pp. 135–153.
[12] Sciubba, E. (2005) “Asymmetric information and survival in financial markets,”Economic Theory, Vol. 25: pp. 353–379.
[13] Stockl, T., J. Huber, and M. Kirchler (2010) “Bubble measures in experimental asset mar- kets,”Experimental Economics, Vol. 13: pp. 284–298.
[14] Smith, V. L., G. L. Suchanek, and A. W. Williams (1988) “Bubbles, crashes, and endogenous expec- tations in experimental spot asset markets,”Econometrica, Vol. 56: pp. 1119–1151.
Appendices
A1: Comprehensive quizzes. We asked the subjects to answer these three quizzes for estimating their comprehension of the rules. We neither checked their answers before the experiment, nor revealed the rewards for the experiments.
Quizzes:
12
(1) When the subjects bet the following prices, calculate the market price: 0-20-30- 40-40-50-50-60-70-70.
(2) When the market price is 45, which is the role of the following subjects: buyer, seller, or neutral?
a: The subject who bid at 0;
b: the subject who bid at 45;
c: the subject who bid at 70.
(3) When the market price is 45 and the fundamental value is 30, what is the payoffs of the following subjects, buyer, seller, and neutral?
a: The subject who bid at 0;
b: the subject who bid at 45;
c: the subject who bid at 70.
A2: Questionnaire. We prepare a common questionnaire for games 1 and 2. In the Questionnaire session, the subjects were asked the following questions:
Q1: How many information did you get among 10 levels?
Q2: How long did you check the information on dividends?
[never, sometimes, half the time, often, always]
Q3: Did you believe the fundamental values?
[not at all, a little bit, middle, almost entirely, always]
Q4: What is your rank of earning in your group?
[Worst, second worst, exactly in the middle, second best, best]
Q5: Imagine other subjects who have the same information level. Then, is your earning higher than, lower than, or identical to theirs?
Q6: How was the market?
[low price, average, high price]
Q7: How did you order?
[try to buy, neither, try to sell]
Q8: Did you understand the way to trade in this experiment?
[not at all, a little bit, half, almost completely, completely]