56
Copyright@SPSD Press from 2010, SPSD Press, Kanazawa
Key Factors for Renewable Energy Promotion and Its Sustainability Values in Rural Areas: Findings from Japanese and Chinese Case Studies
Qianna Wang1*, Lin Peng2, Martin Mwirigi M’ikiugu3, Isami Kinoshita3, and Zhicong Zhao2
1 College of Architecture and Environment, Sichuan University 2 School of Architecture, Tsinghua University
3 Graduate School of Horticulture, Chiba University
* Corresponding Author, Email:[email protected] Received 12 December, 2013; Accepted 14 August, 2014
Key words: Renewable Energy, Key Factors, Sustainability Values, Rural Development.
Abstract: The use of Renewable Energy (RE) is becoming popular for its clean and safe characteristics. The development of RE is also one of the crucial steps for the future sustainable development of energy resources. Nowadays, rural areas are facing issues such as depopulation and economic decline. How to find solutions to these issues while aiming to achieve sustainable development is a challenging task. Rural areas with RE in Japan and China have been established recently, and there are a few practical cases worth referencing. To identify key factors for RE promotion and its sustainability values in rural areas, this study presents two pioneer cases: Kuzumakicho in Japan and Chongming Island in China. Each of them stands for strong RE advancement in their home country and bears specific characteristics. Instead of a comparative study, this study examines the two cases as parallel case studies using a review of the literature, local plans, policy documents, and a questionnaire sheet with a SWOT analysis approach integrated in the methods.
Key factors included municipal planning concepts and subsidies from national or regional governments among others, while contributions to sustainability include environmental education, local tourism, disaster prevention/mitigation, and waste re-use among others. In conclusion, the lessons learned and recommendations for future RE promotion in Japanese and Chinese rural areas are given.
1. INTRODUCTION
In June 2010, the Japanese Government announced their new “Basic Energy Plan” (Japanese Ministry of Economy, Trade and Industry, 2010).
As one of the five main targets, they planned to increase the proportion of Zero Emission Electricity Power (nuclear power and Renewable Energy) to 70% of their total electricity generation by 2030. To achieve this target, they planned to increase Renewable Energy from 8% to 19%, and nuclear power from 26% to 50%. However, after The Great North Eastern Japan earthquake on March 11, 2011 and the consequent Fukushima nuclear crisis, the “Zero Nuclear” movements arose in many countries across the world, especially in Germany and Japan. In this context the Japanese Government is making efforts to change the energy structure. As an alternative energy resource,
Renewable Energy (RE) goes into their focus with its clean and safe characteristics. RE is energy generated from solar, wind, biomass, geothermal, hydropower, ocean resources, and biofuels (IEA, 2011). The Feed-in Tariff (FIT) of RE was announced and started in Japan in July 2012 and was expected to accelerate RE development in Japan. At present, the Japanese government is making efforts to spread the use and infrastructure of RE. In the meantime, China doubled its wind power capacity in 2009, and it still maintained its position as a global wind power leader in cumulative terms with a total of 75.32 GW (Global Wind Energy Council, 2013). China has also become the largest hydropower and wind power producer, as well as having the highest solar water heating capacity in the world (REN21, 2013).
In order to promote RE, there are several studies discussing the key or driving factors leading to the successful promotion of RE (Izutsu, Takano, et al., 2012). After RE has been promoted in an area, its supply and use plays a key role in the local sustainable strategy, and it represents a crucial part of the overall strategy for sustainable development in local areas (European Renewable Energy Council, 2012). The existing literature mentions that RE can contribute to local sustainable development by providing various environmental and socio-economic benefits. These benefits include CO2
reduction, employment creation and enhancement of local development opportunities, among others. However, much emphasis is put on the environmental benefits, while socio-economic benefits have received less attention. Worldwide, several studies have analysed RE’s environmental sustainability benefits. Gosens, Lu, et al. (2013), Reddy, Uitto, et al. (2006), Yang, Chen, et al. (2013), among other authors, emphasise RE’s contribution to environmental aspects (Dincer, 2000). In contrast, socio-economic benefits are usually mentioned but their analysis has been general and mostly focuses on national and regional levels, while those at the local levels have been lacking (Rio and Burguillo, 2008). There is a lack of empirical evidence on RE’s socio-economic contribution, especially to the rural areas that are experiencing depopulation and economic decline.
Therefore, the focus in this paper is on rural areas, taking into consideration two aspects of RE: key factors for RE promotion, and RE’s contribution to sustainability. This study presents two cases: Kuzumakicho in Japan and Chongming Island in China. A review approach and a questionnaire sheet with an integrated SWOT (Strengths-Weakness- Opportunity-Threats) analysis approach were used with the following aims:
1) to identify key factors for RE promotion, and 2) to clarify RE’s contribution to sustainability in rural areas. We understand that our cases only reflect a limited part of RE and its implementation status in Japanese and Chinese rural areas, but we are hoping to provide lessons learned through these cases. This can contribute to future RE promotion and sustainable development in Japanese and Chinese rural areas.
2. STUDY AREAS
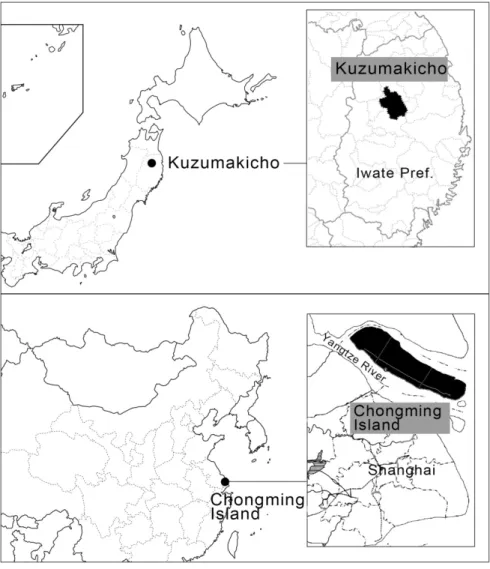
Because the backgrounds and basic conditions of the two cases are different, this study examines the two cases as parallel case studies instead of as a comparative study. Kuzumakicho in Japan and Chongming Island in China were selected as case study sites (See Figure 1 for their locations).They were selected because they were some of the most progressive RE development cases in their respective home country’s rural areas. Kuzumakicho started to promote RE from 1998, which is earlier than
other Japanese municipalities. They continued installation of multiple RE facilities such as wind farms, solar panels, and biomass plants in the ten years that followed. Kuzumakicho was selected as one of the “New Energy 100 Selections” by The Ministry of Economy, Trade and Industry, and The New Energy and Industrial Technology Development Organization (NEDO) (2009), for its standing for, and excellent efforts in local RE promotion.
Chongming Island was selected because it is located in the most economically developed region in China, the suburban Shanghai, within The Yangtze River Delta Economic Zone. It is the first Modern Ecological Island in China. In addition, Chongming Island was designated as one of the first
“National Green Energy Model Counties”, for its advanced pioneer role in rural RE development (National Renewable Energy Center, 2011). Both of the cases bear specific characteristics or issues, such as: population loss and local business decline in Kuzumakicho, and rapideconomic and energy consumption increase in Chongming Island.
Figure 1. Location of case study areas
Kuzumakicho is located in Iwate Prefecture in the Tohoku region of Japan, which was one of the three prefectures that were greatly damaged by the Great North Eastern Japan Earthquake of March 11th, 2011. The town covers an area of 435km2, with a population of 7,678 in 2,890 households (Kuzumakicho Gov., 2013a). It has an average annual inland wind speed of 8m/s at the height of 70m (NEDO, 2010), and a hilly topography that has
86% forest cover. This town suffered from population loss and local business decline during the 1980s. It is designated as a “Depopulated Area”
by the Japanese Ministry of Internal Affairs and Communication. Local industries include agriculture, dairy farming, and forestry. Its local RE development came from efforts started in 1998, and Kuzumakicho now has a total electricity generation of 56,910MWh from RE facilities (wind 56,000MWh, biogas 50MWh, biomass 500MWh, and solar 360MWh). Its electricity consumption in 2011 was 36,725MWh (Kuzumakicho Gov., 2013b), indicating that RE provides 155.0% of Kuzumakicho’s electricity consumption. However, the fact that all the electricity generated from the wind farms has been sold to Tohoku Electric Power Co., Inc. (Kuzumakicho Gov., 2012a), and not used by the local community, cannot be ignored. See Table 1 for current RE facilities in Kuzumakicho.
Table 1. Current RE facilities in Kuzumakicho (Kuzumakicho Gov., 2012a)
Year RE facility Capacity
1998 Eco wind farm 1200kW*3
1999 Solar panels 50kW
2003 Biogas plant Electricity: 37kW; Heat: 43,000kcal
Pellet boiler 500,000kcal*2
Solar panels 20kW
Green power wind farm 1750kW*12
2005 Biomass plant (cogeneration) Electricity: 120kW; Heat: 230,000kcal
2008 Pellet boiler 50kW*2
2011 Solar panels 20kW
Chongming Island is located at the entrance of Yangtze River to the Pacific Ocean, about 25km from downtown Shanghai. It is the third largest island in China and covers an area of 1276km2, with a population of 691,699 (2008). The island has an abundant wind resource; its average inland wind speed reaches 7m/s at the height of 50m (Yu, Zhou, et al., 2008). It also has wetlands, agricultural fields, and it is famous as a weekend tourist site for Shanghai City. Chongming Island now has a total electricity production of 432.5GWh from RE facilities (wind 430GWh, biogas 1.5GWh, and mega- solar 1.05GWh), while its electricity consumption in 2012 was 3,980GWh (Yu, Roddy, et al., 2009). RE is now providing only 10.9% of the island’s electricity consumption. See Table 2 for current RE facilities in Chongming Island.
Table 2. Current RE facilities in Chongming Island
Year RE facility Capacity
2010 Mega-solar 1MW
2011 Biogas plant (Cogeneration) 380kW
2012 Wind farm 19.5MW(total)
Various Solar thermal 140MW
(Total installation area 200,000m2)
3. METHODOLOGY
Regarding the case study methodology, in order to make the cases as reflective as possible from various viewpoints, information from various data resources was included. Two approaches were followed: the review approach and the questionnaire approach. Reviewed materials include
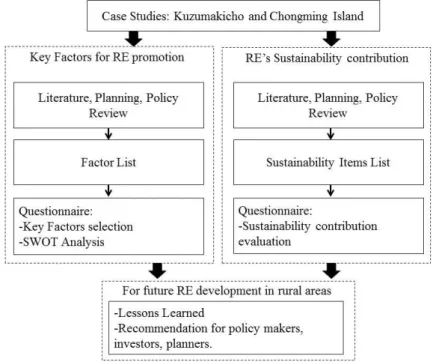
existing literature as well as local planning and policy documents, and reports. The questionnaire was designed with the SWOT analysis approach integrated in it, see Figure 2.
Figure 2. Methodology framework for this study
All the data reviewed is listed in Table 3 and Table 4, found below. The review approach was to identify keywords or statements of key factors for RE promotion and RE’s contribution to sustainability.
A survey was conducted through a questionnaire among The Energy Department officers in Kuzumakicho and their counterparts in Chongming Island. The above departments were selected for their involvement in policy, planning, and management in local areas directly related to RE development, hence they have the background to identify the key factors for RE promotion, and to evaluate RE’s contribution to sustainability in local areas.
Taking into account the total number of staff members in the energy departments, five questionnaires were hand delivered by the authors to Chongming Island’s Energy Department on June 25, 2013, and a similar number was sent to Kuzumakicho’s Energy Department on June 24, 2013 by mail. Each questionnaire package included an explanation letter, a questionnaire, and a mail-back envelope with a postage stamp. The explanation letter included a description of the study objectives and explanation of RE and sustainable development, to ensure uniformity on the basic understanding of study aims and questionnaire contents. The questionnaire was composed of three parts.
1) RE promotion factor list and SWOT analysis checklist of the key factors. The key factors for RE promotion listed in the questionnaire were adopted from past research, as well as a local planning and policy document review. The factors were arranged and coded in consecutive numbers. They were subsequently divided into five broad classifications of environmental, administrative, social, economic, and any other factors.
2) Evaluation of RE’s contribution to the sustainability of local areas, where five score contribution levels were used, including “+2 very good, +1 good, 0 neither, -1 bad, and -2 very bad”. Because there are three types of
RE facilities in Kuzumakicho and Chongming Island, namely wind, PV/solar thermal and biomass/biogas, evaluations were only conducted of these three.
The RE contributions to sustainability listed in the questionnaire were also adopted from past research, as well as a local planning and policy document review. The factors were arranged and coded in consecutive numbers, and subsequently divided into five broad classifications of environmental, administrative, social, economic, and any other factors.
3) Two detailed questions: ranking of the top three factors from selected key factors in part 1, including the reasoning, and also ranking the top three RE contributions to sustainability, and including the reasoning.
All the responses had been received by July 5, 2013, after which their validity was checked and they were subsequently analyzed.
Table 3. Data list for Kuzumakicho case Category Year Material
Planning and Policy 1995 Natural Environmental Conservation Regulation 1999 New Energy Vision
2002 Eco-Energy Comprehensive Project Subsidy 2003 Energy Saving Vision
2007 Biomass Town Plan
2012b Global Warming Prevention Action Plan (4th) Reports 2011 Practical Use of Local Energy Report
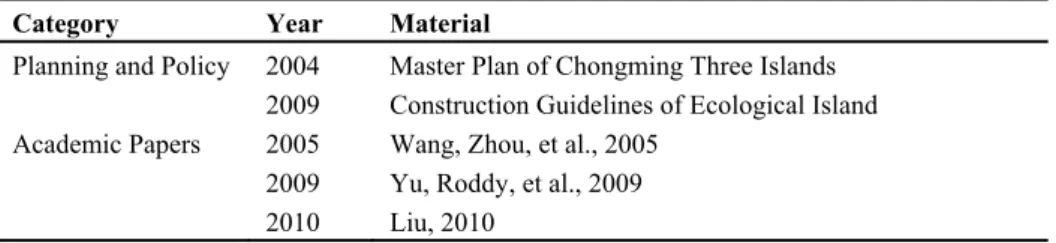
2012a The Efforts to Clean Energy in Kuzumakicho Table 4. Data list of Chongming case.
Category Year Material
Planning and Policy 2004 Master Plan of Chongming Three Islands 2009 Construction Guidelines of Ecological Island Academic Papers 2005 Wang, Zhou, et al., 2005
2009 Yu, Roddy, et al., 2009 2010 Liu, 2010
4. RESULTS AND ANALYSIS
4.1 Identification of RE promotion factors and sustainability elements
Through literature review and review of local planning and policy documents, factors for RE promotion were identified and they were divided into four broad classifications: 1) environmental, 2) administrative, 3) social, and 4) economic factors, see Table 5. Likewise, we identified the sustainability elements and divided them into three broad classifications: 1) environmental, 2) social, and 3) economic factors, see Table 6.
Table 5. Factors for RE promotion in literature, and local planning and policy documents Factors List Literature/ Local planning and policy
documents Environmental
1. Abundant RE resources Wang, Zhou, et al., 2005; Chongming Gov., 2009;
Kuzumakicho Gov., 2007, 2012a; Yu, Roddy, et al., 2009; Liu, 2010.
2. Location Chongming Gov., 2004, 2009; Wang, Zhou, et al.,
2005; Liu, 2010.
3. Topography Kuzumakicho Gov., 1995.
4. Climate Chongming Gov., 2009; Kuzumakicho Gov., 2011, 2012b.
Administrative
5. Municipal planning concept Kuzumakicho Gov., 1995,1999, 2012a; Chongming Gov., 2004, 2009; NEDO, 2008; Yu, Roddy, et al., 200;
6. Positive initiative by the mayor Chongming Gov., 2009.
7. Key person(s) NEDO, 2008.
8. Cooperation between departments and divisions
Kuzumakicho Gov., 2007, 2012b; NEDO, 2008;
Chongming Gov., 2009.
9. Position in municipal planning NEDO, 2008.
10.High feasibility energy strategy Chongming Gov., 2009; Kuzumakicho Gov., 2012b.
11.New energy vision/plan Kuzumakicho Gov., 1999, 2012a.
12.Effective implementation and planning promotion
Chongming Gov., 2004, 2009; Kuzumakicho Gov., 2012b.
Social
13.Understanding and support from external companies
Kuzumakicho Gov., 2003, 2011, 2012a, 2012b;
NEDO, 2008; Chongming Gov., 2009; Yu, Roddy, et al., 2009.
14.Understanding and support from local citizens
Kuzumakicho Gov., 2003, 2011, 2012a; NEDO, 2008; Chongming Gov., 2009.
15. University/experts’ support Wang, Zhou, et al., 2005; Chongming Gov., 2009;
Yu, Roddy, et al., 2009.
16. RE provider support NEDO, 2008.
17. Ensure human resources Chongming Gov., 2009.
18. Know local RE potential Chongming Gov., 2004; Yu, Roddy, et al., 2009;
Kuzumakicho Gov., 2011, 2012a.
19. Know local RE potential sites Yu, Roddy, et al., 2009; Kuzumakicho Gov., 2011.
20.Know scale/capacity of RE project(s)
Chongming Gov., 2004; Yu, Roddy, et al., 2009.
Economic
21. Sufficient budget Kuzumakicho Gov., 2003; Chongming Gov., 2009.
22. Subsidy from national or regional/prefectural governments
Kuzumakicho Gov., 2002, 2003, 2012b; NEDO, 2008.
23. Electricity sale through FIT Kuzumakicho Gov., 2011.
24. Ensure economic cost-benefits NEDO, 2008; Kuzumakicho Gov., 2011.
25.Management/maintenance cost control
NEDO, 2008; Kuzumakicho Gov., 2011.
26. Cooperation with local businesses
Kuzumakicho Gov., 2007.
Table 6. Sustainability elements in literature, and local planning and policy documents Sustainability Elements Literature/ Local planning and policy
documents Environmental
1. Global warming mitigation Kuzumakicho Gov., 2003, 2011, 2012b; Yale University, 2005; Chongming Gov., 2009; Liu, 2010.
2. Safe to the natural environment Yale University, 2005; Kuzumakicho Gov., 2012a, 2012b.
3. Air quality Kuzumakicho Gov., 2003; Yale University, 2005;
Chongming Gov., 2009.
4. Water quality Kuzumakicho Gov., 2003, 2007, 2012a;
Chongming Gov., 2004, 2009; Wang, Zhou, et al., 2005; Yale University, 2005.
5. Biodiversity Kuzumakicho Gov., 1995; Chongming Gov., 2004;
Yale University, 2005; Chongming Gov., 2009.
6. Landscape conservation Kuzumakicho Gov., 1995, 2012a; Chongming Gov., 2009; Liu, 2010.
7. Noise Chongming Gov., 2009.
8. Waste re-use Chongming Gov., 2004, 2009; Wang, Zhou, et al., 2005; Kuzumakicho Gov., 2007, 2011, 2012b; Yu, Roddy, et al., 2009.
Social
9. Connection with agriculture and forestry
Kuzumakicho Gov., 2003, 2007, 2011, 2012a, 2012b; Chongming Gov., 2004, 2009; Wang, Zhou, et al., 2005; Yu, Roddy, et al., 2009.
10. Local tertiary sector Kuzumakicho Gov., 2003, 2007; Chongming Gov., 2004, 2009.
11. Forest management Kuzumakicho Gov., 2007, 2012a.
12. Facility maintenance Kuzumakicho Gov., 2007; Kuzumakicho on-site interview, June 29, 2012.
13. Local infrastructure/public facility maintenance/upgrade
Chongming Gov., 2004, 2009; Kuzumakicho Gov., 2012a, 2012b.
14. Land use Chongming Gov., 2004; Wang, Zhou, et al., 2005.
15. Transportation Kuzumakicho Gov., 2003, 2012b; Chongming Gov., 2004, 2009; Liu, 2010.
16. Energy local production-local consumption
Kuzumakicho Gov., 1999, 2003, 2007, 2011;
Chongming Gov., 2004; Wang, Zhou, et al., 2005.
17. Energy autonomy Kuzumakicho Gov., 2012a.
18. Disaster prevention/mitigation Chongming Gov., 2004; Wang, Zhou, et al., 2005;
Kuzumakicho Gov., 2011, 2012a, 2012b.
19. Job creation Rio and Burguillo, 2008; Kuzumakicho Gov., 2012a.
20. Citizens’ health improvement Kuzumakicho Gov., 1995, 2011, 2012a.
21. Citizens’ participation Kuzumakicho Gov., 2003, 2011, 2012a;
Chongming Gov., 2009.
22. Environmental education Kuzumakicho Gov., 2003, 2011, 2012a, 2012b;
Chongming Gov., 2004, 2009.
Economic
23. Facility investment Kuzumakicho Gov., 2011.
24. Maintenance cost Kuzumakicho Gov., 2011.
25. Local businesses Chongming Gov., 2004, 2009; Kuzumakicho Gov., 2011, 2012a.
26. Revitalize local companies Chongming Gov., 2004.
27. Local tourism Chongming Gov., 2004; Wang, Zhou, et al., 2005;
Yu, Roddy, et al., 2009; Liu, 2010; Kuzumakicho Gov., 2012a.
28. Electricity sale Kuzumakicho Gov., 2012a.
29. Increase local citizens’ income Kuzumakicho Gov., 2011, 2012a.
4.2 Key factors’ evaluation based on the questionnaire survey
From the 10 questionnaire sheets we distributed, a total of four valid responses were received, two of them from Kuzumakicho energy department, and two from Chongming Island energy department.
4.2.1 Kuzumakicho, Japan
For Kuzumakicho, both respondents identified the following key factors for local RE promotion: abundant RE resources, municipal planning concept, positive initiative by the mayor, new energy plan/vision, understanding and support from external companies, RE provider support, subsidy from national or prefectural governments, and cooperation with local businesses.
Also, one respondent indicated other key factors such as: position in municipal planning, effective implementation and promotion of planning, as well as ‘knowing local RE potential’ among others, as shown in Table 7.
Among all the key factors, ‘Municipal planning concept’ was ranked as the most important factor for local RE promotion by both respondents. For the second and third most important factors, one respondent indicated
‘Abundant RE resources’ and ‘start RE promotion earlier than other municipalities’ respectively. The other respondent indicated ‘New energy plan/vision’ and ‘Abundant RE resources’ as the second and third most important RE promotion factors respectively.
SWOT analysis results were as follows. In the environmental category,
‘Strength’ 12.5%, ‘Weakness’ 0%, ‘Opportunity’ 25%, and ‘Threat’ 62.5%.
In the administrative category, ‘Strength’ 81.25%, ‘Weakness’ 0%,
‘Opportunity’ 18.75%, and ‘Threat’ 0%. In the social category, ‘Strength’
12.5%, ‘Weakness’ 6.25%, ‘Opportunity’ 81.25%, and ‘Threat’ 0%. In the economic category, ‘Strength’ 33.3%, ‘Weakness’ 50%, ‘Opportunity’
16.7%, and ‘Threat’ 0%. Regarding all the categories, the proportions were as follows: ‘Strength’ 37.7%, ‘Weakness’ 13.2%, ‘Opportunity’ 39.6%, and
‘Threat’ 9.5%. All the key factors identified by respondents were identified with ‘strength’ and ‘opportunity’.
Table 7. Questionnaire results on the key factors for RE promotion, Kuzumakicho
Factor List Key factors S W O T
Environmental
1. Abundant RE resources
2. Location
3. Topography
4. Climate
Administrative
5. Municipal planning concepts
6. Positive initiative by the mayor
7. Key person(s)
8. Cooperation between departments and divisions
9. Position in municipal planning
10.High feasibility energy strategy
11.New energy vision/plan
12.Effective implementation and
promotion of planning Social
13.Understanding and support from external companies
14.Understanding and support from local citizens
15. University/experts’ support
16. RE provider support
17. Ensure human resource
18. Know local RE potential
19. Know local RE potential sites
20. Know scale/capacity of RE project
Economic
21. Enough budget
22. Subsidy from national or regional/prefectural governments
23. Electricity sale through FIT
24. Ensure economic cost-benefits
25. Management/maintenance cost control
26. Cooperation with local businesses Others from respondents
27. Start RE promotion earlier than other municipalities
One response. Two responses.
According to the SWOT analysis results in Table 7, most of the environmental factors (62.5%) were identified as ‘threat’. This could be due to 1) its remote location with no railway or Shinkansen (bullet train) through the town, 2) far away from prefectural capital city Morioka (90 min by bus), and/or 3) extreme cold temperatures in winter (minimum -16°C). As revealed in the key factors’ selection, because of the positive attitude by the municipal government, early start of local RE development, and formulation of local planning policies, 81.25% of administrative factors were identified as ‘strengths’. During local RE development process, there is a lot of external technical support. There is biomass plant technology support from NEDO, biogas technology support from T. Machinery Company in Tokyo, and financial support from The Ministry of Environment, Iwate prefecture, and NEDO among others. Thus, social factors were identified as
‘opportunities’. Due to the local budget limitations and high RE facility maintenance cost, 50% of the economic factors were identified as
‘weaknesses’.
4.2.2 Chongming Island, China
For Chongming Island, both respondents identified several factors as key factors for local RE promotion. They are: abundant RE resources, understanding, and support from external companies. One of the respondents indicated key factors such as: municipal planning concept, cooperation between departments and divisions, new energy plan/vision, and sufficient budget among others, see Table 8.
Table 8. Questionnaire results on key factors for RE promotion, Chongming Island
Factor List Key factors S W O T
Environmental
1. Abundant RE resources
2. Location
3. Topography
4. Climate
Administrative
5. Municipal positive concept
6. Positive initiative by the mayor
7. Key person(s)
8. Cooperation between departments and divisions
9. Position in municipal planning
10.High feasibility energy strategy
11.New energy vision/plan
12.Effective implementation and planning promotion
Social
13.Understanding and support from external companies
14.Understanding and support from local citizens
15. University/experts’ support
16. RE provider support
17. Ensure human resources
18. Know local RE potential
19. Know local RE potential sites
20.Know scale/capacity of RE project
Economic
21. Sufficient budget
22. Subsidy from national or regional/prefecture government
23. Electricity sale through FIT
24. Ensure economic cost-benefits
25. Management/maintenance cost control
26. Cooperation with local businesses
Others from respondents None
One response. Two responses.
One respondent ranked the most important top three key factors as follows: ‘abundant RE resources’, ‘municipal planning concept’, and
‘subsidy from national or regional/prefectural governments’. Another ranked them as follows: ‘high feasibility energy strategy’, ‘sufficient budget’, and
‘abundant RE resources’. Although the ranking was different, the most important three key factors they pointed out were the same: abundant RE resources, positive RE concept and strategy, and financial support.
SWOT analysis results were as follows. In the environmental category,
‘Strength’ 100%, ‘Weakness’ 0%, ‘Opportunity’ 0%, and ‘Threat’ 0%. In the administrative category, ‘Strength’ 75%, ‘Weakness’ 0%, ‘Opportunity’
25%, ‘Threat’ had 0%. In the social category, ‘Strength’ 37.5%, ‘Weakness’
25%, ‘Opportunity’ 25%, while ‘Threat’ was 12.5%. In the economic category, ‘Strength’ 41.7%, ‘Weakness’ 8.3%, ‘Opportunity’ 41.7%, and
‘Threat’ 8.3%. Regarding all the categories, the proportions were as follows:
‘Strength’ 59.6%, ‘Weakness’ 9.6%, ‘Opportunity’ 25%, and ‘Threat’ 5.8%.
Apart from ‘know scale/capacity of RE’ and ‘sufficient budget’ that were identified in ‘Weakness’ by one respondent, the remaining key factors were categorized in ‘strength’ and ‘opportunity’.
In Table 8, in regard to environmental factors, ‘strength’ is particularly prominent (100%). Indeed, unlike the remote location and cold winter in Kuzumakicho, Chongming Island’s location (25km from Shanghai) and climate (annual temperature range 4°C~30°C) are viewed as favourable.
75% of administrative factors were identified as ‘strengths’, while social factors got close proportions among ‘strength’ 37.5%, ‘weakness’ 25%, and
‘opportunity’ 25%. This could be due to the local government’s efforts in RE development goals as outlined in its upper level master plans, such as The Master Plan of Chongming Islands (2005~2020). However, there is still a lack of support from universities/experts and RE providers. If these factors improve, they can turn into ‘opportunities’ in the future. ‘Strength’ and
‘opportunity’ had 41.7% for economic factors in Chongming Island, a high percentage that could be attributed to the rapid pace of economic and RE development in China.
4.3 Sustainability elements’ evaluation based on the questionnaire survey
4.3.1 Kuzumakicho, Japan
For Kuzumakicho’s RE contribution to sustainability, perception of these contributions is different among respondents. One respondent indicated that wind energy has a ‘+1 good’ contribution to sustainability, and is ‘safe to the natural environmental’. In contrast, another respondent indicated it as having
‘-1 bad’ contribution. As shown on Table 11, wind energy’s positive contributions were evaluated as ‘+2 very good’ by both respondents, including for ‘environmental education’ and ‘local tourism’. PV/solar included ‘safe to the natural environment’, ‘local infrastructure/public maintenance/upgrade’, and ‘environmental education’. Biomass/biogas included ‘waste re-use’, ‘connection with agriculture and forestry’, ‘energy local production-local consumption’, ‘energy autonomy’, and
‘environmental education’. Elements that had negative evaluations, such as
‘noise’, ‘land use’, ‘energy local production-local consumption’, and ‘citizen participation’ were identified for wind energy facilities. ‘Landscape conservation’, ‘job creation’, and ‘facility investment’ were identified for PV/solar facilities, while ‘air quality’, ‘facility maintenance’, and
‘maintenance cost’ were identified for biomass/biogas facilities, see Table 9.
Among all the sustainability elements, ‘connection with agriculture and forestry’ was ranked as the most important by both respondents. For the second and third important elements, one respondent indicated ‘energy local production-local consumption’ and ‘environmental education’ respectively, while the other respondent indicated ‘energy autonomy’ and ‘local tourism’.
Table 9. Questionnaire results for RE’s contribution to sustainability, Kuzumakicho Sustainability Elements Wind Energy PV/solar Biomass
Biogas Environmental
1. Global warming mitigation +2, +1 +1, +1 +1, 0
2. Safe to the natural environment +1, -1 +2, +2 +2, -1
3. Air quality 0, 0 0, 0 0, -1
4. Water quality 0, 0 0, 0 0, +1
5. Biodiversity 0, -2 +2, 0 +2, -1
6. Landscape conservation +1, +1 0, -1 0, 0
7. Noise -1, -2 0, 0 0, 0
8. Waste re-use 0, 0 0, 0 +2, +2
Social
9. Connection with agriculture and forestry +1, 0 0, 0 +2, +2
10. Local tertiary sector 0, +2 0, 0 +1, +1
11. Forest management 0, 0 0, 0 +1, +2
12. Facility maintenance 0, +1 0, +1 -1, -1
13. Local infrastructure/public facility maintenance/upgrade
0, 0 +2, +2 -1, +1
14. Land use 0, -1 0, 0 0, -1
15. Transportation 0, 0 0, 0 0, +1
16. Energy local production-local consumption
-2, 0 +2, +1 +2, +2
17. Energy autonomy -2, 0 +2, +1 +2, +2
18. Disaster prevention/mitigation -2, 0 +2, +1 +1, +1
19. Job creation 0, +1 -2, 0 0, +2
20. Citizens’ health improvement 0, 0 0, 0 +1, +2
21. Citizens’ participation -1, 0 +1, +1 +1, +1
22. Environmental education +2, +2 +2, +2 +2, +2
Economic
23. Facility investment 0, -1 0, -1 0, +1
24. Maintenance cost 0, +1 0, +1 -2, -1
25. Local business 0, 0 0, 0 0, +1
26. Revitalize local companies +1, 0 +1, +1 +1, +1
27. Local tourism +2, +2 +2, +1 +2, +1
28. Electricity sale 0, +2 0, +1 0, 0
29. Increase local citizen’s income +1, 0 +1, +1 0, +1 Others from respondents
None
According to the sustainability elements’ evaluation results, different RE resources revealed different sustainability characteristics. In Kuzumakicho’s case (see Table 9), the main sustainability contributions of wind energy were
‘environmental education’ and ‘enhanced local tourism’. After an eco-wind farm was built in 1998, tourist numbers doubled from 180,000 (1999) to 370,000 (2000) and reached approximately 550,000 (2009) within 10 years (Nelsis Editorial Office, 2011). A Green Energy course provided by the local energy department for free to elementary schools, short-stay courses and local accommodation and restaurant providers, provided for tourists an increase in the chance for environmental education. As for PV/solar facilities, their ‘safe to the environment’, ‘local infrastructure/public facilities maintenance/upgrade’, and ‘environmental education’ contribution were highlighted by the respondents. After the Great North Eastern Japan Earthquake on March 11th, 2011, Kuzumakicho experienced power cuts three times because of energy shortages (On-site interview June 29, 2012, with the officer in charge of environmental energy in Kuzumakicho’s Energy Department). The local government started to install PV on local community centers’ rooftops, to ensure minimal power supply in the centers for local residents during power cut periods. This may be the reason they indicated ‘local infrastructure/public facility maintenance/upgrade’ to have
high scores. Biomass/biogas was highlighted for the largest number of contributions, ‘waste re-use’, ‘connection with agriculture, forestry’, ‘energy local production-local consumption’, ‘energy autonomy’, and
‘environmental education’. This is attributable to raw material supply such as wood pellets, wood chips, and livestock waste giving a close connection between biomass/biogas with local agriculture, forestry, and waste re-use.
This can also be considered an advantage, as well as a characteristic of biomass/biogas development in rural areas.
4.3.2 Chongming Island, China
For Chongming Island, respondents indicated several elements as positive with ‘+2 very good’ and ‘+1 good’ scores. They include ‘global warming mitigation’, ‘energy local production-local consumption’, and
‘local tourism’ among others. The only PV/Solar sustainability elements evaluated as ‘+2 very good’ by both respondents was ‘biodiversity’. Like wind energy, several elements were evaluated as positive with ‘+2 very good’ and ‘+1 good’ scores. They include ‘safe to the natural environment’,
‘facility maintenance’, ‘energy autonomy’, and ‘citizens’ participation’
among others. For biomass/biogas, their sustainability elements evaluated as
‘+2 very good’ by both respondents were ‘waste re-use’ as well as
‘connection with agriculture and forestry’. Elements with negative evaluation, such as ‘noise’, ‘biodiversity’ and ‘landscape conservation’, were identified. For wind energy facility, ‘waste re-use’, ‘landscape conservation’ and ‘environmental education’ were identified by one respondent. For PV/solar facility, ‘air quality’, ‘facility maintenance’, ‘land use’, and ‘disaster prevention/mitigation’ were identified for biomass/biogas facility, see Table 10.
One respondent ranked the most important sustainability elements as follows: ‘air quality’, ‘safe to the natural environment’, and ‘waste re-use’.
Another one ranked them as follows: ‘global warming mitigation’, ‘energy autonomy’, and ‘revitalize local companies’.
Table 10. Questionnaire results on RE’s contribution to sustainability, Chongming Island Sustainability Elements Wind Energy PV/solar Biomass
Biogas Environmental
1. Global warming mitigation +2, +1 +2, +1 +1, +1
2. Safe to the natural environment +2, +1 +2, +1 +1, +1
3. Air quality +1, 0 +2, +1 0, -1
4. Water quality +2, 0 +1, 0 +1, +1
5. Biodiversity 0, -1 +2, +2 +1, +1
6. Landscape conservation 0, -1 -1, +1 0, +1
7. Noise -1, -1 0, 0 0, 0
8. Waste re-use 0, 0 -1, 0 +2, +2
Social
9. Connection with agriculture and forestry 0, 0 0, 0 +2, +2
10. Local tertiary sector 0, 0 0, +1 +1, 0
11. Forest management 0, 0 0, 0 +2, 0
12. Facility maintenance +1, +1 +2, +1 -1, +1
13. Local infrastructure/public facility maintenance/upgrade
+1, 0 0, +1 +1, 0
14. Land use 0, -1 +2, 0 +1, -1
15. Transportation -1, 0 0, 0 0, -2 16. Energy local production-local
consumption
+1, +2 +1, +2 0, +2
17. Energy autonomy +1, +2 +1, +2 +1, +2
18. Disaster prevention/mitigation 0, +1 0, +1 0, -1
19. Job creation 0, +1 0, +1 +1, +1
20. Citizens’ health improvement +1, 0 +1, 0 +1, 0
21. Citizens’ participation 0, 0 +1, +2 +1, +2
22. Environmental education 0, +1 -1, +1 0, +1
Economic
23. Facility investment 0, +2 0, +2 +1, +2
24. Maintenance cost 0, +1 0, +1 +1, +1
25. Local business 0, +2 0, +1 0, +1
26. Revitalize local companies 0, +2 +1, +1 0, +1
27. Local tourism +2, +1 0, +1 +1, 0
28. Electricity sale +2, 0 +2, 0 +2, 0
29. Increase local citizen’s income 0, +1 0, +1 +1, +1 Others from respondents
None
Table 10 shows that one of the respondents identified the contribution to the sustainability of wind energy as contributing to ‘global warming mitigation’ and ‘local tourism’ among others. Like wind energy in Kuzumakicho, the wind energy electricity is supplied to the national grid and not used by local people, thus wind energy facilities seem only to be used for tourism purposes in the local area. For PV/solar, their contribution to
‘biodiversity’, ‘safe to the environment’, ‘energy autonomy’, and ‘citizens’
participation’ were highlighted. The Mage-Solar farm (1MW) built in 2010 is supplying electricity to the local area, thus helping on the ‘energy autonomy’ aspect. Similar to biomass/biogas in Kuzumakicho, the two main advantages of biomass/biogas in rural areas, ‘waste re-use’ and ‘connection with local agriculture and forestry’, were highlighted. After calculating the total mean score, we summarized each RE’s total contribution to sustainability by environmental, social and economic categorization in Kuzumakicho and Chongming Island, see Table 11.
Table 11. Different RE resources’ mean score results in Kuzumakicho and Chongming Island
Kuzumakicho Chongming Island
Wind PV/Solar Biomass Biogas
Wind PV/Solar Biomass Biogas
Environmental 0 3.5 3.5 2.5 7.0 6.0
Social 0.5 9.0 14.0 5.5 9.5 8.5
Economic 4.0 4.0 2.5 6.5 5.0 6.0
Total 4.5 16.5 20.0 14.5 21.5 20.5
By comparing the mean score of wind power, PV/solar, and biomass in Table 11, the low contribution score by wind energy to local sustainability could result from the fact that ‘wind energy electricity is not used by the local people’. Although wind energy has the largest share in facility capacity, instead of being used by the local people, big electricity companies supply this electricity through the National grid to other areas. As mentioned above, the close connection between biomass/biogas raw material supply and local agriculture, as well as forestry, led to biomass/biogas having the highest scores. However, it is taxing to balance the cost-benefits for
biomass/biogas in rural areas, such as the initial investment and maintenance cost issues (On-site Interview June 29, 2012, with the officer in charge of environmental energy in Kuzumakicho’s Energy Department). Like biomass/biogas, the economic issues limit further development of PV/solar in Kuzumakicho.
For Chongming Island, the difference between the scores is comparatively smaller than that in Kuzumakicho. The score highlighted the economic contribution of wind energy and the social contribution of PV/solar and biomass/biogas as well.
5. CONCLUSION AND DISCUSSION
Based on the above findings and discussion, the following conclusions have been made.
1) Multiple factors are necessary for local RE promotion. Such several factors are playing key roles in the two case study areas. As the basis for RE promotion, abundant RE resources are fundamental. To initiate local RE development, a positive municipal energy planning concept and a vision that is developed by the local government are significant. Furthermore, in order to achieve the energy planning concept and the vision, a detailed energy strategy and implementation of the plan should be supported by relative local policies. Last but not least, the support from external companies, citizens, and a sufficient budget for the RE facilities’ installation are also highlighted in this study.
2) Various RE resources do not pose equal value in supporting local sustainability. Some of the highly evaluated sustainability values highlighted in this study are as follows. For wind energy, they contribute to climate mitigation, local tourism, and environmental education. For solar power, they are safe to the environment, citizens’ participation, and environmental education. For biomass energy, waste re-use, connection with local agriculture and forestry are highlighted in the evaluation.
Recommendations to the rural municipalities which plan to develop RE in the future are proposed as follows. 1) How many types of RE resources exist in their local areas and the exploitable RE potential based on local conditions should be clarified. The municipalities can utilize GIS, which is a useful tool that can support the RE potential analysis (Wang, Ikiugu, et al., 2014). 2) An efficient, appropriate energy strategy and plan should be made, and then its implementation ensured. Both of the cases have highlighted the significant role that local governments and policies play. 3) Before developing RE projects, cost-benefits should be balanced first. 4) Full advantage of technical and financial support from local or external companies and national or regional governments should be taken. 5) Local agriculture and forestry resources should be used and connected closely with biomass/biogas RE development and other businesses. 6) RE facilities should be managed and maintained, keeping the monitoring data and summarizing know-how experience for future use.
Although this study focused on rural areas, the energy demand-supply mismatch between urban and rural areas cannot be ignored. Rural areas in Japan and China are currently both facing depopulation problems since there are more “job opportunities and better life infrastructure” in urban areas than in rural areas. This results in high energy consumption in urban areas.
However, large scale RE facilities are difficult to install in urban areas because of issues such as land use, aesthetics, and noise pollution among
others. This is in contrast to rural areas that have more available land and resources for RE development. Therefore, in addition to considering key factors for RE promotion in rural areas, it is also important to take into account spatial planning for energy demand and supply between urban and rural areas to increase local and regional energy self-sufficiency. To support planning practice, GIS-based RE potential analysis and map making are useful tools to facilitate decision making in the RE planning process. The visualized information provided by GIS could be used in a participatory process for energy planning (Wang, Ikiugu, et al., 2014). Through a bottom- up approach for public participation, the current energy structure might gradually change by involving more and more people leading to creation of a more sustainable RE supply-demand network. It is hoped and expected that the energy transition occurs from citizens’ movements at municipal levels, after which the new concept expands to influence the upper levels of regional and national governments. In addition to the spatial planning tasks for RE, landscape aesthetics problems emanating from RE facilities, such as the visual impact of wind turbines, also puts forward a new challenge to the landscape architecture field. A new multi-discipline that is composed of RE, planning, and landscape architecture is emerging. However, because of the professional limitations and lack of multi-disciplinary knowledge and know- how between the above fields, this new multi-discipline area is yet to take root. To evoke research awareness on this topic, more theoretical and application studies are needed, so that proper ‘research-to-practice’
transitions can be made.
ACKNOWLEDGMENTS
The authors would like to express their gratitude to all the Energy Department workers of Kuzumakicho, Japan and Chongming Island, China that took time to respond to our questionnaires and on-site interviews.
REFERENCES
Chongming Gov. (2004). Mater Plan of Chongming Three Islands (2005-2020). (In Chinese).
Chongming Gov. (2009). Construction Guidelines of Ecological Chongming Island (2010- 2020). (In Chinese).
Dincer, I. (2000). “Renewable Energy and Sustainable Development: a Crucial Review”, Renewable and Sustainable Energy Reviews, 4(2), 157–75.
European Renewable Energy Council. (2012). Sustainable Communities - Experiences, Success Factors and Opportunities for the EU-25. [Online] Available:
http://www.erec.org/fileadmin/erec_docs/Projcet_Documents/Sustainable_Communities/S ustainable_Communities.pdf (July 17, 2012).
Global Wind Energy Council. (2013). Global Wind Report 2012. [Online] Available:
http://www.gwec.net/wp-content/uploads/2012/06/Annual_report_2012_LowRes.pdf (June 8, 2013).
Gosens, J., Y.L. Lu, G.Z. He, B. Bluemling, T.A.M. Beckers. (2013). “Sustainability Effects of Household-scale Biogas in Rural China”, Energy Policy, 54, 273-287.
International Energy Agency. (2011). Clean Energy Progress Report. [Online] Available:
http://www.iea.org/publications/freepublications/publication/name,3973,en.html (July 28, 2012).
Izutsu, K., M. Takano, M. Furuya, T. Iida. (2012). “Driving Actors to Promote Sustainable Energy Policies and Businesses in Local Communities: a Case Study in Bizen City, Japan”, Renewable Energy, 39, 107-113.