1
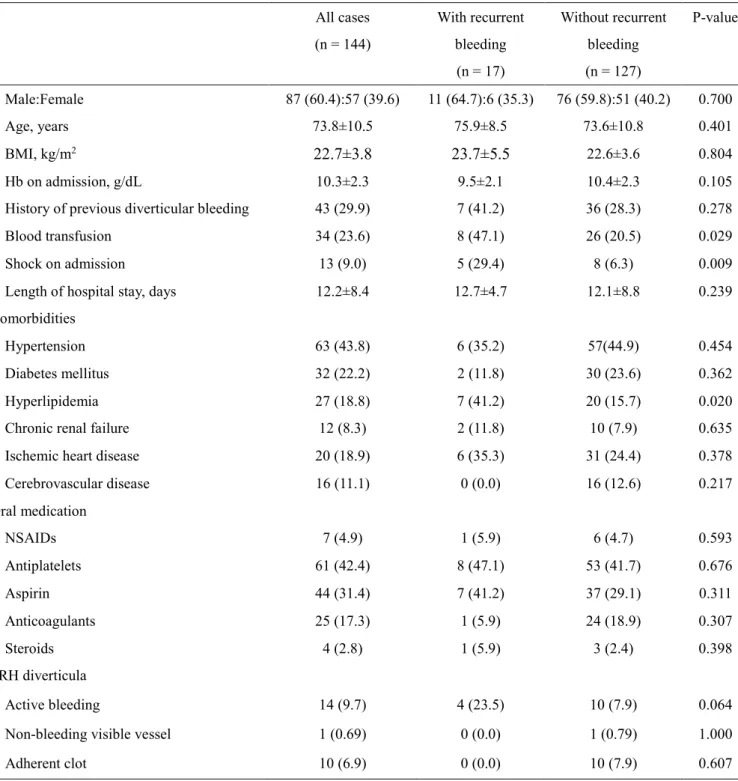
Table 1: Clinical features and characteristics of the 144 patients and comparison of clinical features between patients with and without recurrent bleeding
All cases (n = 144)
With recurrent bleeding (n = 17)
Without recurrent bleeding (n = 127)
P-value
Male:Female 87 (60.4):57 (39.6) 11 (64.7):6 (35.3) 76 (59.8):51 (40.2) 0.700
Age, years 73.8±10.5 75.9±8.5 73.6±10.8 0.401
BMI, kg/m2 22.7±3.8 23.7±5.5 22.6±3.6 0.804
Hb on admission, g/dL 10.3±2.3 9.5±2.1 10.4±2.3 0.105
History of previous diverticular bleeding 43 (29.9) 7 (41.2) 36 (28.3) 0.278
Blood transfusion 34 (23.6) 8 (47.1) 26 (20.5) 0.029
Shock on admission 13 (9.0) 5 (29.4) 8 (6.3) 0.009
Length of hospital stay, days 12.2±8.4 12.7±4.7 12.1±8.8 0.239
Comorbidities
Hypertension 63 (43.8) 6 (35.2) 57(44.9) 0.454
Diabetes mellitus 32 (22.2) 2 (11.8) 30 (23.6) 0.362
Hyperlipidemia 27 (18.8) 7 (41.2) 20 (15.7) 0.020
Chronic renal failure 12 (8.3) 2 (11.8) 10 (7.9) 0.635
Ischemic heart disease 20 (18.9) 6 (35.3) 31 (24.4) 0.378
Cerebrovascular disease 16 (11.1) 0 (0.0) 16 (12.6) 0.217
Oral medication
NSAIDs 7 (4.9) 1 (5.9) 6 (4.7) 0.593
Antiplatelets 61 (42.4) 8 (47.1) 53 (41.7) 0.676
Aspirin 44 (31.4) 7 (41.2) 37 (29.1) 0.311
Anticoagulants 25 (17.3) 1 (5.9) 24 (18.9) 0.307
Steroids 4 (2.8) 1 (5.9) 3 (2.4) 0.398
SRH diverticula
Active bleeding 14 (9.7) 4 (23.5) 10 (7.9) 0.064
Non-bleeding visible vessel 1 (0.69) 0 (0.0) 1 (0.79) 1.000
Adherent clot 10 (6.9) 0 (0.0) 10 (7.9) 0.607
Data are presented as mean ±standard deviation or number (%)
BMI, body mass index; Hb, hemoglobin; NSAID, nonsteroidal anti-inflammatory drug;
SRH, stigmata recent hemorrhage