九州大学学術情報リポジトリ
Kyushu University Institutional Repository
北部ベトナム紅河デルタの海岸地帯における農地土 壌の劣化
グェン, ワン, ティン
https://doi.org/10.15017/1931987
出版情報:Kyushu University, 2017, 博士(理学), 課程博士 バージョン:
権利関係:
Degradation of Agricultural Soils in a Coastal Zone of the Red River Delta, Northern Vietnam
Graduate School of Integrated Sciences for Global Society KYUSHU UNIVERSITY
NGUYEN VAN THINH
2018
CONTENTS
Abstract ... 1
Chapter 1 ... 3
General Introduction ... 3
1.1. Background of the study ... 3
1.2. Subjects of the study ... 4
1.3. Purpose of the study ... 5
Chapter 2 ... 6
Materials and Methods ... 6
1. Study area ... 6
2. Soil sampling ... 9
3. Analytical methods ... 9
3.1. Heavy metal and soil property analyses ... 10
3.2. Data analysis ... 10
Chapter 3 ... 12
Spatial Distribution of Arsenic and Heavy Metals in Soil and Sediment in Coastal Zone of Red River Delta ... 12
1. Introduction ... 13
2. Results ... 14
2.1. Soil factors in respective land use areas ... 14
2.2. Heavy metal concentration of soils under different land uses ... 18
2.3. Spatial distribution of heavy metals ... 22
2.4. Correlation of heavy metal concentrations with soil factors ... 26
2.5. Principal component analysis of heavy metal concentrations and soil factors ... 28
3. Discussion ... 30
3.1. Heavy metal accumulation and the effect of soil factors in relation to it under different land uses ... 30
3.2. The sources of heavy metals in soils ... 30
4. Conclusions ... 32
Chapter 4 ... 33
The Chemical Forms and Distribution of Arsenic and Heavy Metals in Soil and Sediment Profiles ... 33
1. Introduction ... 34
2. Materials and Methods ... 35
2.1. Soil sampling ... 35
2.2. Analytical methods ... 36
2.2.1. Arsenic bioavailability extraction ... 36
2.2.2. Sequential extraction for As and heavy metals ... 36
2.2.3. ICP-MS, FE-EPMA and XRD analysis ... 40
2.2.4. Soil properties analysis and total concentration of As and heavy metal... 41
2.3. Statistical analysis and data visualization ... 41
3. Results and Discussions ... 41
3.1. Soil and sediment characteristics ... 42
3.2. Mineralogy species and morphologies of surface soils and sediments ... 46
3.3. Profile of Total and bio-available concentrations of As in soil cores ... 50
3.4. Profile of heavy metal concentration in soil cores ... 54
3.5. Fractionation of As and heavy metals in soils and sediments ... 55
3.6. Principal component analysis for arsenic, heavy metals and soil properties... 57
4. Conclusions ... 61
Chapter 5 ... 63
Arsenic-Contaminated Soil Remediation ... 63
1. Introduction ... 64
2. Materials and Methods ... 66
2.1. The Soil Samples ... 66
2.2. Experimental Design ... 66
2.2.1. Sequential Extraction Protocol ... 66
2.2.2. Washing Experiments ... 68
2.3. Analytical Methods and Statistical Analysis ... 69
3. Results ... 70
3.1. Soil Characterizations ... 70
3.2. Sequential Extraction of Arsenic in Soil ... 70
3.3. Soil Washing Experiment Using Biodegradable Acids ... 72
3.3.1. Arsenic Extraction ... 72
3.3.2. Iron, Aluminum and Manganese Extraction ... 74
3.4. Arsenic Fraction after the Washing Experiment ... 77
4. Discussion ... 79
4.1. Toxicity Potential of Arsenic in Soil Samples ... 79
4.2. Effectiveness of Biodegradable Organic Acid in Arsenic Removal ... 80
5. Conclusions ... 85
Chapter 6 ... 87
Summary Conclusion ... 87
ACKNOWLEDGEMENTS ... 88
APPENDIX ... 90
REFERENCES ... 109
List of Figures
Figure 2.1. Study area and soil collection sites in Ba-Lat estuary ... 6
Figure 2.2. The average rainfall (mm) of each month in the period 2002-2016 in Nam-Dinh province, northern Vietnam ... 7
Figure 3.1. The soil texture of all soil samples base on USDA textural classes ... 17
Figure 3.2. The boxplot of heavy metal concentrations in soil samples of the five land uses ... 18
Figure 3.2. The boxplot of heavy metal concentrations in soil samples of the five land uses ... 19
Figure 3.2. The boxplot of heavy metal concentrations in soil samples of the five land uses ... 20
Figure 3.3. The spatial distribution of heavy metals in soils under five land uses (continuing) ... 23
Figure 3.3. The spatial distribution of heavy metals in soils under five land uses (continuing) ... 24
Figure 3.3. The spatial distribution of heavy metals in soils under five land uses (continued) .... 25
Figure 3.4. The results of the principal component analysis for all heavy metals and soil factors in five land uses. ... 28
Figure 4.1. Locations of sampling sites in the Ba-Lat estuary, Red river, Vietnam. ... 36
Figure 4.2. The percentage of soil particles (clay, silt and sand) by layers in six soil profiles (continuing) ... 43
Figure 4.2. The percentage of soil particles (clay, silt and sand) by layers in six soil profiles (continued) ... 44
Figure 4.3. The back scattered electron (BSE) images of iron hydroxide and iron-sulfide phases in soil and sediment samples. ... 46 Figure 4.4. XRD results for soil and sediment samples ... 47 Figure 4.5. The peak for arsenic on the surfaces of some iron compounds in soil and sediment samples using WDS technique on FE-EPMA ... 49 Figure 4.6. The distribution of total and bio-available As concentration in soil profiles
(continuing) ... 50 Figure 4.6. The distribution of total and bio-available As concentration in soil profiles
(continued) ... 51 Figure 4.7. The fractionation of As and heavy metals in top-soil layer samples ... 55 Figure 4.8. The principal component analysis results for all trace toxic elements and property parameters of samples in six soil cores ... 58 Figure 5.1. Speciation of arsenic using the modified sequential extraction method in four soil samples ... 71 Figure 5.2. Effect of oxalic and citric acid in various concentrations, mixtures of oxalic (0.2 M) + ascorbic (0.1 M), and mixtures of citric (0.2 M) + ascorbic (0.1 M) on arsenic removal from river bed sediment (a), mangrove forest soil (b), paddy soil (c) and aquaculture farm sediment (d). ... 73 Figure 5.3. Extracted aluminum under the effect of oxalic and citric acid in various
concentrations (from 0.01 M to 0.2 M), and the combination of 0.1 M ascorbic with 0.2 M oxalic, and the combination of 0.1 M ascorbic with 0.2 M citric acid in river bed sediment (a), mangrove
forest soil (b), paddy soil (c) and aquaculture farm sediment (d). ... 76 Figure 5.4. Extracted iron under the effect of oxalic and citric acid in various concentrations (from 0.01 M to 0.2 M), and the combination of 0.1 M ascorbic with 0.2 M oxalic acid, and the combination of 0.1 M ascorbic with 0.2 M citric acid in river bed sediment (a), mangrove forest soil (b), paddy soil (c) and aquaculture farm sediment (d). ... 77 Figure 5.5. Percentages of arsenic removal and remnants in soils under the synergistic effect of ascorbic acid with each single solution of oxalic and citric acids. ... 78
List of Tables
Table 2.1. The areas of main land uses in agricultural sector in coaster area, Vietnam ... 8
Table 3.1. Soil properties of the samples under different land uses. ... 15
Table 3.2. The correlation coefficient between heavy metals and soil factors under different land uses. ... 27
Table 4.1. The sequential extraction scheme for arsenic in soils ... 38
Table 4.2. The sequential extraction scheme for heavy metals in soils ... 39
Table 4.3. Mean values of main characteristics of soil layers in six cores ... 45
Figure 4.3. The back scattered electron (BSE) images of iron hydroxide and iron-sulfide phases in soil and sediment samples. (a) Irregular aggregates of iron sulfides (bright contrast) surrounding pyrite framboids in mangrove forest soil. (a-1) Microcrystal pyrite framboids with variable size of pyrite grains (Py). (b) Single framboidal pyrite in mangrove forest soil. The surrounding grey areas are mostly silicate and iron hydroxides. (c) Iron hydroxide (brightest) coated quartz grain (Qtz) in river sediment sample. (d) Crystalline iron hydroxide with spongy phase (d-1) and individual pyrite grains (Py) in thin section of river bed sediment. ... 46
Figure 4.4. XRD results for soil and sediment samples ... 47
Figure 4.5. The peak for arsenic on the surfaces of some iron compounds in soil and sediment samples using WDS technique on FE-EPMA ... 49
Figure 4.6. The distribution of total and bio-available As concentration in soil profiles
(continuing) ... 50 Figure 4.6. The distribution of total and bio-available As concentration in soil profiles
(continued) ... 51 Table 4.4. The concentration of As and heavy metals (µg/g) in soil cores in mangrove forest and paddy field ... 53 Figure 4.7. The fractionation of As and heavy metals in top-soil layer samples ... 55 Figure 4.8. The principal component analysis results for all trace toxic elements and property parameters of samples in six soil cores ... 58 Table 5.1. Modified sequential extraction scheme for arsenic in soils used in this study. ... 67 Table 5.2. The mean values of some major soil properties for four soil samples used in the
experiments. ... 82
Abstract
The heavy metal contamination of soils (including sediments) in an estuary is a serious issue because a healthy estuarine environment, including soil environment, is important in achieving an ecological balance and good aquaculture production. The Ba-Lat estuary of the Red River is the biggest estuary in northern Vietnam, with different land uses; however, the heavy metal contamination of soils there has not been clarified yet. This research was conducted to clarify the contamination levels, supply sources and the effect of land use on the heavy metal concentrations in the estuary. Soil samples were collected from the top soil layer of the estuary, and their arsenic (As), chromium (Cr), cadmium (Cd), copper (Cu), lead (Pb) and zinc (Zn) concentrations were analyzed along with soil factors. Most soils in the estuary were loam, silt loam and sandy loam soils. The pH was neutral and cation exchange capacity was in the range from 3.8 to 20.2 meq/100 g soil. Manganese and iron concentration were on average 811 µg.g-1 and 1.79 %, respectively. The magnitude of the heavy metal concentrations of the soils were in the order of Zn > Pb > Cr > Cu >
As > Cd. The concentrations were higher in the river bed and mangrove forest than in the other land use areas. The mean concentrations of the heavy metals were mostly lower than the permissible level in agricultural soils in Vietnam, except for As concentration. The correlation and principal component analyses showed that As, Pb, Zn, Cd and Cu in the soils were of anthropogenic origin, whereas Cr was of non-anthropogenic origin. The spatial distribution of the concentrations with land use indicated that the mangrove forest played an important role in preventing the spread of heavy metals to other land uses and maintaining the estuarine environment.
In this study, the first investigation of arsenic (As) contamination in soil cores in Ba-Lat estuary, the biggest estuarine ecosystem in northern Vietnam, was conducted. Concentration of As together with other heavy metals and mineralogy characteristic of soils and sediments in different
land uses were analyzed using XRD, EPMA and ICP-MS techniques. Most of the soils contained high proportions of As in iron, manganese (hydr)oxides, and iron crystalline whereas heavy metals were mainly in fractions that associated with carbonate, iron and manganese oxides and silicate minerals. High concentrations of As (up to 39.3 µg.g-1)and heavy metals were observed in river sediments and top-layers of mangrove forest soil cores. Quantitative analyses using WDS technique on FE-EPMA system found As on the surface of iron (hydr)oxides and framboidal pyrite in the samples, especially in the mangrove forest soils and river sediments. The principal component analysis indicated the enrichment of As and heavy metals in the upper soil layers, suggesting that intensive human activities in upstream of Red river in recent decades were the cause of elevated levels of these toxic elements in the estuarine ecosystem of Ba-Lat estuary.
A series of remediation tests were conducted using a washing method with biodegradable organic acids, including oxalic, citric and ascorbic acids. The single oxalic and citric acid solutions showed lower efficiency for arsenic removal than the combination of these acids with ascorbic acid.
Approximately 80% of the arsenic in one sample was removed under the effect of the ascorbic and oxalic acid combination, which was roughly twice higher than the effectiveness of the ascorbic and citric acid combination under the same conditions. The close correlation between extracted arsenic and extracted iron/aluminum suggested that arsenic was removed via the dissolution of Fe/Al oxides in soils. The fractionation of arsenic in four contaminated soils was investigated using a modified sequential extraction method. Regarding fractionation, we found that most of the soil contained high concentrations of arsenic (As) in exchangeable fractions with phosphorus, amorphous oxides, and crystalline iron oxides, while a small amount of the arsenic fraction was organic matter bound. After treatment with the degradable organic acids, most of the arsenic content remaining in the soils was in iron crystalline oxides, organic matter and residual fractions.
This study indicated that the use of biodegradable organic acid is not only an environmentally friendly method but also a highly effective means for arsenic-contaminated soil remediation.
Chapter 1
General Introduction
1.1.
Background of the study
Soil degradation is defined as “the decline in soil quality caused through its misuse by human activity” (Edwards 1991). More specifically, it refers to the decline in soil productivity through wind and water erosion, loss of organic matter, breakdown of soil structure, salinization and chemical contamination. Soil degradation is caused by both natural and anthropogenic phenomena (Vu et al. 2014). An obvious economic impact of soil degradation is on agricultural productivity.
In natural, soil supply essential nutrients, water and environment for plant growth, therefore, the degradation of capacity and intensity of water, nutrients and present of toxic elements in soil availability affects plant growth and their quality.
Vietnam, which is a developing country, have been facing many serious environmental problems in recent decades due to the rapid industrialization and urbanization. Base on the report of National environmental current status in the period 2011-2015 (MONRE 2015), the soil contamination and degradation phenomena in Vietnam in recent time was mainly caused by mining, industrial and agricultural activities. The concentrations of heavy metals in soils in many areas, where located near industrial parks and mining zones, were exceeded the allowable limit for agricultural soil in Vietnam. Additionally, more than 100 rivers in Vietnam pour some 80 km3 of water depositing around 300 million tons of alluvium into the sea each year, which can carry pollutants such as toxic metals, pesticides and hazardous substances from upstream to the estuarine and coastal areas (Vietnamnet 2016). Very recently, in 2016, the worst environmental disaster
happened in the coastal area of Central Vietnam due to the illegal/accidental discharge of toxic wastewater to the coast, causing several billion dollars of damage (The Guardian 2016). Therefore, the environmental issues of marine and coastal areas in recent years have been a special concern of resident and government in Vietnam.
In northern Vietnam, there are many estuarine areas, having a high biodiversity and suitable environment for developing the agriculture and aquaculture sectors. The biggest estuary in this area is Ba-Lat, which is the final destination of Red river before discharging into the ocean. Furthermore, Red river is one of the biggest river in Vietnam that flows from Yunnan province, southwest China through northern Vietnam to the Gulf of Tonkin at Nam-Dinh province. Annually, a large amount of alluvial sediment from upstream have been accumulating in Ba-Lat estuary, which thanks to the high density of mangrove forest. Therefore, the environmental quality, including soil and sediment, in this area are strongly influenced by the toxic substances in water and alluvial materials from upstream of Red river.
In previous study, high concentration of some toxic elements, such as Pb, Cd, Cu, were detected in some soils in Ba-Lat estuary. However, the detail information of spatial distribution, the fractionation of these toxic elements had not been yet revealed. Furthermore, there are not any study to measure the content of arsenic in soils and sediments in this area until now. Therefore, a study on arsenic and heavy metals contamination in this area is necessary.
1.2.
Subjects of the study
o The study focus on the soil and sediment at Ba-Lat estuary, northern Vietnam.
o The arsenic and five heavy metals in the soils and sediments are the main subjects in this study.
1.3.
Purpose of the study
o The spatial distribution map of six toxic elements in surface soils/sediments, including As, Cd, Pb, Cr, Zn, Cu, will be established.
o The distribution of As and five heavy metals in soil profiles will be measured.
o The detail information of arsenic and heavy metals in different chemical forms in soils/sediments will be revealed.
o The soil/sediment properties, especially the mineralogy and morphological of minerals in the samples will be analyzed.
o The suitable method for arsenic-contaminated soil remediation using bio-degradable organic substances will be tested and assessed in this study.
Chapter 2
Materials and Methods
1. Study area
In the present study, the Ba-Lat estuary, located in Giao Thuy and Xuan Truong districts, Nam-Dinh Province in Vietnam (Figure 2.1), was targeted. Base on the local history, Ba-Lat estuary had formed in 1787 after a big flood of Red river. The main sector of this area is agriculture, consisting of three main land uses, including paddy rice, aquaculture, forest. The detail information of land uses in this area, and other coastal areas in Vietnam was showed in Table 2.1.
Figure 2.1. Study area and soil collection sites in Ba-Lat estuary
The major soil type of the study area is Fluvisols. In the area, rice planting is performed under a developed irrigation system. The irrigation water is taken from the Red River. Many aquaculture farms are located between the dike and mangrove forest. Among the aquaculture farms, shrimp
portion of the farms. In a shrimp farm, mangrove trees are planted around and inside the farm, and this kind of tree is not planted in the clam farm. Both shrimp and clam farms were affected by daily tides and changes in the water of the Red River.
The dominant trees of the mangrove forests are Sonneratia caseolaris, Bruguiera gymnorhiza, Kandelia candel, Aegiceras corniculatum, and Acanthus ilicifolius, which play an important role in filtering and depositing alluvial materials and various pollutants that was transported from upstream (Tue et al. 2012). Furthermore, the Ba-Lat estuary is an important site for breeding and stopover of annual migratory birds, and it provides the habitat for local wildlife.
The estuary is located in a monsoon climate zone with a rainy season from May to October and a dry season from November to April. The annual temperature and rainfall vary from 15.9 to 29 °C and from 1,300 mm to 1,800 mm, respectively. The average rainfall (mm) of each month in 15 years (from 2002 to 2016) in Nam-Dinh province was showed in Figure 2.2.
Figure 2.2. The average rainfall (mm) of each month in the period 2002-2016 in Nam-Dinh province, northern Vietnam
0 50 100 150 200 250 300 350
Jan Feb Mar Apr May Jun Jul Aug Sep Oct Nov Dec
Mean values of Rain fall in Nam-Dinh province (mm)
Table 2.1. The areas of main land uses in agricultural sector in coaster area, Vietnam
Land Uses Land use types Area (ha) Proportion (%)
Location Red river delta Coastal central
delta
Coastal southern delta
Rice Two seasons of rice/year 469.917 19,26 50.061 116.971 302.885
One season of rice/year 213.428 8,75 18.15 32.122 163.156
Rice and
Vegetable Rice and Vegetable 117.998 4,84 11.877 27.608 78.513
Vegetable Vegetable; shorterm
industrial crops 149.931 6,14 3.643 116.328 29.96
Fruit trees Fruit trees 130.663 5,35 7.22 71.853 51.59
Aquaculture
Rice + Aquaculture 279.455 11,45 11.194 12.668 255.593
Extensive aquaculture 77.195 3,16 17.057 14.928 45.21
Semi-intensive aquaculture 95.811 3,93 12.277 8.145 75.389
Intensive aquaculture 46.234 1,89 4.49 4.06 37.684
Forest Mangrove forest 84.925 3,48 10.688 35.692 38.545
Protection forest 735.243 30,13 101.642 558.738 74.863
Agro-forest Mangrove forest -
Aquaculture 39.414 1,62 5.344 15.565 18.505
Total area (ha) 2.440.214 100 253.463 1.014.678 1.171.893
2. Soil sampling
In this study, soil and sediment were sampled in two dimensions, including on the surface and deeper layers. Firstly, the soil and sediment sampling method for surface layers were described in this chapter. The detail description for soil sampling by layer will be showed in Chapter 4.
The study focused on the following five land uses in this area: (1) paddy field located inside the dyke (in soil sampling section, paddy field was located in both inside and outside the dyke); (2) extensive shrimp farms, (3) extensive clam farms, (4) mangrove forest located outside the dike, and (5) the river bed of the Red River, respectively.
Soil samples were collected from total 67 sites in each land use. The soil (sediment) of the river bed of the Red River was collected along 20 kilometers from the river mouth. The sampling was done in February, 2016. The location of the soil sampling sites is shown in Figure 2.1.
At each sampling site, top layer (0-10 cm) soil was collected from five spots in a 10 m2 area.
A quantity of soil weighing 0.5 kg was collected at each spot. All samples were packed in plastic bags and transported to the laboratory. The samples were broken into small pieces, stones and plants were removed, and the sample was dried in a drying oven at 40 ℃ for 48 hours, then sieved through a 2-mm sieve. Five soil samples at each site were mixed well, and 500 g of the soil was taken from the mixture. The sample was put it in a polyethylene bag and sealed until analysis.
Among the 67 samples, 32 samples were collected from paddy fields inside the dike, 26 samples from the field outside the dike, i.e., 6 from clam farm, 6 from shrimp farm, 14 from mangrove forest, and 9 from river bed of the Red River. All samples were brought to Kyushu University, Japan for the analysis.
3. Analytical methods
In this chapter, the methods for total As and heavy metal analysis, the main soil properties analysis were exhibited. Other methods for specific purposes, such as fractionation analysis,
mineralogy analysis, soil remediation test, will be presented in Chapter 4 and Chapter 5 of this thesis.
3.1. Heavy metal and soil property analyses
Approximately 0.5 g soil sieved through a 0.2 mm sieve was used for digestion by the USEPA 3050B method (USEPA - United States Environmental ProtectionAgency 1996). The digested solution was filtered through a 4-µm filter (No. 5B; Toyo Roshi Kaisha, Ltd.), and diluted to 100 mL for measuring As, Zn, Pb, Cr, Cu, Cd by Inductively Coupled Plasma-Mass Spectrometry (ICP- MS, 7500ce, Agilent Technologies, Inc.). The solutions were also used to analyze Fe and Mn by Atomic Absorption Spectroscopy (AAS, Hitachi Z-2300, Hitachi Science & Technology). Each sample was prepared in triplicate.
The organic carbon (OC) content in soil was measured by Walkley method (Walkley, Black 1934). The pH was measured by a pH meter (D-55, Horiba Ltd., Japan) with 1:5 soil/water suspension (George E.Rayment and David Lyons 2011). The particle size distribution of the soil was analyzed by the pipette method (SSSA 1986). The cation exchange capacity (CEC) of the soil was analyzed by ammonium acetate method (SSSA 1996). All reagents were of analytical grade, and double deionized water (Milli-Q Millipore 18.2 MΩ/cm resistivity) was used for dilutions.
3.2. Data analysis
We used the R program, version 3.2.1 (The R Core Team 2016) on R-Studio version 0.99.902 (RStudio Team 2016) for data analysis. Multiple comparison (pairwise comparison) test was applied to determine the significant differences in mean heavy metal concentrations between different land uses. The relationship of heavy metal concentrations to soil factors was assessed by Pearson’s correlation coefficient analysis. Pairwise comparison test and Pearson’s correlation coefficient analysis were done by stats package (The R Core Team 2016).
apportion the contribution between anthropogenic versus natural sources (Zitko 1994; Tahri et al.
2005; C. Sun et al. 2013; Liu, Ma, and Qu 2015; Gao et al. 2015). To effectively undertake PCA of such closed data, log-ratio transformation is highly recommended to determine and reveal inherent patterns in the biogeochemical data (Faith 2015; Xiong and Zuo 2016). In this study, raw (untransformed) and centered log-ratio (clr) transformed data (John Aitchison and Greenacre 2002;
J. Aitchison 1986) were used in PCA. In this study, principal component analysis was performed by using FactoMineR package (Lê, Josse, and Husson 2008). The package compositions (K. Gerald van den Boogaart and Raimon Tolosana and Matevz Bren 2014) was used to data transformation by the centered log-ratio transformation. Results of PCA for both un-transformed and clr- transformed data were visualized by using the factoextra package (Kassambara 2015).
For obtaining soil texture class, the ggtern package (Hamilton Nicholas 2016) was used. For plotting the box plot of heavy metal data, the gglot2 package (Hadley Wickham 2009) was used.
The spatial distribution map of heavy metal concentrations was created using ArcMap 10 software.
Chapter 3
Spatial Distribution of Arsenic and Heavy Metals in Soil and
Sediment in Coastal Zone of Red River Delta
1. Introduction
Heavy metals and metalloids in soils are not only provided from natural sources such as erosion and weathering of rocks, but also from anthropogenic sources such as industrial activities, agricultural production, and household wastewater (Alloway 2013).
Recently, many articles have showed that agricultural and mangrove forest soils, and aquaculture sediment in estuary were contaminated by heavy metals (de Paula Filho et al. 2015;
Elbana et al. 2013; Li et al. 2013; C. Sun et al. 2013; Liu, Ma, and Qu 2015; Singh et al. 2009; Q.
Wu et al. 2014; Gao et al. 2015). The top layer of soils could retain heavy metals present in the water irrigated to the land by the adsorption of soil particles. After the accumulation of heavy metals in soils, heavy metals can be released into soil solution and taken up by plants (McLaughlin 2000; B.McBride 1994). In aquaculture areas, fish and aquatic organisms can accumulate the heavy metals of As, Cu and Zn (Kalantzi et al. 2013). The heavy metals from aquatic environment may threaten human health via seafood consumption (Liang et al. 2016). Therefore, the assessment of heavy metal contamination in soils (including sediments) in an estuary is primarily important.
In the Red River Delta (RRD), the Ba-Lat estuary is the biggest estuary in northern Vietnam, having a high biodiversity. The mangrove forest in the Ba-Lat estuary has an important role not only for ecological balance but also for the local economy, and the environment and ecosystem of the mangrove forest have deteriorated because of the pressure from economic development upstream (Tue et al. 2012; de Paula Filho et al. 2015; Duc et al. 2007). Previous studies in the RRD showed that heavy metals were accumulated in top soil layer of the mangrove forest (Tue et al.
2012), and trace metal concentrations varied with land use (Phuong et al. 2009). However, the heavy metal concentrations of the soils under different land uses in the estuary area has not been clarified yet. There are five main land uses in the estuary are mentioned later. Further, the relationship between heavy metal concentrations and soil factors (physiochemical properties, soil texture, etc.) have not been revealed yet.
In the present study, therefore, the soils under different land uses were collected from the Ba- Lat estuary and their heavy metal concentrations and soil factors were analyzed. The main purposes are to clarify (1) the concentration and distribution of heavy metals in soils under different land uses; (2) the relationship between soil properties and heavy metal concentrations; (3) the source of heavy metals and (4) effect of the land use on the heavy metal concentrations.
2. Results
2.1. Soil factors in respective land use areas
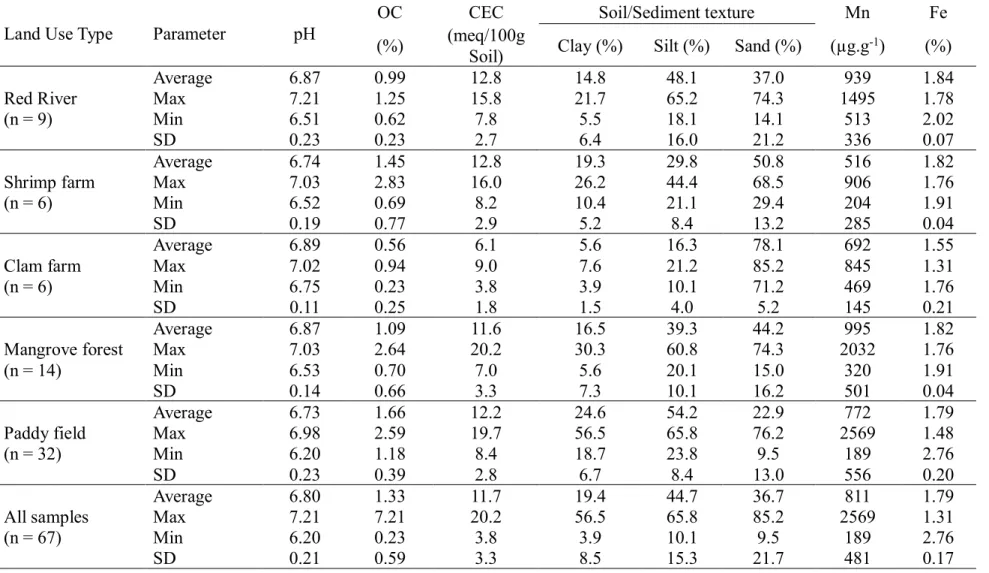
The soil factors, including pH, CEC, OC and soil textures, were shown in Table 3.1.
According to Table 3.1, pH was near neutral with a mean of 6.8. Variation of the pH was low with a low standard deviation (SD = 0.21).
Table 3.1. Soil properties of the samples under different land uses.
Land Use Type Parameter pH
OC CEC Soil/Sediment texture Mn Fe
(%) (meq/100g
Soil) Clay (%) Silt (%) Sand (%) (µg.g-1) (%) Red River
(n = 9)
Average 6.87 0.99 12.8 14.8 48.1 37.0 939 1.84
Max 7.21 1.25 15.8 21.7 65.2 74.3 1495 1.78
Min 6.51 0.62 7.8 5.5 18.1 14.1 513 2.02
SD 0.23 0.23 2.7 6.4 16.0 21.2 336 0.07
Shrimp farm (n = 6)
Average 6.74 1.45 12.8 19.3 29.8 50.8 516 1.82
Max 7.03 2.83 16.0 26.2 44.4 68.5 906 1.76
Min 6.52 0.69 8.2 10.4 21.1 29.4 204 1.91
SD 0.19 0.77 2.9 5.2 8.4 13.2 285 0.04
Clam farm (n = 6)
Average 6.89 0.56 6.1 5.6 16.3 78.1 692 1.55
Max 7.02 0.94 9.0 7.6 21.2 85.2 845 1.31
Min 6.75 0.23 3.8 3.9 10.1 71.2 469 1.76
SD 0.11 0.25 1.8 1.5 4.0 5.2 145 0.21
Mangrove forest (n = 14)
Average 6.87 1.09 11.6 16.5 39.3 44.2 995 1.82
Max 7.03 2.64 20.2 30.3 60.8 74.3 2032 1.76
Min 6.53 0.70 7.0 5.6 20.1 15.0 320 1.91
SD 0.14 0.66 3.3 7.3 10.1 16.2 501 0.04
Paddy field (n = 32)
Average 6.73 1.66 12.2 24.6 54.2 22.9 772 1.79
Max 6.98 2.59 19.7 56.5 65.8 76.2 2569 1.48
Min 6.20 1.18 8.4 18.7 23.8 9.5 189 2.76
SD 0.23 0.39 2.8 6.7 8.4 13.0 556 0.20
All samples (n = 67)
Average 6.80 1.33 11.7 19.4 44.7 36.7 811 1.79
Max 7.21 7.21 20.2 56.5 65.8 85.2 2569 1.31
Min 6.20 0.23 3.8 3.9 10.1 9.5 189 2.76
SD 0.21 0.59 3.3 8.5 15.3 21.7 481 0.17
The organic carbon content ranged from 0.23 to 2.83 % with a mean of 1.66 %. According to the mean OC, OC in land use was in the order of paddy field > shrimp farm > mangrove forest
> river bed > clam farm. According to the pairwise comparison test (Table S1), the OC in the clam farm was significantly lower than those in the other land uses, while no significant difference in OC was observed between clam farm, river bed, and mangrove forest.
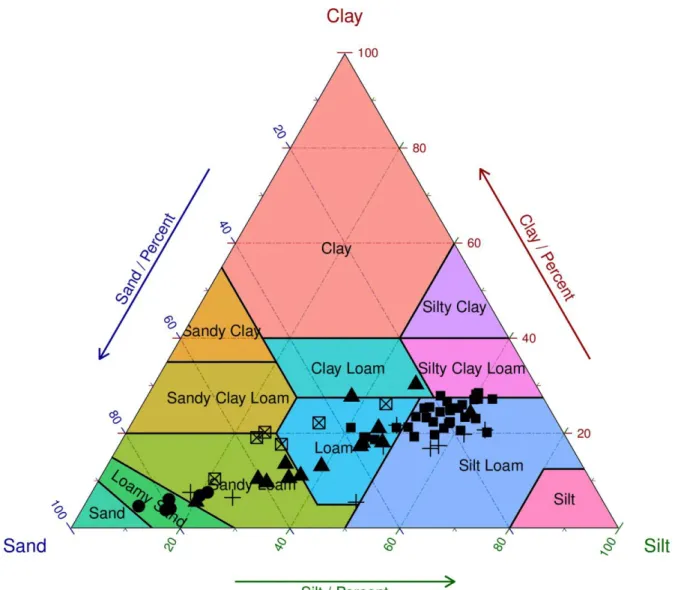
Soil texture in each land use was shown in Table 3.1. According to Table 3.1, silt and sand were dominant in the study area. However, the percentages of clay, silt and sand varied with land use. The average clay percentage in land use was in the order of paddy field > shrimp farm >
mangrove forest > river bed > clam farm. From Table S1, the clay percentage was significantly lower in clam farm than in the other land uses, while, the percentage was significantly higher in paddy field than in river bed, clam farm, and mangrove forest. There were no differences between the other land uses. In addition, the silt percentage was significantly different between each pair of the land use.
Figure 3.1 shows the soil textural class in each land use. Based on Figure 3.1, the soils were composed mostly of silt loam in the paddy field. In clam farms, the soils were mostly of loamy sand and sandy loam. In the mangrove forest and shrimp farm, the soils were mostly sandy loam and loam. In the river bed, the soils were mostly silt loam, loam and sandy loam.
The CEC of soils in each land use was shown in Table 3.1. The average CEC (meq/100g soil) was 12.8, 12.8, 6.1, 11.6 and 11.9 for river bed, shrimp farm, clam farm, mangrove forest and paddy field, respectively. According to the pairwise comparison test (Table S1), CEC in the clam farm was significantly lower than in the other land uses. However, CEC was not different between paddy field and mangrove forest, and between river bed and shrimp farm.
Figure 3.1. The soil texture of all soil samples base on USDA textural classes
Table 3.1 also showed the concentrations of Mn and Fe in the soils. According to Table 3.1, Mn concentration ranged widely from 189 to 2,569 µg.g-1 for all samples. Shrimp and clam farms had the lowest concentration of Mn in average (516 and 692 µg.g-1), whereas mangrove forest had the highest Mn concentration (995 µg.g-1). The Fe concentrations were high in all samples, ranging from 1.3 to 2.8 %. In the five land uses, clam farm had the lowest Fe concentration (1.8% in average).
2.2. Heavy metal concentration of soils under different land uses
Figure 3.2. The boxplot of heavy metal concentrations in soil samples of the five land uses. The black solid line inside the box is the median value; the black rhombic shape is the mean value; the
Figure 3.2. The boxplot of heavy metal concentrations in soil samples of the five land uses. The black solid line inside the box is the median value; the black rhombic shape is the mean value; the
Figure 3.2. The boxplot of heavy metal concentrations in soil samples of the five land uses. The black solid line inside the box is the median value; the black rhombic shape is the mean value; the
The magnitude of heavy metal concentrations in soils for all samples were in the order of Zn
> Pb > Cr > Cu > As > Cd. The heavy metal concentrations in each land use were shown in Figure 3.2.
The Cr concentrations ranged from 26.9 to 63.1 µg.g-1, with a wide variation with the land uses. Soils of the clam and shrimp farms had low Cr concentrations (28.8 and 32.3 µg.g-1 in average) with no significant differences between them (Figure 3.2 and Table S1), while the Cr concentration of the paddy field, mangrove forest and river bed ranged larger than 40 µg.g-1 with no significant differences between them (Figure 3.2 and Table S1).
The Cu concentrations of the soils according to the land use ranged from 14.9 to 67.2 µg.g-1. This maximum exceeded the permissible level of 60 µg.g-1 for agricultural soils in Vietnam (MONRE - Ministry of Natural Resources and Environment of The Socialist Republic of Vietnam 2008). The average Cu concentration was in the order of clam farm < paddy field < shrimp farm <
mangrove forest < river bed. The Cu concentration in river bed varied widely from 27.0 and 67.2 µg.g-1, whereas the concentrations (µg.g-1) did not vary widely in the paddy field (14.9 - 21.8) and clam farm (20.8 - 37.5).
The Zn concentrations (µg.g-1) for all samples ranged from 32.1 to 92.4 with a mean of 59.5.
All values were within the permissible level for agricultural soils (200 µg.g-1). From the viewpoint of land use, the lowest was observed in the clam farm (36.2 µg.g-1), while the highest was in the mangrove forest (65.7 µg.g-1). The average Zn concentration (µg.g-1) was 63.4, 53.3 and 51.8 in the river bed, paddy field and shrimp farm, respectively, with no significant differences between them (Fig 3.2 and Table S1).
The As concentration (µg.g-1) for all samples ranged from 6.9 to 31.0, with a mean of 14.5.
Most values exceed the permissible level for agricultural soils in Vietnam (12 µg.g-1). In paddy field, the As concentration exceeded the permissible level at 22 % of all sites. No sample exceeded the level in clam farm. The As concentration based on land use was in the order of river bed >
mangrove forest > shrimp farm > paddy field > clam farm (Figure 3.2). There was no significant difference between clam farm, paddy field and shrimp farm, and between mangrove forest and river bed (Figure 3 and Table S1).
The Cd concentration (µg.g-1) ranged from 0.05 to 0.43, all of which were lower than the permissible level for agricultural soils in Vietnam (2.0 µg.g-1). The highest Cd concentration was observed in river bed (0.43 µg.g-1), while the lowest was in the clam farm (0.05 µg.g-1).
The Pb concentration (µg.g-1) for all samples ranged from 24.2 to 78.3 with a mean of 43.4.
Most of the concentrations were within the permissible level for agricultural soils in Vietnam (70 µg.g-1). The Pb concentration based on land use was in the order of river bed > mangrove forest >
shrimp farm > paddy field > clam farm (Figure 3.2).
2.3. Spatial distribution of heavy metals
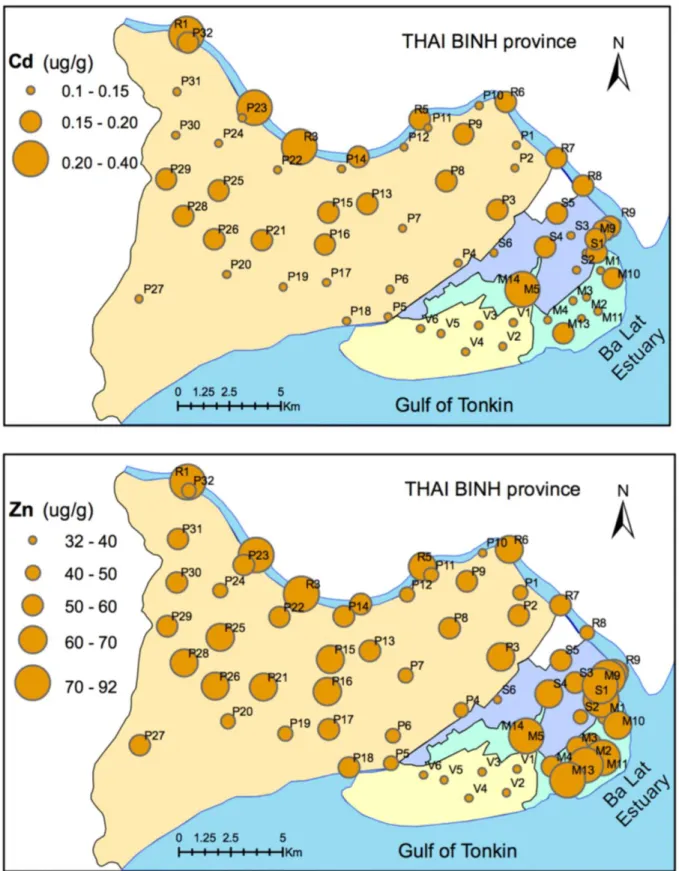
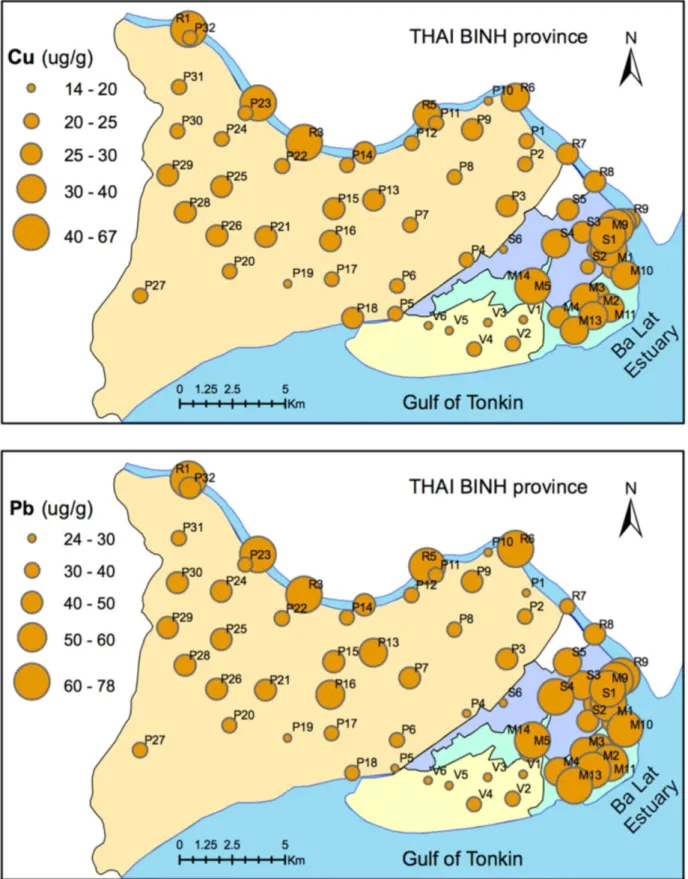
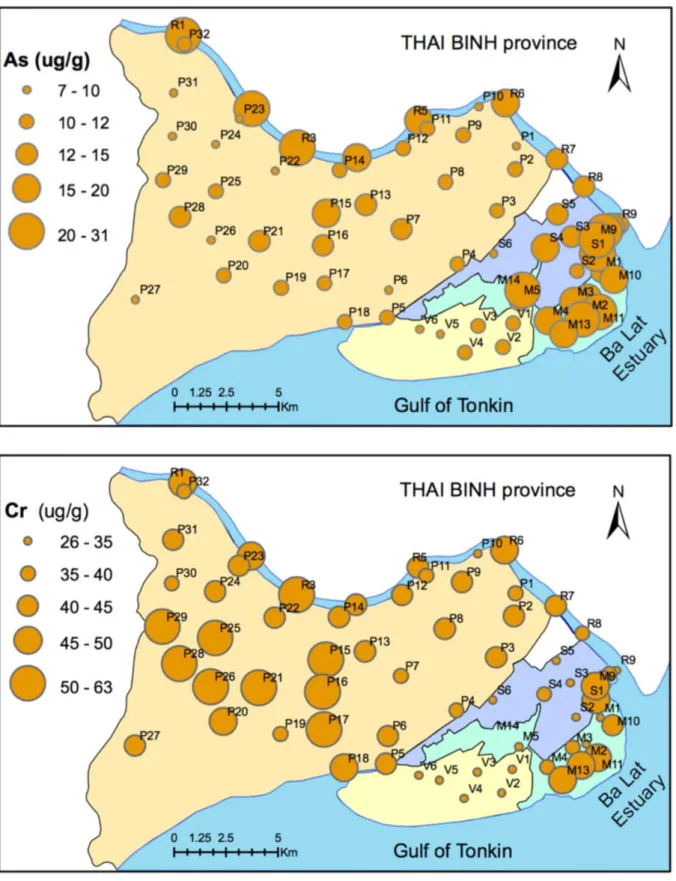
Figure 3.3 visualized the spatial distribution of heavy metal concentrations, in which the bubble represented the level of heavy metal concentrations. The data of heavy metal concentration and coordinate of each sample were showed in Table S2.
According to Figure 3.3, high Cr concentration (> 60 µg.g-1) was observed in both paddy field (P15 and P16 sites), and mangrove forest (M14 site). In contrast, low Cr concentrations with less than 40 µg.g-1 were observed in clam and shrimp farms. For the river bed, the samples at the mouth of river (R8 and R9 sites) had lower concentration than in the other sites.
The Cu, Pb, Zn, As and Cd concentrations demonstrated a similar spatial distribution with each other. The hotspots were observed in the river bed upstream (R1, R2 and R3 sites), and in mangrove forest and shrimp farm. The heavy metal concentrations, especially Cd concentration were low in the clam farm. The concentrations were lower in the paddy field than in the river bed and mangrove forest, except for Cr concentration. The paddy field near the central part (P15, P16,
P25 and P29 sites), which had a high population density, tend to have higher concentrations than in the other parts.
Figure 3.3. The spatial distribution of heavy metals in soils under five land uses (continuing)
Figure 3.3. The spatial distribution of heavy metals in soils under five land uses (continuing)
Figure 3.3. The spatial distribution of heavy metals in soils under five land uses (continued)
2.4. Correlation of heavy metal concentrations with soil factors
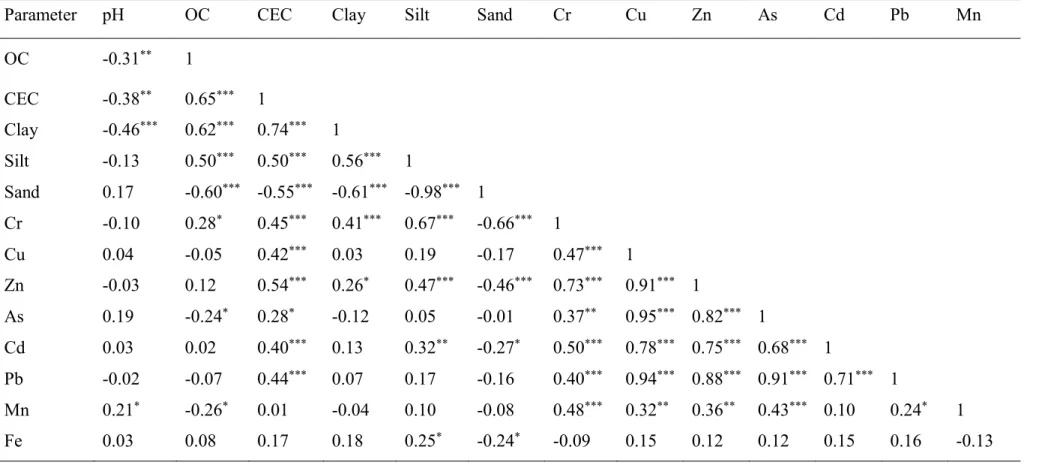
Table 3.2 showed the correlation coefficients for the heavy metal concentrations and soil factors. Positive correlations were observed between CEC, OC, clay and silt content. In contrast, negative correlations were observed between sand content, CEC, silt content and OC content.
Further, CEC was positively correlated with the concentrations of Cr, Cu, Zn, As, Cd, Pb.
The OC was also positively correlated with the Cr concentration. Clay content was positively correlated with the concentrations of Cr and Zn. Moreover, silt content was positively correlated with the concentrations of Cr, Zn and Cd.
On the other hand, positive correlations were observed between the concentrations of Cr, Cu, Zn, As, Cd and Pb. The Mn concentration had positive correlations with the concentrations of heavy metals except Cd, and had a negative correlation with OC. The Fe concentration showed a correlation only with sand content.
Table 3.2. The correlation coefficient between heavy metals and soil factors under different land uses.
Parameter pH OC CEC Clay Silt Sand Cr Cu Zn As Cd Pb Mn
OC -0.31** 1
CEC -0.38** 0.65*** 1
Clay -0.46*** 0.62*** 0.74*** 1
Silt -0.13 0.50*** 0.50*** 0.56*** 1
Sand 0.17 -0.60*** -0.55*** -0.61*** -0.98*** 1
Cr -0.10 0.28* 0.45*** 0.41*** 0.67*** -0.66*** 1
Cu 0.04 -0.05 0.42*** 0.03 0.19 -0.17 0.47*** 1
Zn -0.03 0.12 0.54*** 0.26* 0.47*** -0.46*** 0.73*** 0.91*** 1
As 0.19 -0.24* 0.28* -0.12 0.05 -0.01 0.37** 0.95*** 0.82*** 1
Cd 0.03 0.02 0.40*** 0.13 0.32** -0.27* 0.50*** 0.78*** 0.75*** 0.68*** 1
Pb -0.02 -0.07 0.44*** 0.07 0.17 -0.16 0.40*** 0.94*** 0.88*** 0.91*** 0.71*** 1
Mn 0.21* -0.26* 0.01 -0.04 0.10 -0.08 0.48*** 0.32** 0.36** 0.43*** 0.10 0.24* 1
Fe 0.03 0.08 0.17 0.18 0.25* -0.24* -0.09 0.15 0.12 0.12 0.15 0.16 -0.13
*, ** and *** denote significant correlations at the 0.05, 0.01 and 0.001 levels.
2.5. Principal component analysis of heavy metal concentrations and soil factors
Figure 3.4. The results of the principal component analysis for all heavy metals and soil factors in five land uses.
The results of PCA for all heavy metals, soil factors and soil samples were displayed in Figure 3.4. Figure 3.4a shows the values on the first two components that accounted for 65.2% of overall variability, where components 1 and 2 accounted for 40.8% and 24.3%, respectively. The detailed results of PCA for untransformed data were exhibited in Table S3. From Table S3, eigenvalues of the components 1 and 2 were 5.7 and 3.4, respectively. The loading values of all variables in the first two components were depicted in Figure 3.4b. The loading values of the principal components
content, silt content, OC) also had high loading values in PC1. In contrast, sand content and pH had a negative loading value in PC1. The loading values of all variables on PC2 were divided into negative loading values (CEC, clay, silt and OC, Cr and Fe), and positive loading values (As, Cd, Cu, Pb, Zn and Mn).
(a)-Scree plot for the first 10 components of un-transformed data, (b)-Bar graph of the loading values in the first two principal components of un-transformed data, (c)-The biplot for PC1 and PC2 of un-transformed data, (d)-The biplot for PC1 and PC2 of the centered logratio (crl) transformed data.
Figure 3.4c was plotted based on the coordinates (loading and score values in PC1 and PC2) of 14 parameters and 67 samples extracted from untransformed data. Figure 3.4d showed the similar plot for the clr-transformed data, explaining 62.5% of the variability. The arrow length (loading value of the variables) is proportional to the variability in PC1 and PC2, and the angle between two arrows shows the correlation between the variables. In Figure 3.4c and Figure 3.4d, the variables were divided into two groups. The first group is comprised of Cr concentration, CEC, silt, clay, and OC that was located in the lower right and upper left quadrants in Figure 3.4c and Figure 3.4d, respectively. In contrast, the second group is comprised of Zn, Cd, Cu, Pb and As concentrations, located in both the upper right quadrant of Fig 5c and upper right quadrant of Figure 3.4d. Furthermore, the relationship of the concentrations of Fe and Mn with the heavy metals concentrations was weak.
Figure 3.4c and Figure 3.4d displayed the scores of individuals in PC1 and PC2, where paddy field is composed of the first group variables. However, most of the river bed, mangrove forest and some of the shrimp farm are composed of the second group variables. The sites of R1, R2, R3, M8, M9 and M10 had high scores composed of the second group variables. In contrast, the clam farm is composed of sand content, located in the distinct quadrant with all of the heavy metals.
3. Discussion
3.1. Heavy metal accumulation and the effect of soil factors in relation to it under different land uses
CEC, OC, clay and silt contents correlated with each other (Table 3.2). However, OC, clay and silt particles were strongly affected by the exchange and absorption ability of soil/sediment samples. Further, CEC was correlated with most of the heavy metal concentrations. These results show that soil factors had an important role in retaining heavy metals in soil particles.
In the clam farm, sand was dominant in soil particles (Table 3.1). In addition, OC, clay content, and CEC in the farm were the lowest in all land uses. The clam farm area that is located outside the dyke (Figure 2.1) is affected by the tidal and river water level fluctuations. These fluctuations might work to lower the heavy metal concentrations, where there was an additional effect of the soil’s low adsorbing ability due to low clay content.
In contrast, the shrimp farm located outside the dike has high values of OM and clay content (Table 3.1). As mentioned previously, the shrimp farm is built on the site of a former mangrove forest with mangrove plantations surrounding and inside the farm. These conditions might positively affect the heavy metal concentrations in the shrimp farm.
The river bed and mangrove forest had the highest heavy metal concentrations among all land uses. The mangrove forest retains sediments from the Red River owing to its location (Figure 2.1). Van Santen et al. (Van Santen et al. 2007) showed that retention of the sediment/alluvium materials was nearly 10 times higher in the mangrove forest than in the paddy field in the Red River. Thus, the soils in the mangrove forest have a high potential to retain heavy metals.
3.2. The sources of heavy metals in soils
Based on Figure 3.4c and Figure 3.4d, As, Pb, Cu, Zn and Cd were highly correlated between
themselves and were dominant in the same principal component, which shows that the heavy metals were of anthropogenic origin (Li et al. 2013), and in particular of industrial origin. In contrast, Cr concentration and CEC, clay, silt and OC content, composing another component, were thought to associate with the biogeochemical process. This separation of components shows that Cr is not of anthropogenic but of non-anthropogenic origin.
According to Figure 3.3, most of the heavy metal concentrations, except Cr, were higher in the river bed and mangrove forest than in the paddy field. In addition, these concentrations did not change in the mangrove forest and shrimp farm that was located near to the river bed. These characteristics show that the heavy metals in the Ba-Lat estuary were transported from the upstream part of the Red River.
From the above, we can conclude that the heavy metal accumulation varies with land uses.
The mangrove forest had higher heavy metal concentrations compared to the paddy field and clam farm. This characteristic shows that the mangrove forest retained soils that adsorbed heavy metals, and prevented the soils from flowing out to the clam and shrimp farms. Thus, the mangrove forest was found to have an important role in preventing the heavy metal contamination in the estuary.
4. Conclusions
The following conclusions were derived from this study.
1. The high concentration of As, Pb, Cu, Cd and Zn were observed in the river bed and mangrove forest. Besides, high Cr concentration was observed in the paddy field. In the clam farm, all heavy metal concentrations were low compared to those in other land uses.
2. Soil factors of CEC, OC, clay and silt content were correlated with each other. The concentrations of Cr, Cu, Zn, As, Cd and Pb were also correlated with each other. Mn and Fe showed a weak relationship with heavy metals and soil factors.
3. Correlation analysis and PCA showed that As, Pb, Zn, Cd and Cu concentrations of soils were of anthropogenic origin while Cr concentration was of non-anthropogenic origin.
4. The mangrove forest has an important role in preventing the dispersion of heavy metals from upstream to aquaculture areas and the estuarine environment.
Chapter 4
The Chemical Forms and Distribution of Arsenic and Heavy
Metals in Soil and Sediment Profiles
1. Introduction
Arsenic (As) and heavy metals such as lead (Pb), chromium (Cr), copper (Cu), cadmium (Cd), chromium (Cr) are ubiquitous in the environment and are recognized as highly toxic elements. In recent decades, these elements were the main subjects of water, soil and sediment pollution in many places in the world (Kirby et al., 2002; Nriagu et al., 2007; Whaley-Martin et al., 2017). Even soil and sediment in many estuarine areas in remote location were also contaminated by As and heavy metals (MacFarlane, Pulkownik and Burchett, 2003; Tue et al., 2011).
The pollution of estuarine system is an important issue that could be of considerable impact because estuarine ecosystem area is not only a habitat for aquatic organisms with high biodiversity, but also a reservoir of potential persistent chemicals and toxic metals (Bryan and Langston, 1992;
Nguyen Van et al., 2016). Recently, many authors in the world have reported that the estuarine ecosystem, especially in mangrove forest areas, are threatened by the contaminated effluents from upstream (Usman, Alkredaa, and Al-Wabel 2013; Kirby et al. 2002; Zhou, Guo, and Hao 2007).
Estuarine system can also interact with nearby agricultural lands including the exchange of chemical mass through water and soil movement. From the agricultural lands, the toxic elements can easily migrate into the food chain of human and animals due to the soil-to-plant transfer system (Jaishankar et al. 2014). The bioaccumulation of trace toxic metals in aquatic food chain components in estuarine and coastal areas, such as aquatic plant, zoo plankton, algae, and fishes, has been reported together with the consequent effect (Hamilton 2004; Herreros et al. 2008).
As a developing country, Vietnam is facing the undesired consequence of development, environmental pollution. Very recently, in 2016, the worst environmental disaster happened in the coastal area of Central Vietnam due to the illegal/accidental discharge of toxic wastewater to the coast, causing several billion dollars of damage (The Guardian 2016). Therefore, people and the Government are now well aware of the risk of upstream discharge to the coastal including estuarine areas. In our previous study, we have showed that a large area of Ba-Lat estuary, northern Vietnam
has been facing negative pressure from upstream of the Red river via the sedimentation of toxic metal contaminated alluvial particles at the topsoil layer (Nguyen Van et al., 2016). But details on As and heavy metal accumulation as well as the fractionation of these metals in deeper soil layers in this area has not yet been acquired.
The objectives of this study were to i) understand the distribution and fractionation of As and heavy metals in soil in Ba-Lat estuary; ii) determine the bioavailability of trace toxic metals in soil profiles; and iii) examine the detail characteristic of mineralogy, physicochemical properties of soils. The relationship between these metals and other soil properties also was also assessed.
2. Materials and Methods 2.1. Soil sampling
A total of six soil cores (100 cm) were taken from Ba-Lat estuary, the biggest estuary of the Red river in the North of Vietnam. The Ba-Lat estuary has important ecological role as a major breeding and stopover for migratory birds along the East-Asian and Australian flyways, and as essential habitat for a range of local benthic organisms, vertebrate and other wildlife animals (Tue et al., 2012). Sampling sites included mangrove forest (C5, C6, C7, ND2), paddy fields (T4, T8 and T9) and river bed (R1, R2) as showed in Figure 4.1.
Cores from mangrove forest area were divided into ten layers, each 10 cm. Cores from paddy fields were split into five layers (0-20 cm, 20-40 cm, 40-60 cm, 60-80 cm, 80-100 cm). All soil samples were obtained using stainless steel drill. The soil in outer of each core layer was removed using plastic knife and immediately stored in polyethylene bags.
After collection, the soil samples were dried and sieved through a 2-mm stainless steel sieve.
Samples from each layer were mixed homogeneously and stored in polyethylene bags in room temperature (25 ± 20 C) until analysis.
Figure 4.1. Locations of sampling sites in the Ba-Lat estuary, Red river, Vietnam.
2.2. Analytical methods
2.2.1. Arsenic bioavailability extraction
To assess the level of As bioavailability, one gram of dried soil was placed in 50 mL centrifuge tubes with 25 mL of 0.1 M KH2PO4 solution, and then shaken for 16 hours to extract the mobile As fraction (Cai et al. 2002; Wenzel et al. 2001). After shaking, the tubes were centrifuge for 15 min at 10,000 rpm. The supernatant was taken and filtered through a 0.45 µm cellulose acetate filter (Whatman GD/X filter) in polyethylene bottles.
2.2.2. Sequential extraction for As and heavy metals
A sequential extraction scheme for As was adopted from (Wenzel et al., 2001; Ure et al., 1993), as described in Table 4.1. Briefly, soil sample was extracted using different extractants and extraction conditions, which had a liquid/solid ratio of 25:1 (mL/g). Six As fractions were measured including non-specifically absorbed As (F1), specifically absorbed As (F2), As associated with
amorphous hydrous Al-Fe-Mn oxides (F3), As associated with crystalline iron oxide (F4), and a residual fraction (F5).
The procedure proposed by Tessier et al. (1979) was selected to determine the fractionation of heavy metals in soil and sediment samples. Following this sequential extraction procedure (Table 4.2), five fractions of heavy metals were analyzed including exchangeable fraction (F1), bound to carbonates fraction (F2), bound to Fe-Mn oxides fraction (F3), bound to organic matter fraction (F4) and residual fraction (F5). The procedure was carried out with an initial weight of 1 g of soil/sediment sample. In this study, three heavy metals were adopted to analyze the chemical partitions, including lead (Pb), copper (Cu) and zinc (Zn).
The supernatants from sequential extractions were also filtered through 0.45 µm cellulose acetate syringe filter (Whatman GD/X filter) and then stored in the fredge at 0-40C before analysis.
Table 4.1. The sequential extraction scheme for arsenic in soils
Fraction Extractant Extraction condition Arsenic form Reference
F1 1 M MgCl2
1:8 of soil to solution.
1-h shaking, 250C Exchangeable
(Tessier, Campbell, and Bisson 1979)
F2 1 M CH3COONa 1:8 of soil to solution.
pH =5; 5-h shaking, 250C Bound to carbonate
F3 0.04 M NH2OH.HCl in
24%HOAc
1:20 of soil to solution.
6-h occasional agitation, 960C Bound to Fe-Mn oxides F4 0.02 M HNO3, 30% H2O2
(pH =2)
Final volume: 100 mL.
3-h occasional agitation, 850C Bound to Organic matter
Total Heavy metals HNO3 acid, H2O2 Hot-plate, 1100C Total concentration of heavy metals (USEPA, 1996)
F5 Total As – (F1 + F2 + F3 + F4) Residual
Table 4.2. The sequential extraction scheme for heavy metals in soils
Fraction Extractant Extraction condition Arsenic form Reference
F1 1 M MgCl2
1:8 of soil to solution.
1-h shaking, 250C Exchangeable
Tessier, Campbell, and Bisson 1979
F2 1 M CH3COONa 1:8 of soil to solution.
pH =5; 5-h shaking, 250C Bound to carbonate
F3 0.04 M NH2OH.HCl in
24%HOAc
1:20 of soil to solution.
6-h occasional agitation, 960C Bound to Fe-Mn oxides F4 0.02 M HNO3, 30% H2O2
(pH =2)
Final volume: 100 mL.
3-h occasional agitation, 850C Bound to Organic matter
Total Heavy metals HNO3 acid, H2O2 Hot-plate, 1100C Total concentration of heavy metals USEPA, 1996
F5 Total As – (F1 + F2 + F3 + F4) Residual
2.2.3. ICP-MS, FE-EPMA and XRD analyses
As and heavy metals (Pb, Cr, Cu, Zn, Cd) in the extract solutions obtained from the above procedures were measured using Inductively Coupled Plasma - Mass Spectrometry (ICP-MS, 7500c, Agilent Technologies), installed at Center of Advanced Instrumental Analysis, Kyushu University. Milli-Q water was used to prepare 0.1N HNO3 acid solution and other extractants.
Extract solutions were diluted by 0.1 N HNO3 to fit into the calibration range. All samples were analyzed twice.
In the present study, representative samples of surface soil and sediment in three land uses (river bed, mangrove forest and paddy field) were selected to make thin sections that were used for microscope observation and FE-EPMA analysis. In the first step, individual dried and sieved soil, sediment samples were homogeneously mixed with epoxy resin before configuring in cylinder mount. In order to remove air bubbles inside specimens, the mixtures of sample and resin were kept in vacuum cabinet for 2 hours at 0.05 mPa, then the mixtures were dried at 500C in oven for 24 hours to get solid and dense specimens. The specimens were cut into small slices across the bedding of mounts, then polished thin sections (30 µm in thickness) were made using conventional methods. In the final step, polished thin sections were cleaned well using Milli-Q water in ultrasonic tank after polishing using 6 µm, 3 µm and 1 µm diamond paste, respectively. Before analyzing using EPMA, the thin sections were coated with a very thin carbon layer.
The main mineral species in soils were determined using X-ray diffractometer system (XRD, Rigaku D/Max 2200), installed at Graduate school of Integrated Science for Global Society (ISGS) of Kyushu University, operating at 35 kV and 20 mA with Cu target. The presence of As in soil and sediment particles, and back scattered electron images were analyzed and captured using Field Emission Electron Probe Micro Analyzer (FE-EPMA, JXA-8530F, JEOL), installed at ISGS, Kyushu University. Qualitative of As and other elements in samples were carried out using wavelength dispersive spectrometers (WDS) method with the reference sample was Ga-As
(synthesized Gallium-Arsenide, Astimex), in which the FE-EPMA was operated at 15 kV accelerating voltage and 5x10⁻⁸ nA beam current. In order to obtain the back scattered electron (BSE) images and energy dispersive spectrometers (EDS) analysis (for qualitative chemical analysis), the FE-EPMA was operated at 1 x 10⁻⁸ nA beam current.
2.2.4. Soil properties analysis and total concentration of As and heavy metal
To determine total concentration of As and heavy metals, 0.5 gram of soil was used for digestion using the United States Environmental Protection Agency 3050B method (USEPA, 1996).
The digested solutions were processed as described in the above to obtain the concentration of As, Pb, Cr, Cu, Mn and Fe using ICP-MS system.
The total organic carbon content (TOC) in the soil was measured using the Walkley method (Walkley, Black, 1934). The cation exchange capacity (CEC) of the soil was determined by the ammonium acetate method (SSSA 1996). The content of the soil particle sizes, including clay, silt and sand, was analyzed using the pipette method (SSSA, 1986).
All reagents used in this study were of analytical grade, and double-deionized water (Milli- Q Millipore 18.2 MΩ/cm) was used for all dilutions. All analyses were conducted in duplicate.
2.3. Statistical analysis and data visualization
The data analysis were carried out using R program version 3.3.2 (R Core Team, 2016). One- way ANOVA analysis were performed using Agricolae package (Felipe de Mendiburu 2017) to identify significant differences in trace toxic metals among different layers of soil and sediment cores. The Pearson’s correlation analysis (CA) and principal component analysis (PCA) were conducted using PerformaceAnalytics package (Carl and Peterson 2012) and Fractoextra package (Kassambara 2015), respectively. All results were considered statistically significant at p < 0.05.
3. Results and Discussions
3.1. Soil and sediment characteristics
The main characteristics of each layer of the six soil cores, including total organic carbon (OC), cation exchange capacity (CEC), and Fe, Al, Mn contents are summarized in Table 4.3. OC contents varied among soil layers in six cores, which were in range from 0.21 to 2.05 %. The average organic contents of paddy soil were higher than those in mangrove forest, which might be related to the habit of using organic fertilizers in rice production of famers in this area. The cation exchange capacity (CEC) values also were significantly different among layers of soil cores with the range of 2.7 – 14.1 cMol/kg soil. The lowest values of CEC were recorded in the low layers of most soil cores, especially in depth of 70 – 100 cm in core C7, core ND2 in mangrove forest. In addition, the particle size analysis showed high content of sand accumulates in depth from 70 to 100 cm whereas clay and silt contents in top soil layers were higher than those in deeper layers (Figure 4.2). The differences of soil particle size proportion and OC content strongly affected the CEC of soil layers, which were revealed via the Pearson’s correlation analysis (Figure S1 - Appendix). The correlation coefficients (r value) between clay, silt, OC content and CEC value are 0.77, 0.86 and 0.51 (at p < 0.001), while the negative correlation between sand and CEC is significant with r = -0.86 (at p < 0.001).
The contents of Fe and Al, which are respectively in range from 1.2 - 2.26 % and from 1.93 - 3.81 %, decreased with depth in forest soil cores (Table 4.3). The Mn contents had low variation in all soil layers with average value of 0.11%. The high correlation between clay, silt content, CEC values and Al, Fe, Mn concentrations (Figure S1 - Appendix), suggested that CEC, clay and silt particles in the soils play an important role to retain Fe, Al and Mn through adsorption.
Figure 4.2. The percentage of soil particles (clay, silt and sand) by layers in six soil profiles (continuing)
Figure 4.2. The percentage of soil particles (clay, silt and sand) by layers in six soil profiles (continued)