The Nature of the UK Household Consumption System
Underlying Factors
Prof. Kenji Tokuda
目 次
1 Introduction ··· 2
1.1 An awareness of the problem. ··· 2
1.2 The consumption system. ··· 2
1.3 Consumption is the last economic activity of a household. ··· 3
1.4 The consumer. ··· 4
1.5 Hypotheses to be assessed through Empirical Study and Data Analysis. ·· 6
1.6 Framework for a consumption analysis. ··· 11
2 Demographic factors. ··· 13
2.1 Population ··· 13
2.2 Income class structure ··· 15
2.3 Age income structure ··· 19
2.4 Other conditions ··· 21
3 Economic factors ··· 25
3.1 Stable Economic Growth ··· 25
3.2 Consumer spending ··· 27
3.3 The price of goods and services. ··· 29
3.4 Wages and social benefits. ··· 32
3.5 The economic impact on each generation. ··· 35
3.6 Summary ··· 36
4 Consumer change ··· 38
4.1 Expenditure class structure ··· 38
4.2 Other Scenarios. ··· 39
4.3 Differences in expenditure elasticity. ··· 40
4.4 Similarities and differences in the characteristics between classes. ··· 42
4.5 Older generation verses younger generation. ··· 43
4.6 The role of consumer credit in consumer spending ··· 46
4.7 For retailers ··· 49
5 Retail change ··· 49
5.1 No-frills discounters becoming main-stream retailers. ··· 49
5.2 Marketing changes. ··· 53
6 Conclusion ··· 54
6.1 Interrelationships. ··· 54
6.2 Comparison between the UK and Japan. ··· 56
6.3 Thoughts about consumption and retailing in Japan. ··· 58
編集後記 ··· 67
専修大学社会科学研究所月報
The Monthly Bulletin of the Institute for Social Science
Senshu University
The Nature of the UK Household Consumption System
Underlying Factors
1Prof. Kenji Tokuda
Household consumption represents 60% to 70% of the GDP of a country and is a key factor in the national economy. The nature of consumptions and the factors affecting consumption are a complex system. In this paper, consumption is analyzed as the result of mixture of demographic, economic, household and retail factors. UK household consumption did grown at a slow but steady pace, due to a modest growth and an increase of population. However, more recently, there has been lower growth, higher prices, greater use of credit cards and larger mortgage repayments on housing. Effective prescriptions for these conditions include key policies, such as labor distribution, social security and even some price controls. These results suggest ways to help the current situation in Japan.
Key words: demography, economy, CPI, social class, middle class, purchasing power, consumer behavior, household budget, discounter, retail hierarchy,
1 Introduction
1.1 An awareness of the problem.
Household consumption is a daily purchasing activity with buyers and sellers, exchanging money for goods and services. The sum of those micro activities results in a very large household demand, which affects the size and growth of GDP. For every sector of household business, especially the retail sector and the policy sector, it is difficult to forecast the behavior of consumers. For a household, how do they organize their consumption? For a business, how do they make and plan their marketing and merchandizing? For the policy sector, how do Authorities manage the factors affecting consumption?
The purpose of this paper, is to shed light on the household consumption system, and in particular, why there are fluctuation of consumption and consumer behavior. This study analyzes the similarities and differences in consumption between the UK and Japan, by way of an empirical study and statistical data analysis. Ultimately the goal is to suggest ways for revitalizing Japanese consumer consumption and its stagnant retail sector.
1.2 The consumption system.
Fig 1 Consumption System- Interrelation of Sectors-
Household (consumer) Expenditure Retailer Marketing & Merchandising Market Economy Prices Distribution Added Value GDP Demography Household Number Population Pyramid Consumer Behaviour Benefits Channel Producer Government Tax
Size & Structure
In this paper, consumption is studied as an aspect of economics. It focuses on the relationship between expenditure and income in macroeconomic terms, and the relationship between prices, expenditure and welfare in microeconomic terms2. The
consumption system is a typical cyclical chicken-and-egg issue. Consumption is an output of a household, but simultaneously for retailers it is an input they must respond to in order to make revenue and profit for their business. Some parts of the output is, as an input, distributed into the household sector (Fig1). There are two aspects for household consumption. At a micro level, every household can spend according to their disposable income. At a macro level, the sum of total expenditure is the quantity of consumption. From a different aspect of demography, actual household numbers and the population pyramid age composition, will define the size and nature of total consumption relating to market size and its character. On the other hand, each household's expenditure is restricted by each income level. Also, income levels are restricted by current GDP per capita, tax, benefits and the price of goods.
In the market sector, the price mechanism functions to link household demand to retailer's merchandise, purchased from producers. Retailers will pursue an expected revenue and profit by strategic marketing and merchandizing. Retailers will analyze the nature of consumer behavior in order to decide on actual marketing and merchandizing strategies. Thus, consumption is a chicken and egg activity. It is a cause, but from another angle, it is a result. In analyzing the consumption system, these chicken-and-egg interrelationships must be untangled and clarified into a clear causal dependence.
1.3 Consumption is the last economic activity of a household.
*Adam Smith 'The Wealth of Nations, Book II, Chapter II, p.329, para. 106.'
” Consumption is the sole end and purpose of all production; and the interest of the producer ought to be attended to, only so far as it may be necessary for promoting that of the consumer.”
Consumption is the management of making ends meet between income and the costs for maintaining everyday life. This depends on how much revenue and social benefits a household receives, and how much tax and repayment they pay. Households must consider 4 factors when controlling their household budget, consumption, saving, borrowing and paying tax (Fig2).
Fig 2 Household budget management
To make this clearer, it is helpful to analyze the structure of the household budget through the household income/expenditure formula. Over time and with generation changes, the position of households will change.
(Income-Expenditure)+(Benefits-Tax)+(Deposit-Saving)+(Loan-Repayment)=0
Fig 3 Situation of household budget of changing generations
Income-expenditure + Pension-Tax + Loan-repayment + Withdraw-saving =0
Young small+ small△ 0 0 =0
Middle + △ small △ △ =0
Old △ + 0 + =0
Income-expenditure + Pension-Tax + Loan-repayment + Withdraw-saving =0
Young small consumer small tax payer 0 0 =0
Middle consumer tax payer even saver =0
Old consumer pension receiver 0 withdrawer =0
This formula shows some implications of household behavior (Fig3). An identical equation would be that if (Benefits - Tax), (Deposit Withdrawal - Saving), (Loan - Repayment) are all minus, then (Income - Expenditure) must be plus, with Income>Expenditure. However, an alternative scenario might result in Income < Expenditure, which would indicate that such a household should cut its expenditure in order to correct the imbalance. For example, if a household is suffering from a lower income, with other conditions being equal, it must focus on a reduction of its daily expenditure. As a consumer, the household must cut its spending but may still demand commodities with high quality at a lower price. In consumption theory, there is an Inertia Effect, which means that generally a household will try to maintain their living standard, even when their income decreases.
1.4 The consumer.
Consumers have to live under the current social structure and economic situation. Consumers live through social changes and economic changes. Which class do they
belong to? What occupation have they selected? How much do they receive in wages? How much do they pay in tax and receive as social benefits? How much do they borrow on credit? These depend on the current situation and social system, and any social and economic changes cannot be resisted by themselves.
Consumption is the sum of all consumer behavior.
Total consumption is the aggregate consumer demand which accounts for about 60~ 70% of GDP. Total consumption, is equal to the sum of the purchasing power of every household. In this paper, total household purchasing power will be considered to derive from 3 classes, low, middle and high. The largest and most influential class is middle income class. An analysis of all aspects of these middle class consumers is crucial for retailers.
Consumer behavior will be influenced and changed by changes in the economic and social environments.
Economic trends. The most crucial environment for a household are economic trends, which define the size of their total purchasing power. So, it is important to study changes in economic size and growth rates which will lead to changes in the size of per capita income, and disposable income (Fig 4).
Fig 4 GDP qurterly growth and levels
Source: Office for National Statictics
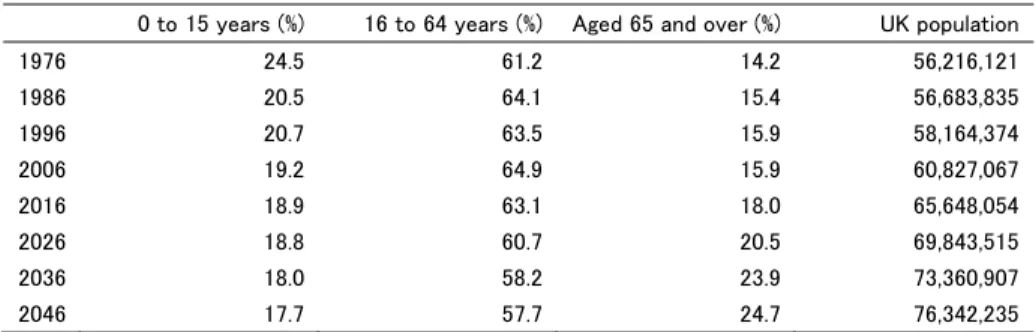
Demographic change. Another crucial factor is the change of population, especially the number of households (Fig5). The total purchasing power is average income ×number of households. A change in the population pyramid will affect the characteristics of each group. Demographic changes will define the structure of total purchasing power, as well as a division into the purchasing power of the different groups.
Fig 5 Age distribution of the UK population, 1976 to 2046 (projected)
0 to 15 years (%) 16 to 64 years (%) Aged 65 and over (%) UK population
1976 24.5 61.2 14.2 56,216,121 1986 20.5 64.1 15.4 56,683,835 1996 20.7 63.5 15.9 58,164,374 2006 19.2 64.9 15.9 60,827,067 2016 18.9 63.1 18.0 65,648,054 2026 18.8 60.7 20.5 69,843,515 2036 18.0 58.2 23.9 73,360,907 2046 17.7 57.7 24.7 76,342,235
Source: Office for National Statistics Notes:
1. Population estimates data are used for 1996 to 2016, while 2014-based population projections are used for 2026 and 2036.
Consumer change. The spending power of different consumer groups, depends on their income level, their age and their home region. Households are grouped by socio-economic class. Income class is divided into low income class, middle income class and high income class. The changes in the number in each group will affect the size and characteristic of consumer expenditure.
Retail change. The retail sector must respond to the changes of the consumers, but any changes in the attitude of the retail sector, could in turn influence the attitude of the consumers. In turn, the retail sector can be divided into low, middle and high category retailers, which may fluctuate in accordance with the level of consumption.
In conclusion consumption, total or by class, would be expected to expand or to decline through changes to these 4 factors.
1.5 Hypotheses to be assessed through Empirical Study and Data Analysis.
57349, 3590 32881, 14200 20313, 9050 58943, 3564 35003, 14755 22455, 8886 31928, 0 33779, 0 0 2000 4000 6000 8000 10000 12000 14000 16000 18000 20000 20000 25000 30000 35000 40000 45000 50000 55000 60000 Ho u se h o ld num be r Income level 2013 2015 2013ave 2015ave influence the consumption situation, especially that of the middle class. However, because of similar living standards, there are many similarities in consumer behavior. The biggest difference in social structure is the existence of large numbers of immigrants into UK society. What does the high immigration into the UK mean in terms of consumption?
Fig 6 Demographic Shift
Fig6 shows the shift of class purchasing power from 2013 to 2015, using household number×average income. The horizontal axis is income level and the vertical axis is household number (000s). The center of the horizontal axis is the average income of each class, low, middle and high. This chart shows that in the UK the total purchasing power of each class, has increased with a small increase of average income and an increase household numbers. The growth of consumption in the consumer market depends on the growth of income and the increase of population. Also, this chart shows that the borderline of each class has increased. In conclusion, the graph shows that the purchasing power of low class and middle class has increased but that of high class has slightly decreased. This may fundamentally affect the situation of each category of retailers, which are often classified according to the classification of income class.
A consumer layered society. It appears that retail shops differ by class. According to Ms. Kate Fox, a social anthropologist, the different classes can be distinguished according to their different shopping patterns3.
“The upper-middle classes buy food in the expensive but high-quality M&S food halls, and will also happily buy M&S underwear and perhaps the occasional plain, basic item, such as a T-shirt, but will not often buy any other clothes there, except perhaps for children The middle-middle classes also buy M&S food, although those on a lower budget would not do their entire weekly shop there. They complain a bit (to each other, not to M&S) about the high prices of M&S food, but tell themselves it is worth it for the quality, and buy their cornflakes and loo paper at Sainsbury’s or Tesco.
The lower-middles and some upwardly mobile lower class workers buy M&S food, but usually only as a special treat: for some, particularly those with young children, an M&S ‘ready-meal’ is an alternative to eating out at a restaurant, something they might have as an indulgence, maybe once a week.”
Formerly, it was thought that this layered structure was influenced by social class. Now social class is virtually identical to economic class, and class is now called socio-economic class. The combination of social class with economic class has a strong effect on the stability of a class structure. The socio-economic class4 structure (Fig 7),
shows income and source of income by socio-economic classification of household.
Fig 7 socio-economic classification of household
In this kind of analysis, micro household-data, including individual occupation and income could be used. However, this information is not available and so an aggregated data set by SEGs (Socio-Economic Groups) is used. This is formulated by the UK Office for National Statistics and includes average income and occupation of each socio-economic group. For the purpose of this study, households in the SEGs of Fig 7 are assigned to one of the classes, low, middle or high.
Low-income class. This class covers SEGs 8, and represents 33% of all households of the UK in 2015. Most of these households are in poorly paid insecure occupations, or retired, but without an occupational pension, although it also includes the unemployed and students. Their average income per year is under £25,000.
Middle-income class. This class is a majority of UK households (54% in 2015), and contains SEGs 2, 3, 4, 5, 6, 7. The occupation of this class are spread widely with lower managerial and professional, intermediate, small employers, lower supervisory, semi-routine and routine jobs. Their average income per year is between £45,000 and £25,000.
High-income class. The occupations of this class are SEG 1, the higher managerial, administrative and professional jobs. They represent 13% of all UK households in 2015, and their average income per year is over £45,000.
In the UK, the job-based wage system is common, and so to increase income, people may change their occupation. This may be a good motivation for the younger generation. The existence of income class categories for households, does lead to the formation of a retail hierarchy (Fig8).
Fig 8 Retail hierarchy
low middle High
discounter Supermarket Depatment store
Aldi Waitrose M&S
Lidl Tesco
Sainsbury
Morrisons
Fig 9 Upgrade of German discounters
Source: Kanter world panel insights report 2017
Interestingly, the retail hierarchy in the UK is changing (Fig9). Discounters, which were formerly categorized as low class retailers, have gained some middle class consumers to become a lower class and middle class retailer. It is useful to understand the change of consumer behavior in relation to a change of economic trends. More consumers now prefer discounters for their price-competitiveness, despite any increase in purchasing power. The background to this change will be analyzed.
Fig 10 Annual Expenditure of Household
Source: Office for National Statistics
The significance of social changes. What is the role of immigrants when considering the UK consumer society? They are generally in low income jobs when they arrive, but by the 2nd and 3rd generation they are in better jobs. Baby-boomers, born in the late 1940s and
1950s, are rapidly become retirement-age, with some moving from middle income class to low income class. However, many will retire with a good pension, and so stay as middle class consumers. In considering the future consumer society, the attitude of Millennials, those born from the year 2000 onwards, could be important. Also, there has been a change in the type and quality of jobs on offer in the UK, so that now there are far more low paid and insecure jobs. These social movements can influence and change the size and characteristic of each class. Even after the shift to another class, consumers tend to retain the character of their former class and be influenced by the character of other people. The way the social movements affect the characteristic of each class will be analyzed.
1.6 Framework for a consumption analysis.
Fig11 shows the framework of this consumption analysis. The analysis involves a study of 4 main factors, demographic factors, economic factors, consumer factors and retail factors. 60% 62% 64% 66% 68% 70% 72% 74% 76% 78% 0.00 5000.00 10000.00 15000.00 20000.00 25000.00 30000.00 35000.00 40000.00 2001/02 2002/03 2003/04 2004/05 2005/06 2006 2007 2008 2009 2010 2011 2012 2013 2014
Demographic factors. How are the income layers formed, and how are they linked to age composition and social class, under current population trends? In particular, what is the household number in each class and what is the average income? This will give the size of each class market. With a change of economic growth, how will the purchasing power of each class change? Is there social mobility, since movements between classes will affect the purchasing power of each group?
Economic factors. This involves the economic fundamentals of economic scale, economic growth rates, income per capita and wages. How do factors change? How do prices change, as measured by the consumer price index? How do changes of those factors affect class purchasing power?
Consumer factors. How does consumer behavior change for each class or each generation, with the change to economic growth? How does consumer expenditure in each class or each generation change, as the economy changes? How does retirement affect the level of consumer expenditure? What happens with the major generations, for example the Baby boomers and the Millennials? What factors affects consumer behavior and how do lifecycle hypotheses affect consumer behavior? Official government household data has to be used in any analysis of consumer behavior, which has its limitations.
Retail factors. According to the change of size or characteristic of each consumer class, how does the retail structure change? In particular, how do the discounters affect the hierarchy and the strategy of traditional supermarkets?
2 Demographic factors.
2.1 Population
Fig 12 Population change, mid-1992 onwards
Source: Office for National Statictics
Fig 13 Population pyramid
Source: Office for National Statistics 2016 ‐100 0 100 200 300 400 500 600 th o u sa n d
2.2 Income class structure
Household consumption is correlated with the level of household disposable income. To calculate the change of purchasing power of each class, the socio-class data for 2013 and 2015 can be used. The purchasing power of each class for 2013 and 2015 is shown in Figs 14, 15, 16.
Fig 14 Income and source of income by socio-economic classification of household Number of households in the population Average annual household income Disposable Gross NS-SEC Group2 000s £ £
high income class Large employers/higher managerial 844 63 007 86 375
Higher professional 13 2 720 55 062 72 296
middle income class Lower managerial and professional 5 123 45 525 58 370
Intermediate 1 819 30 826 37 679
Small employers 2 194 30 947 35 151
Lower supervisory 1 532 34 925 43 044
Semi-routine 2 106 24 915 29 265
Routine 54 1 981 26 907 31 643
low income class Long-term unemployed3 437 16 471 17 132
Students4 505 23 950 27 662
Occupation not stated5 33 7 944 22 689 25 718
27 205 Source: Office for National statictics 2015
Notes:
The graph chart of the above tables, Fig 17, shows the changes quite clearly. The y-axis is aggregate total disposable income, household number×average income, of each class, and the x-axis is average disposable income. This chart shows that the purchasing power and the market size of each class, have increased from 2013 to 2015, which means that the lower class and middle class has become wealthier in terms of average income. Also, the proportion in the middle class has increased, while that of higher class has decreased. So, UK average income levels have increased, as has mean income level (Fig18).
Fig 17 Demographic Shift 2013-2015
Fig 18 Growth of median household income
Source: Office for National Statistics Notes:
1 Indices are calculated relative to 1977 values
2 1994/95 represents the financial year ending 1995, and similarly through to 2014/15, which represents the financial year ending 2015
2.3 Age income structure
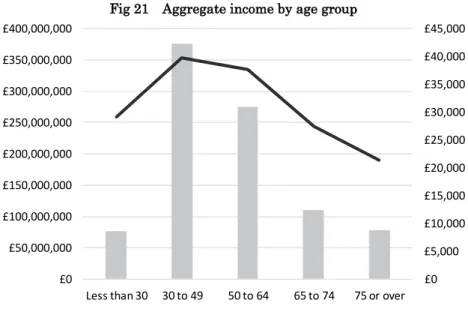
Generally, age income structure will overlap the socio-economic class income structure because of a person’s occupation. Middle class people are mainly working aged people. In general, a household becomes wealthier, the older they become (Fig19). However, when old people retire by 65, some shift from middle class to low class, but those with good pensions retain their middle class income levels. When young students get a job, they may shift from low class to middle class. The average income of middle class, 30~64, of working age and not retired, is higher than that of retired households (Fig 20). However, older people have less necessary spending, with no children and no house mortgage. In general, middle age income levels are about equal to the middle (occupation) class income level (Fig21).
Fig 19 Median net household wealth per adult by age, for people born in different decades
Source: Institute for Fiscal Studies 2016
Fig 20 Median equivalised disposable income 2015 (£ per year)
Source: Office for National Statictics 2015
0 25 30 35 40 45 50 55 60 Me di an ne tho us eho ld w ea lt h pe r ad ul t (£’000 ,2014– 15 pr ic es ) Age
Note: Households containing mor e than one benefit un i t are excluded fr om the sample. Figures are adjusted for inflation using a variant o f the CPI th at includes mortgage interest payments. ’Age’is the average (median)age o f each cohort in a given wave o f data. Excludes Northern Ireland as data are n o t available.
Source:Authors’calculationsusingthe Wealth and AssetsSurvey,variousyears.
Fig 21 Aggregate income by age group
Source: Office for National Statistics
2.4 Other conditions
Type of residential area. From a different angle, there are differences in income by type of residential area. Generally, constrained city-dwellers are low income level and the middle income class are generally suburbanites, urbanites and rural residents (Fig22). All this is related to house prices and house rents.
Fig 22 Gross annual income by region
Source: Office for National Statistics
House renter or house owner. In general, Fig 23 shows that people renting a house belong to the lower income class, and that house owners are wealtier than house renting households(Fig 23). £0 £5,000 £10,000 £15,000 £20,000 £25,000 £30,000 £35,000 £40,000 £45,000 £0 £50,000,000 £100,000,000 £150,000,000 £200,000,000 £250,000,000 £300,000,000 £350,000,000 £400,000,000
Less than 30 30 to 49 50 to 64 65 to 74 75 or over
Fig 23 Tenure of dwelling £
Source: Office for National Statistics 2015
Family type. Fig 24 shows that generally the lowest income group is that of 1 adult without children. The highest income group is 2 adults without children, probably a double-income family. Family type will seriously affect the financial household position.
Fig 24 Household type of income class
Source: Office for National Statistics
3 Inequality. Quintile groups of all households have varied over time5 (Fig 25).
5 “Income quintiles: Households are grouped into quintiles (or fifths) based on their equivalized disposable income. The richest quintile is the 20% of households with the highest equivalized disposable income. Similarly, the poorest quintile is the 20% of households with the lowest equivalized disposable income. “ Office for National Statistics.
0 10 000 20 000 30 000 40 000 50 000 Average Social rented Private rented unfurnished Private rented furnished Rent free Average With mortgage Rental purchase Owned outright Re nt ed O w n er oc cupi ed 0% 10% 20% 30% 40% 50% 60% 70% 80% 90% 100%
Bottom 2nd 3rd 4th 5th 6th 7th 8th 9th Top households
Gini coefficient of original, gross and disposable income (Fig 26), shows that the lower the income class, the higher the cash benefits. The lower income groups have more cash benefits while the higher income groups pay more direct taxes (Fig 27). Through this income transfer, the inequality gap diminished until the 1980s, after which it has increased. Since 2010, Government policy has been to reduce benefits.
Fig 25 Quintile groups of all households ranked by equivalised1 disposable income
Source: Office for National Statistics
Fig 26 Gini coefficient
Source: Office for National Statistics 0.0 10,000.0 20,000.0 30,000.0 40,000.0 50,000.0 60,000.0 70,000.0 19 78 19 80 19 82 19 84 19 86 19 88 19 90 19 92 199 4/ 95 199 6/ 97 199 8/ 99 200 0/ 01 200 2/ 03 200 4/ 05 200 6/ 07 200 8/ 09 201 0/ 11 201 2/ 13 201 4/ 15 Bottom 2nd 3rd 4th Top All Households 0.0 10.0 20.0 30.0 40.0 50.0 60.0 1977 1979 1981 1983 1985 1987 1989 1991 1993 1995/ 96 1997/ 98 1999/ 00 2001/ 02 2003/ 04 2005/ 06 2007/ 08 2009/ 10 2011/ 12 2013/ 14 2015/ 16
Fig 27 the effects of taxes and benefits on ALL households by quintile group1, 2015/16
Source: Office for National Statistics Notes:
1 Households are ranked by equivalised disposable income, using the modified-OECD scale.
2 Tax credits have changed in line with National Accounts, all tax credits have been classified as cash benefits from 2003/04 onwards.
3 These are: Income Tax and Council Tax/Northern Ireland rates (after deducting discounts, Council Tax benefits and rates rebates).
Summary
Fig 28 Interrelations of Class clasification category ‐40000 ‐20000 0 20000 40000 60000 80000 100000
Bottom 2nd 3rd 4th Top All households
Income, taxes and benefits per household (£ per year) Original income
plus cash benefits2 Gross income less direct taxes3 and employees' NIC Disposable income Consumer ↓ Classif ication Socio-economic class
Occupation ←Linkage→ In come
Household Consu mption Total Con sumption
Classif ication
Class Consumption [Average income × Household No]
Low Class Market Middle class Market High class Market Retail
The classification of consumers by socio-economic class, is divided into three groups, low-income, middle-income and high-income class, according to the difference in income level of each occupation. This classification shows the size of each class market. If per capita income is increasing due to economic growth, not only is the size of total household consumption increasing, but also the class consumption of each class is increasing in accordance with the increase of average income levels. This will affect both the consumer behavior, the management of consumer expenditure and the strategy of the retail business sector, marketing and merchandizing (Fig 28).
Class structure is fairly stable, but includes some social movements, like retirement or getting job. From this data, it is clear that there are differences between low income class and middle-income class. Also, the differences of occupations, age, retired or not, type of residential area, house owner or not and family type, affects the income level. The characteristics of the middle class are average income levels of about £35000, age 30~64, intermediate occupation, non-retired, not constrained city-dweller, house owner and with half the households having no children and double-income.
3 Economic factors
3.1 Stable Economic Growth
The most important economic factor is the movement of GDP. In conjunction with the population and productivity, how does per capita GDP change and how is disposable income determined under the income transfer between classes? The level of disposable income is the source of household consumption.
Fig 29 GDP qurterly growth and levels
Source: Office for National Statictics
Fig 30 Growth in disposal income of each class
Fig 31 Growth of GDP per person, disposable income
Source: Office for National Statistics
3.2 Consumer spending
In accordance with the household income level, household consumption has grown (Fig 32). Supported by some real income growth, consumer spending has grown and the propensity to consume has continued to recover since 2010, after the Lehman shock of 2008 (Fig 33, 34). At the same time, the saving ratio of households has continued to fall, while household debt to income has continued to rise. This increase in debt is causing concern to the UK regulatory authorities, and even to international agencies, like the IMF.
Fig 32 Real income growth has supported consumption growth
Source: Inflation Report February 2017 Bank of England 80 100 120 140 160 180 200 220 240 1977 1978 1979 1980 1981 1982 1983 1984 1985 1986 1987 1988 1989 1990 1991 1992 1993 1994 /95 1995 /96 1996 /97 1997 /98 1998 /99 19 99/ 2000 2000 /01 2001 /02 2002 /03 2003 /04 2004 /05 2005 /06 2006 /07 2007 /08 2008 /09 2009 /10 2010 /11 2011 /12 2012 /13 2013 /14 2014 /15 2015 /16
Fig 33 Total national household final consumption annual growth rate %
Source: Office for National Statistics
Fig 34 propensity to consume
Fig 35 Household Saving ratio
Source: Office for National Statistics
3.3 The price of goods and services.
One question to ask is about the way prices have changed, which in turn will affect the real purchasing power of households. In the UK, several price indexes exist, showing a price index for different economic phases.
CPI consumer price index: all items.
CCPI core consumer price index: all items excluding seasonally volatile products such as food and energy.
CPIH consumer price index including a measure of owner occupiers’ housing costs Import prices.
OOH owner occupiers' housing costs.
RPI retail price index: price index on all retail goods.
The CPI, CCPI, CPIH increased by over 2% until 2013, and then fell below 2%, but by 2017, they are back above 2% again. Import prices have gone up rapidly, largely the result of a big devaluation in the pound in 2008 and 2015. Consequently, the price of goods has increased. The growth in prices, especially food inflation, import price rises and the high housing costs, has caused pressure on consumption with the CPI above 2% in 2017. This may cause the consumer to spend earlier, before prices increase in the future (Fig 36, 37, 38, 39). An interesting point is that under such inflationary pressure, the retail price index has gone well below the CPI (Fig 40). This means that the retail sector did not raise retail prices, despite the CPI growth, because of the constraint on household expenditure. The question is why UK households have constrained their expenditure and this will be analyzed later, in an analysis of consumer change.
This mechanism can be set out as follows.
CPI(H) up, at faster speed than income growth → food price up and expect future CPI up → price conscious → RPI < CPI
Inflationary pressure, where households have become conscious of price rises, might lead to households becoming thrifty. Also, this thriftiness may be the result high housing cost pressure, especially for the middle-income class.
Fig 36 CPI CPIH OOH
Source: Office for National Statistics
Fig 37 CPI food Inflation 2015=100
Source: Office for National Statistics ‐3 ‐2 ‐1 0 1 2 3 4 5 6 Jul 2 007 Nov 2 007 Mar 200 8 Jul 2 008 Nov 2 008 Mar 200 9 Jul 2 009 Nov 2 009 Mar 201 0 Jul 2 010 Nov 2 010 Mar 201 1 Jul 2 011 Nov 2 011 Mar 201 2 Jul 2 012 Nov 2 012 Mar 201 3 Jul 2 013 Nov 2 013 Mar 201 4 Jul 2 014 Nov 2 014 Mar 201 5 Jul 2 015 Nov 2 015 Mar 201 6 Jul 2 016 Nov 2 016 Mar 201 7 Jul 2 017 Perc en t
CPIH CPI OOH
Fig 38 Rising import prices have weighed on household real income growth
Source: Inflation Report 2017 Bank of England
Fig 39 CPI inflation is projected to continue to rise
Fig 40 Difference between CPI and RPI rounded 2015=100
Source: Office for National Statistics
3.4 Wages and social benefits.
One source of household income is a wage. Also of importance, is how much wages have increased and this depends on the supply and demand in the labor market (Fig 41). Another source of income is social benefits. It is useful to study how these sources of income have contributed to consumption.
In the UK, labor market, new jobs have been created, but these have tended to be low paid jobs and often part-time jobs (Fig 42). For 6 years after 2008, household purchasing power decreased, and it is only recently that for some workers there has been any pay growth (Fig 43). Labor and benefit income has increased relative to consumption over the past decade6 (Fig 44). In the UK, a job-based pay system is common. The
income level of household depends not on age but on occupation, with higher skilled occupations receiving higher wages. This is very different from the age related seniority system in Japan. With steady economic growth, well-paid jobs might increase and this in turn might affect the improvement of low and middle-class income levels, although this has not happened in the UK.
6 Bank of England, Inflation report 2017
Fig 41 Umemployment rate
Source: Office for National Statistics
Fig 42 Regular pay growth (real)
Source: Office for National Statistics 3.5 4.5 5.5 6.5 7.5 8.5 9.5 Ap r‐ Ju n 201 2 Ju n‐ Au g 2012 Au g‐ Oc t 2012 Oc t‐ De c 201 2 De c‐ Fe b 20 13 Fe b‐ Ap r 20 13 Ap r‐ Ju n 201 3 Ju n‐ Au g 2013 Au g‐ Oc t 2013 Oc t‐ De c 201 3 De c‐ Fe b 20 14 Fe b‐ Ap r 20 14 Ap r‐ Ju n 201 4 Ju n‐ Au g 2014 Au g‐ Oc t 2014 Oc t‐ De c 201 4 De c‐ Fe b 20 15 Fe b‐ Ap r 20 15 Ap r‐ Ju n 201 5 Ju n‐ Au g 2015 Au g‐ Oc t 2015 Oc t‐ De c 201 5 De c‐ Fe b 20 16 Fe b‐ Ap r 20 16 Ap r‐ Ju n 201 6 Ju n‐ Au g 2016 Au g‐ Oc t 2016 Oc t‐ De c 201 6 De c‐ Fe b 20 17 Fe b‐ Ap r 20 17 Ap r‐ Ju n 201 7 %
People Men Women
‐4 ‐3 ‐2 ‐1 0 1 2 3 4 ‐6 ‐4 ‐2 0 2 4 6 20 08 Ap r 08 Ju l 08 Oc t 08 20 09 Ap r 09 Ju l 09 Oc t 09 20 10 Ap r 10 Ju l 10 Oc t 10 20 11 Ap r 11 Ju l 11 Oc t 11 20 12 Ap r 12 Ju l 12 Oc t 12 20 13 Ap r 13 Ju l 13 Oc t 13 20 14 Ap r 14 Ju l 14 Oc t 14 20 15 Ap r 15 Ju l 15 Oc t 15 20 16
Fig 43 Breakdown of growth of Household resources
Source: Office for National Statistics
Fig 44 Labour and benefit income has increased relative to consumption over the past two decades
Sources: ONS and Bank of England
(a) Post-tax labour and benefit income is defined as wages and salaries plus mixed income, plus general government benefits and private pension receipts, minus income tax and National Insurance contributions.
3.5 The economic impact on each generation.
As an economy grows, each generation would expect higher incomes than those born earlier (Fig45). It is a motivation for the younger generations and is strengthened by steady economic growth. However, this is not happening in the UK for the first time in over 100 years. In the past, every generation expected to be better off than their parents but the current young generation are really struggling. There is a generation wealth gap. If this situation is not resolved soon, it will have a detrimental effect on consumption (Fig46).
Fig 45 Median net equivalised household income (after housing costs are deducted) by age, for people born in different decades
Source: Institute for Fiscal Studies
Fig 46 The composition of mean net household wealth per adult by age, for people born in different decades
3.6 Summary
Economic fundamentals. In terms of economic fundamentals, Fig 47 shows the way economic factors influence consumption.
Fig 47 Influence of growth and prices recovery of economic growth
↓
improvement of labor supply and demand ↓
consumer spending higher ↓
CPI growth and consumer price index up Food price inflation
burden of future price growth expectation ↓
prudent way of consuming, price-conscious ↓
RPI < CPI ↓
Thrift under good business conditions
4 Consumer change
The analysis in previous sections of this paper shows that the UK consumer has gained an increased in disposable income. However, under the pressure of CPI growth, UK households might struggle to manage their household budgets in the future (Fig 49).
Fig 49 Household budget management
4.1 Expenditure class structure
This section will examine how current households manage their household budget. As briefly set out in this introduction, the differences of household budgets, class or generation, can be considered by using the household budget formula.
.
(Income-Expenditure)+(Benefits-Tax)+(Deposit-Saving)+(Loan-Repayment)=0
This formula can be used to look at the budget situation of each generation (Fig 50).
Fig 50 Situation of household budget of changing generations
Income-expenditure + Pension-Tax + Loan-repayment + Withdraw-saving =0
Young small+ small△ 0 0 =0
Middle + △ small △ △ =0
Old △ + 0 + =0
Income-expenditure + Pension-Tax + Loan-repayment + Withdraw-saving =0
Young small consumer small tax payer 0 0 =0
Middle consumer tax payer even saver =0
Old consumer pension receiver 0 withdrawer =0
This table suggests certain characteristics for different groups.
The younger generation might appear to be a small consumer and small tax payer, without savings, and living within their own limited income. However, by borrowing heavily, their propensity to consume can be higher than a middle-class household. This young generation use credit cards to increase their consumption, often with little concern about paying back the debt. For example, nearly 50% of young people in the UK enter
higher education, and they leave at age 21 with large debts of £40,000 and more.
The middle class are big consumers who need to manage their budget effectively. Their biggest outlay is on housing, either renting a house or buying a house with a mortgage which is repaid over 25 or 30 years. They use credit cards in order to increase consumption, and they pay more tax because of their higher income. As a result, the middle class focus more on the payment of essential expenditures.
The older retired generation is completely different. They focus on using money from the state pension, a work pension, and any savings. Therefore, their propensity to consume may be higher than that of the middle class on certain goods and services, although, with no children to support and having already purchased most consumer goods, then retail consumption is often about replacement,
The response of each generation to consumption, will depend on their income. If their income increases, then they may have more to spend, but it depends on how prices have changed. If their income decreases, or if prices increase, they need to cut their expenditure. However, what some households do, is to keep the same level of expenditure but borrow on credit cards. Other households choose a selection of goods and services with lower unit price but with the same quality. This puts pressure on retailers to satisfy this demand.
4.2 Other Scenarios.
If there is a tax increase.
Fig 51 Case: Tax invrease e.g.sales
Income-expenditure + Pension-Tax + Loan-repayment + Withdraw-saving =0
Young small+↑ small△↑ 0 0 =0
Middle +↑ △↑ small △ △ =0
Old △↓ +↓ 0 + =0
If there is a rise in interest rates.
Fig 52 Case: Interest rate up
Income-expenditure + Pension-Tax + Loan-repayment + Withdraw-saving =0
Young small+ small△ 0 0 =0
Middle +↑ △ small △↓ △↑ =0
Old △ + 0 + =0
An interest rate rise will affect the loans and savings of households (Fig 52). An interest rate rise will result in an increase in monthly mortgage repayments, which will mean less disposable income to spend on other items. Households may be willing to save more money and may decrease their loans, although households usually repay their loans at regular intervals. Maybe, they will just decrease their expenditure, but past experience of consumers shows that this is less likely.
If there is an increase in prices.
Fig 53 Case: Price up
Income-expenditure + Pension-Tax + Loan-repayment + Withdraw-saving =0
Young small+ small△ 0 0 =0
Middle +↓ △ small △ △ =0
Old △↑ + 0 + =0
This would lead to a similar situation as in tax increase (Fig 53). The generation most affected will be the middle class. They might cut their expenditure, but they are far more likely to find some way of continuing with the same level of expenditure.
4.3 Differences in expenditure elasticity.
In this section, an analysis of the kind of items that will limit expenditure in the UK is undertaken. For this, the expenditure elasticity is calculated, which means the changing rate of the item divided by the changing rate of all items (Fig 54).
Fig 54 Expenditure elasticity fraction △expenditure of some item/ △expenditure of all items
expenditure elasticity table (Fig 56).
Fig 55 2001-2014 Household Expenditure of average household
2001/02 2014
DISPOSABLE INCOME Nat Currency (£) 23230.50 33961.70
FINAL CONSUMPTION EXPENDITURE Nat Currency (£) 17610.40 23984.70
Housing, water, electricity, gas and other fuels Nat Currency (£) 1866.90 3779.10
Electricity, gas and other fuels Nat Currency (£) 609.00 1344.10
Electricity Nat Currency (£) 299.90 626.00
Gas Nat Currency (£) 260.60 627.50
Liquid fuels Nat Currency (£) 33.70 78.10
Solid fuels Nat Currency (£) 14.60 12.50
Food and non-alcoholic beverages Nat Currency (£) 2171.70 3056.10
Alcoholic beverages, tobacco and narcotics Nat Currency (£) 590.90 638.40
Clothing and footwear Nat Currency (£) 1187.50 1233.80
Furnishings, household equipment and routine household maintenance Nat Currency (£) 1583.90 1842.80
Health Nat Currency (£) 233.90 367.70
Transport Nat Currency (£) 3006.50 3890.40
Communication Nat Currency (£) 539.40 803.90
Recreation and culture Nat Currency (£) 2808.20 3578.40
Education Nat Currency (£) 287.90 508.00
Restaurants and hotels Nat Currency (£) 1739.70 2207.80
Miscellaneous goods and services Nat Currency (£) 1594.10 2078.30
Source: Office for National Statistics
As the result of calculating the elasticity is as follows. (Fig 56)
Fig 56 expenditure elasticity 2014/2001
This analysis highlights some interesting information on household budget management.
The elasticity of food expenditure, which is the largest expenditure, is 1.03. This means that in the UK, households always allocate a certain part of their budget for food spending, regardless of income and prices. This shows even with price or tax increases, under a fixed income, households manage to reduce other discretionary or other essential expenditures on behalf of securing their most essential food expenditure. As analyzed in previous sections, food inflation is common and it can be a big pressure for UK consumers. They behave like thrifty consumers.
The elasticity of household related expenditure is often over 1.0. This means that if their income is raised, the incremental part of their income would be allocated to housing related expenditure before other items. This is a burden for the middle income class because even if their income is increased, they could not easily increase other expenditure on such things as recreation to improve their living standard. This might be because the existence of the property ladder, with UK households said to accumulate their wealth by moving to a more expensive property.
Another interesting item is education which is 1.3 and therefore a discretionary expenditure. State education up to age 18 is free in the UK and is used by over 90% of children. There are also private schools where parents pay to send their children. For these parents, who are mainly in the high income class, education is a big factor in their household budget management.
If the economic situation changes, such as a recession, then discretionary expenditures would tend to declined. This movement of discretionally expenditure might create a consumption cycle (Fig 57).
Fig 57 Consumption cycle
4.4 Similarities and differences in the characteristics between classes.
Fig 58 Characteristics of Consumer Behaviour of each class
Thrifty + Value-Oriented
Low Class Market Middle class Market High class Market
Cost/Price conscious Cost/price Value for Money Value conscious
Low income Housing cost burden High income
Education Cost Family support cost Wealth
Low class market
With a limited income, they are forced to constrain their expenditure. There will be some retired people with no occupational pension in this class, who have moved from middle class to low class after retirement. They might try to maintain their living standard by selecting goods and services with an affordable price and good quality. In general, low income class consumers have to be price-conscious and to some extent value-conscious.
Middle class market:
This is the class with big housing costs, family support costs and essential costs like food. The younger generation with a job, might shift from low class to middle class. Basically, this generation is active because of so-called demonstration effect, which means they might have the tendency of imitating existing class behavior. Despite this, they are urged to be thrifty, and price-conscious, and to be value-oriented for the improvement of their standard of living. They will prefer goods and services with both cost-saving and value-creation, something that is often hard to find. This may be called the tendency of looking for “Value for money”.
High class market:
This class can afford expensive expenditure due to high income and wealth. They tend to be value-conscious with the wealth effect.
Overall, UK household behavior is generally thrifty and value-oriented. They spend more money on property, and less money on cultural, recreation expenditure with a fixed proportion of expenditure on food consumption.
4.5 Older generation verses younger generation.
Fig 59 Household income/expenditure structure
(income-expenditure) + (benefits-tax) + (withdrawl-saving)+(loan - repayment) =0
(identical equation) (I+E)+(B-T)+(W-S)+(L-R)=0
A summarized comparison of their household budgets is shown in Fig 60.
Fig 60 Situation of household budget of changing generations
Income-expenditure + Pension-Tax + Loan-repayment + Withdraw-saving =0 debts property assets
Young small+ small△ + 0 =0 ● ×
Middle + △ + △ =0 ● ×
Old △ ++ 0 + =0 - 〇
Income-expenditure + Pension-Tax + Loan-repayment + Withdraw-saving =0 debts property assets Young small consumer small tax payer consumer credit 0 =0 ● ×
Middle consumer tax payer consumer credit saver =0 ● ×
Old consumer pension receiver 0 withdrawer =0 - 〇
The household budgets for these two groups is opposite. The already retired old generation is often relatively rich, with the means to maintain their middle-class position after they have retired. This depends on being in receipt of an occupational pension and being a house owner. Many old people have paid off their mortgage, and own their house. They can maintain their consumption with their pensions and savings. House prices in the UK have increased massively over the last 30 to 40 years, and so retired people who own a house are backed with a good property asset. Many old people in the UK are well off, while many other old people are struggling to cope. In the UK, there is a State Pension of about £6,000 to £7,000 which everyone receives. However, many old people have an Occupational Pension as well and this can be much higher. For example, some occupations had a final salary pension scheme where a person received about half their final salary. The average income for those working is about £23,000, and so many retired pensioner receive more than those working. However, retired old people living just on the state pension and renting a house, are certainly in the poor class category. In the UK, people refer to the White Pound, meaning old people with white hair who have money to spend. Retailers try to tap into this wealth.
Since 2010, GDP has been positive, but wages have not increased very much. All Public Sector workers have had a 6-year 0% increase, and then a maximum of 1% increase each year. It is estimated that Teachers are £5000 per year worse off in 2017 than in 2010. Everyone except those at the very top of the income scale are worse off now than they were in 2010. There are more people working, but nearly all the new jobs are poorly paid. Much of any GDP increase comes from credit.
The young cannot afford to buy a house and it is very expensive to rent. Houses are now about 4 or 5 times an average salary (Fig 61). However, this chart covers all UK regions, and house prices in some regions are much higher, probably nearer 10 times salary. Meanwhile old people live in the houses they own, often the bigger houses and houses that they could not now afford. Old people had very good Pensions, but these are no longer available to the young, as Occupational Pensions have changed for the worse. Many young people in 2017 do not have a pension attached to their job and this would apply to nearly all the new jobs. The young think that the old are ruining their future. This is going to be the first generation of young people who are going to be worse off than their parents and grandparents for well over 100 years.
Fig 61 House prices have risen relative to incomes
Sources: Department for Communities and Local Government, Halifax/Markit, Nationwide, ONS and Bank calculations.
(a) The ratio is calculated using a four quarter moving average of gross disposable income of the UK household and non-profit sector per household as the denominator. Aggregate household disposable income is adjusted for FISIM and changes in pension entitlements. Historical UK household population estimated using annual GB data assuming linear growthin the Northern Ireland household population between available data points.
Fig 62 So gloomy future of current young generation
Income-expenditure + Pension-Tax + Loan-repayment + Withdraw-saving =0 debts property assets current old
generation △ ++ 0 + =0 - 〇
future old
generation △ but small + but small △ + but small =0 ● ×
A comparison of the situation for old retired people now and in the future (Fig 62). It shows a completely different situation. The future old generation will suffer from small pensions, small incomes and small savings, with inadequate property assets. When considering their future, they would envy the situation of the current old generation.
4.6 The role of consumer credit in consumer spending
Consumer spending from credit cards is worth £billions each year in the UK. It is not just credit cards. Purchase of new cars has been very high, but nearly all cars are bought on credit. So much of the GDP increase in the UK is driven by credit which has been growing much faster than household income over the last few years. This means that consumer credit has had a critical role in both household consumption and GDP growth. The post-2014 boom in jobs and growth was tied to a period of over 10% consumer credit growth although this growth rate seems to have levelled off7 (Fig 63).
Fig 63 Consumer credit has been growing much faster than household incomes
Sources: Bank of England, ONS and Bank calculations.
(a) Identified dealership car finance lending by UK monetary financial institutions (MFIs) and other lenders.
(b) Sterling net lending by UK MFIs and other lenders to UK individuals (excluding student loans). Non seasonally adjusted. (c) Percentage change on a year earlier of quarterly nominal disposable household income. Seasonally adjusted. (d) Other is estimated as total consumer credit lending minus dealership car finance and credit card lending.
The role of consumer credit on household budgets is shown in Fig 64.
Fig 64 Situation of household budget of changing generations
Income-expenditure + Pension-Tax + Loan-repayment + Withdraw-saving =0 debts property assets
Young small+ small△ + 0 =0 ● ×
Middle + △ + △ =0 ● ×
Old △ ++ 0 + =0 - 〇
The young and some middle-class households cannot afford to buy a car and durable goods with their income, and yet they are under pressure keep to a household budget. To supplement their inadequate household income, they use consumer credit to maintain or improve their standard of living. Consumer credit has been growing rapidly over recent years and now total debt to total income is 135% in 2016 (Fig 65, 66). Many organizations like the IMF and The World Bank are warning about the problems this could bring to the UK.
Fig 65 Household debt is high relative to income
Sources: ONS and Bank calculations.
(a) Total household debt to income is calculated as gross debt as a percentage of a four-quarter moving sum of disposable income. Includes all liabilities of the household sector except for the unfunded pension liabilities and financial derivatives of the non-profit sector. The household disposable income series is adjusted for financial intermediation services indirectly measured (FISIM). (b) Mortgage debt to income is calculated as total debt secured on dwellings as a percentage of a four-quarter moving sum of disposable income. The household disposable income series is adjusted for FISIM.
(c) Non-mortgage debt to income is the residual of mortgage debt to income subtracted from total debt to income. Fig 66 Household debt and consumption growth over 2007–12(a)
Sources: Flodén (2014) and OECD National Accounts.
Change in consumption is adjusted for the pre-crisis change in total debt, the level of total debt and the current account balance. See Flodén, M (2014), ‘Did household debt matter in the Great Recession?’ available at http://martinfloden.net/files/hhdebt_ supplement_2014.pdf.
Soon, the non-retired generation will not be able to afford to repay this debt. A report by the Bank of England, states that accumulating debts might have an adverse effect on household consumption. For middle-class households, if the use of consumer credit is not restrained, they might have to tighten their household budget under low wage-growth or possibly downgrade their living standard.
4.7 For retailers
Based on all this analysis, there are several implications for retailers. UK consumers tend to be cost-conscious and avoid spending more than is necessary under the burden of housing costs, essential food costs and the pressure of price increases. However, there has been some improvement in their income due to steady, but quite low, economic growth. Cost conscious consumers may prefer the retail categories which reduce extra purchasing costs, such as low price retailers, convenience stores, discount retailers, online shopping and charity shops.
5 Retail change
The framework of retail change is shown in Fig 67.
Fig 67 Framework of Retail Change
New category development
Online, Convenience, Charity, Sharing, Organic
Price war CPI>RPI
Retail Hierarchy Change
Low Class Market Middle class Market High class Market
Online
Discounter offend Super Market Department Store
discount discount & premium Premium
Affordable price movement
5.1 No-frills discounters becoming main-stream retailers.
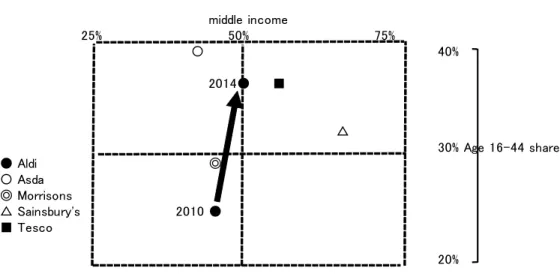
of those discounters, is depriving the traditional supermarkets of their market share (Fig 68).
Fig 68 Upgrade of German discounters
Formerly low-end retailers, the discounters have entered the middle-end market as well as retaining the lower income market (Fig 68). The market share changes are shown in Figs 69, 70. However, although the Discounters have had a large % rise in their sales, they are still small retailers in comparison to the big supermarkets, like Tesco.
Fig 69 Market share change 2015Feb=100 middle income 25% 50% 75% 〇 40% 2014● ■ △ 30% Age 16-44 share ● Aldi ◎ 〇 Asda ◎ Morrisons △ Sainsbury's 2010 ● ■ Tesco 20% 0% 20% 40% 60% 80% 100% 120% 140% 160% Feb 15 Mar 15 Apr 15 May 15 Jun 15 Jul 15 Aug 15 Sep 15 Oct 15 Nov 15 Dec 15 Feb 16 Mar 16 Apr 16 May 16 Jun 16 Jul 16 Aug 16 Sep 16 Oct 16 Nov 16 Dec 16 Jan 17 Feb 17 Mar 17 2016 2017
Fig 70 Grocery Market Share
This type of discounter is a no-frills retailer like Aldi and Lidl, and is defined in the European Grocery Discounters report Nov. 20158.
“The grocery discounters that are the focus of this report, include the big, limited line, no frills, hard discounters, such as Aldi and Lidl, as well as the major soft discounters, such as Penny, whose stores typically stock more brands and more product lines overall”.
“Discounter” is a difficult concept to define. Technically, the retailers covered in this report are not usually discounting the products they sell, but they are simply selling groceries at an everyday low price. They do this by offering a limited choice and focusing on private label ranges, which means they drive large volumes through each product line. This allows them to source in bulk, sometimes from major brand owners, keeping quality levels high and prices low.
8 Fung Business Intelligence Center. Global retail and technology.
0. 5. 10. 15. 20. 25. 30. 35. Jan 15 Feb 15 Mar 15 Apr 15 May 15 Jun 15 Jul 15 Aug 15 Sep 15 Oct 15 Nov 15 Dec 15 Feb 16 Mar 16 Apr 16 May 16 Jun 16 Jul 16 Aug 16 Sep 16 Oct 16 Nov 16 Dec 16 Jan 17 Feb 17 Mar 17
There are several defining characteristics of a grocery discounter.
Limited ranges. Hard discounters have traditionally offered between 600 and 1,000 lines in each store, although this has crept up in some chains. By contrast, there can be as many as 50,000 lines in European hypermarkets and UK supermarkets.
Private label dominance. Hard discounters have traditionally focused almost exclusively on their own brands, although recently, several major players have increased the presence of major brands on their store shelves.
Smaller stores. Limited ranges and limited brand choice typically translate into smaller stores, of around 800 square meters at Aldi and Lidl. Discount hypermarket Kurland, which is not in the UK but is prominent in other parts of Europe, is the major exception to this rule. It is included as a discounter because of its private label focus and discount policies. It shares many common factors with its sister chain, Lidl.
Everyday low price policies. Rather than relying on a high/low promotional policy, as happens in the large supermarkets, discounters have traditionally offered everyday low prices.
A general absence of any frills. Elements such as in store merchandising and services such as online retailing and loyalty programs tend to be minimal.
The main point to be noticed is the price-level. According to the Kantar World Panel Report9.
“Mostly, brands are managing to successfully achieve the correct balance of price. Kantar World panel has found that on average branded goods sold at the discounters are just 5% cheaper than they are elsewhere. One crucial difference in the strategy of the discounters is that, unlike their larger rivals, they very rarely sell products on promotion or discount. When the effect of promotions is considered, it is evident that the average price of a brand at a discounter, could be higher than at other retailers.”
This is very interesting price strategy. Usual prices at discount retailers are about 5% cheaper than at other supermarkets. However, with promotions on at certain times, the average price over a year at supermarkets, could be lower than at the discounters. For price-conscious consumers, the all year lower price is attractive under the strain of the household budget. Therefore discounters can expand their market share, even in the middle market. For existing supermarkets, a defense strategy might be to reduce prices, leading to a fierce price war between discounters and other supermarkets.
5.2 Marketing changes.
The price point may be shifting to a lower position (Fig 71), which means that all retailers will shift their whole price structure to a new level (Fig 72).
Fig 71 Price line downgrade
Fig 72 Downward Price Rigidity
Downward Price Rigidity △conditions CPI Up
esp. Essential expenditure (indispensable) Food price, transport price
+conditions Income Up
Reservation Price (Household Lower vs Retail Higher) *Dependence on Power balance
This is an interesting case. Despite some income increase, under budget constraints, the UK consumers tend to be price-conscious. It means that households will welcome lower prices from the cost-push by retailers, under purchase price pressure. For higher cost retailers, this situation can cause retailers to change their whole strategy, which may lead to a reduction of profits. To avoid this hard situation, retailers must adopt the 4p×4c marketing strategy, from price-oriented marketing to value-oriented marketing (Fig 73).
Fig 73 Marketing Scheme
4P×4C Price → Customer Cost ↓
Transaction Utility Product → Customer Value↑
Place → Customer onvenience ↑ Promotion → Customer Communication↑
An effective marketing strategy is the well-known 4p package, with affordable prices, and products with good value and quality, should be developed and placed in proper
locations in their store, with an effective promotion. This package should result in the improvement of the so-called 4c, with a decrease of customer cost, an increase of customer value, an increase of customer convenience and an increase of customer communication. The improvement of retail output should be realized in the context of value-oriented marketing. In this scheme, online shopping, convenience stores and discounters, with goods of good quality and reasonable price, might gain a better retail position than traditional large retail shops.
6 Conclusion
In this last section, the mechanisms and functions of consumers and retailers can be brought together and ordered. Then the policy implications can be introduced, with a comparison of consumption between the UK and Japan, countries with very different demographic changes, with population increasing in the UK and decreasing in Japan.
6.1 Interrelationships.
The main factors are economic growth, inflation and population change, including immigrants. Changes in these factors will affect nearly all consumers. They may increase the size of the middle class consumer, who may show greater value-oriented behavior than before. Consumers may try to maintain their living standard in real term, avoiding the effect of inflation, by preferring goods of affordable prices. An expansion of the purchasing power of the middle class consumers, is encouraging the entry of other categories of retailers. As these consumers are generally thrifty, discounters with their price-competitiveness are growing.
Major policy factors can be ordered as follows. ・Population-related policies ・entry of immigrants ・aid for family with children ・Economic-related policies ・economic stimulus ・monetary policy
・promotion of major industries ・Labor policies
・re-entry of older generation into labor market ・motivation for younger generation
・wage policy, job-related wage system
A mixtures of these policy factors can directly affect the size and nature of middle-class spending and the structural changes of the retail sector.
6.2 Comparison between the UK and Japan.
Fig 75 Summary of Comparison between UK and Japan
UK Japan
purchasing power up down
middle class expansion decline
CPI higher lower
future CPI high low
immigration low class no
Baby boomer →Low →Low
millennium wealthier poorer
wage up →
wage system job-based seniority
consumer thrift thrift
price-conscious price-conscious
value conscious ?
saving rate down up
debt down ?
charity 〇 ×
retail Aldi, Lidl, online amazon, CVS
discounter ◎ △
online ◎ ◎
convenience △ ◎