論文
Income Distribution and Socio-economic Disparity in
Aging Society in Thailand
Dararatt Anantanasuwong
* AbstractThe paper is focused on the income distribution and socio-economic disparity in aging society in Thailand. Using the household panel data from the Health, Aging, and Retirement in Thailand (HART) Wave 2 (2017) survey, Gini coefficient index and socio-economic disparity are estimated. The results indicate that income distribution situation, Gini coefficient index, is unequally distributed among the young old (aged 60–69) and the mid-old (aged 70–79) and among those by gender, by region and by living area (urban or rural). Besides, disparities in educational attainment by age group, region, and living area exist. The socio-economic disparities imply the limit opportunities for economic security and choice of work for earning income. Policy implication suggests more concrete efforts should be emphasized on regional economic development, especially in the northeast and the south. Policies related to job creation for the young old and the mid old persons such as retirement age extension, reemployment system, skill retraining, and flexible employment system, including long-term care (LTC) system for the oldest old should be focused. Finally, policies to promote ‘healthy aging’ to increase heathy life expectancy of population for longer working life is also crucial.
Keywords
income distribution, socio-economic disparity, aging society, disaggregated data
Introduction
Thailand has been transformed into a society of the aged since 2005 and in 2015 the percentage of old population aged 60+ was 15.6. It is projected that Thailand will become * Correspondence to: Dararatt Anantanasuwong
Director, Center for Aging Society Research, Research Center, National Institute of Development Administration, Bangkok, Thailand
an aged society around 2020 and a super-aged society around 2040. The transformation involves a large increase in the number of the older population aged 60+ from approximately 10.7 million in 2015 to 22.4 million persons in 2040 (UN, 2018). This rapid rate of transformation from an aging society to an aged society in less than 2 decades with the double number of older population, cause urgent concerns for appropriate and timing development policies in order to protect and promote the quality of life of older population and to meet the UN Sustainable Development Goals (SDGs), specifically Goal 3 - Ensure healthy lives and promote well-being of all at all ages by 2030 1 (UN, 2015).
Income equality is an indicator to monitor and evaluate the consequence of economic development in terms of distribution of income among people in the economy. In Thailand the income distribution indicator is normally indicated by Gini coefficients using aggregated cross-section data at the national or macro level. The Gini coefficients are reported by the National Economic and Social Development Board (NESDB) and estimated by using household income earned from all age groups. However, a panel data base from Health, Aging, and Retirement in Thailand (HART) provides an opportunity to explore income distribution among the old aged group using disaggregated data by age, gender, region, and living area.
Thus, this paper is a preliminary attempt to explore the income distribution and socio-economic disparity among the old aged group in Thailand using disaggregated panel data from HART.
The paper is organized into 5 parts: after the introduction in Part 1, the transition into an aging society, income inequality situation in Thailand, and a brief summary of HART and data base to estimate Gini coefficient are presented in Part 2. Part 3 is the results of income distribution from Gini coefficient index, while socio-economic disparities are presented in Part 4, conclusion and policy suggestion in the final part.
Transition into a Society of the Aged
An older person is defined by the UN a person who reaches the age of 60 years and over and 3 groups of older persons are distinguished related to physical health, cognition, and activities of daily living (ADL) into the young-old (aged between 60–69), who are still socially active; the mid-old (aged between 70–79), whose physical and cognitive abilities are declining; and the oldest old (aged from 80+), whose both activities decline. Related to the level of transformation of society, there are 3 levels, i.e., (1) an aging society when more
than 10% of total population in a country are aged from 60+, (2) an aged society when more than 20% of total population aged from 60+, and (3) a super-aged society when more than 30% of total population aged from60+.
The changing structure of population in Thailand under this transformation can be shown in Figure 1. The proportion of the working-age group is in the declining trend from 67 % of total population in 2010 to 64.1% in 2020 and 58.6% in 2030; for that of the youth, there is a similar declining trend from 19.8% to 16.8% and to 14.8% in the respective year. Contrary to that of the old-age group, it is on an increasing trend from 13.2% to 19.1 and to 26.6% during the same period of time. It will be the first time for Thailand that the proportion of the old-age people will be higher than that of the youth around 2018.
Figure 2 shows that in 2015 Thailand, according to the definition by UN, became an aging society, will become an aged society around 2020, and a supper-aged society around 2035. It is of importance to note at the proportion of older population aged 80+, whose health both physical and mental, need special or long term care, will increase from 2.2% of the total population in 2015 to 5.1% in 2035. The number of older population aged 60+ will increase from 10.7 million in 2015 to 20.9 million in 2035 (Figure 3).
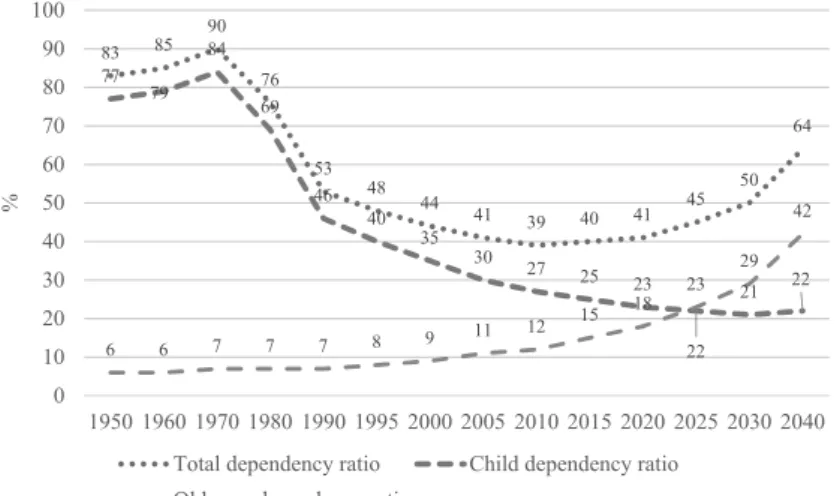
The changing population structure implies the increasing socio-economic dependence of the nonworking age groups on the working age as shown in the changing dependency ratio 2 in Figure 4. In the society of the aged, the old-age dependency ratio, i.e., the ratio of
19.80 16.80 14.80 12.80 67.00 64.10 58.60 55.10 13.20 19.10 26.60 32.10 0.00 10.00 20.00 30.00 40.00 50.00 60.00 70.00 80.00 2010 2020 2030 2040
Youth (0 - 14 yrs) Working-age (15 -59 Yrs) Elderly (60+ Yrs) Figure 1: Youth, Working-age, and Elderly Population during 2010–2040 (in %) Source: Population projections for Thailand 2010–2040 by National Economic and
population aged 65+ over 100 working age population are increasing from 11/100 in 2005 (becoming an aging society), to 18/100 in 2020 (an aged society), and 42/100 in 2040 (a super-aged society). One hundred working age persons will have to support 18 nonworking older people in 2020 and 42 nonworking older people in 2040. Moreover, in the initial assessment of multi-dimension review of Thailand, OECD (2018: 20) states a concern on the aging population and the pervasive informal sector in the Thai economic development
15.6 19.1 22.9 26.8 30.2 32.8 10.6 12.9 16.0 19.4 22.8 25.8 6.9 8.2 10.2 12.8 15.7 18.6 4.2 4.9 6.0 7.5 9.7 12.1 2.2 2.7 3.2 3.9 5.1 6.8 0.9 1.2 1.5 1.8 2.3 3.1 0.3 0.4 0.5 0.7 0.8 1.1 2015 2020 2025 2030 2035 2040 % Year 60+ 65+ 70+ 75+ 80+ 85+ 90+
Figure 2: Percentage of Total Population by Age Group in Thailand, 2015–2040 Source: UN, 2018. World Population Prospects: The 2017 Revision (https://www.un.org/
development/desa/publications/world-population-prospects-the-2017-revision.html) 10,732 13,279 15,988 18,688 20,914 22,404 0 5,000 10,000 15,000 20,000 25,000 2015 2020 2025 2030 2035 2040 in thous ands
Figure 3: Population of Thailand Aged 60+ from 2015–2040
Source: UN, 2018. World Population Prospects: The 2017 Revision (https://www.un.org/ development/desa/publications/world-population-prospects-the-2017-revision.html)
pathways. It suggests better provision and funding of social protection as key given ageing and pervasive informality. The increase in old-age dependency ratio will definitely affect the performance of economic development since there will be less working people to support the nonworking people.
Income distribution of Thailand
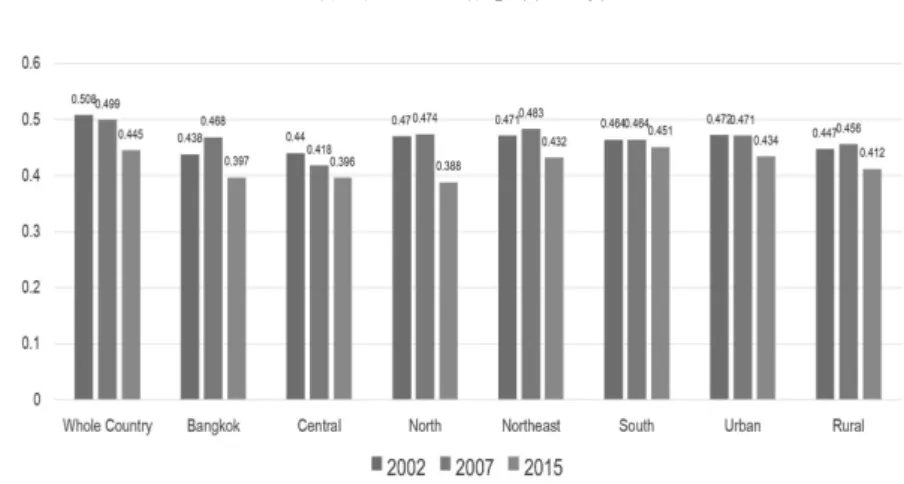
To evaluate the outcome of economic development of a country in terms of income distribution, Gini coefficient index is normally employed as one of the main indicators. In Thailand, following the World Bank’s measurement, the Gini coefficient index is calculated to indicate income distribution status whether it is equally distributed. The Gini coefficient index can be calculated from income (Gini coefficient income Index) and from expenditure (Gini coefficient expenditure Index). The indices range from 0–1. The lower the index, the better the income and expenditure are distributed (http://thaiembassy.se/wp-content/ uploads/pdf.pdf). NESDB calculates Gini coefficient index using aggregated data of the household income. Figure 5 shows that income distribution measured by Gini coefficient income index from 2002 to 2015 for the whole country has been better as Gini coefficient is declining from 0.508 in 2002 to 0.445 in 2015. By region, income distribution in the northeast and the south has not relatively been better than that in other regions. Finally, by living area, income distribution in urban area has been worse than that in rural area.
Gini coefficient index above is calculated from aggregated data of household income as an indicator for the performance of the country’s development. However, when Thailand
83 85 90 76 53 48 44 41 39 40 41 45 50 64 77 79 84 69 46 40 35 30 27 25 23 22 21 22 6 6 7 7 7 8 9 11 12 15 18 23 29 42 0 10 20 30 40 50 60 70 80 90 100 1950 1960 1970 1980 1990 1995 2000 2005 2010 2015 2020 2025 2030 2040 %
Total dependency ratio Child dependency ratio Old -age dependency ratio
Figure 4: Dependecy Ratio 1950–2040
becomes a society of the aged, the income distribution among the older persons or Gini coefficient index using disaggregated data from household survey of the aged is of importance to explore from the availability of the data from the Panel Survey and Study on Health, Aging, and Retirement in Thailand (HART) project.
Disaggregated data from HART Wave 2 (2017) survey
Health, Aging, and Retirement in Thailand (HART) is a household panel survey and study on aging in multi-dimensions. HART is a biannual survey project with the panel of 5,600 household samples representing national households from every region including Bangkok and vicinities, and from 13 provinces. There are 7 dimensions of data collected: demographic characteristics, family and family transfer, health and health care, employment, income, assets and debts, and life expectancy and life satisfaction. One member aged 45+ from each household sample is selected as a respondent. The panel data from HART are currently available from 2 surveys, Wave 1 data in 2015 and Wave 2 in 2017 3.
Relevant demographic characteristics from the HART Wave 2 data to be employed in the analysis is presented in Table 1. The data are disaggregated into 3 age groups: the young old aged between 60–69 years, the mid old aged 70–79 years, and the oldest old aged 80 years and over. The total number of older respondents is 2,739. The proportion of female older respondents is higher than that of male older respondents. The educational attainment of the majority of the older respondents in all age groups is primary level or no education, and only about 1/3 of the young old are employed or working while most of the older respondents are not working.
Figure 5: Gini Coefficient by Region and Living Area, 2002, 2007, 2015 Source: NESDB
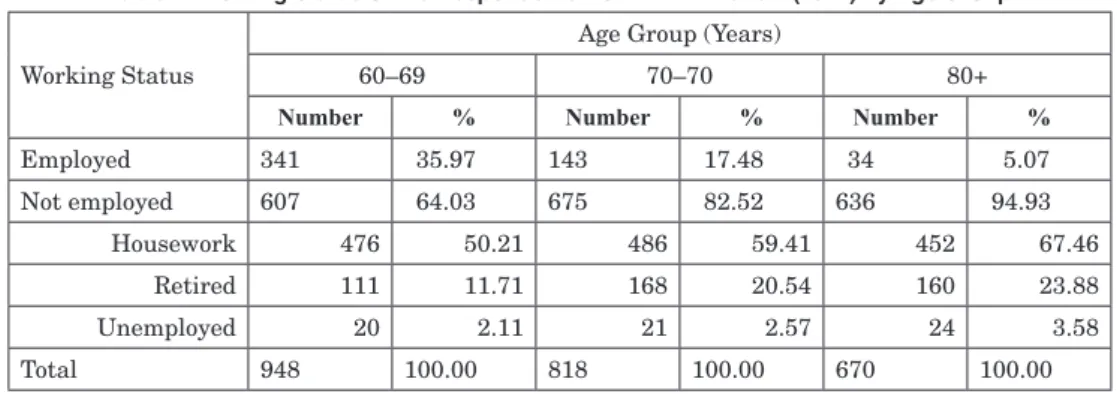
The working status of the older respondents from HART data can be distinguished into (1) working or being employed by employers, in family business, and self-employed, with income earned; and (2) not working from retirement, being unemployed, and doing housework with no income earned. The working status, excluding others working status, is presented in Table 2. From Table 2, among the not working older respondents, majority of them are doing housework (from 50.21% to 67.46%) in their own home doing house chore and taking care of family members without any income payment received. The proportion of the ‘housework’ working status increases according to the increase in age. For retired working status, there are 11.71% of the young old, 20.54% of the mid-old, and 23.88% of the oldest old with no income from employment received. There are about 2% of the young old and 3% of the mid old to 4% of the oldest old being unemployed with no income earned. Thus, only 36% of the young old and 17% of the mid old that work with income earned, and a small proportion of the older aged 80+ (5%) that still work with income earned.
To estimate Gini coefficient index and the socio-economic disparity, the data from Wave 2 (2017) are employed and focused on the income and demographic characteristics of the respondents aged 60+. However, the working status of the older respondents are
Table 1: Basic Demographic Characteristics from HART Wave 2 data in 2017
Demographic Characteristics
Age Group (Years)
60–69 70–79 80+
Number % Number % Number %
Gender Male 487 45.13 426 47.49 337 44.17 Female 592 54.87 471 52.51 426 55.83 Total 1,079 100.00 897 100.00 763 100.00 Education No education 41 3.80 67 7.47 120 15.73 Primary 826 76.55 718 80.04 594 77.85 Secondary 174 16.13 80 8.92 28 3.67 Higher education 29 2.69 22 2.45 11 1.44 Others 9 0.83 10 1.11 10 1.31 Total 1,079 100.00 897 100.00 763 100.00 Working Status Working 341 31.60 143 15.94 34 4.46 Not working 607 56.26 675 75.25 636 83.36 Others 131 12.14 79 8.81 93 12.19 Total 1,079 100.00 897 100.00 763 100.00
working and not working as explained in Table 1, thus, the income earned can come from many sources, e.g. from family transfer, from working, and from welfare or subsidy. Thus, a composited variable for income is derived as followed:
The income variable is composed of 3 types of money received by the respondents aged 60+: (1) the family transfer from child/children, (2) earnings from work and others, and (3) welfare from the government. The relevant set of questions in HART Wave 2 (2017) that define the income variables are the following:
(1) Money transfer from child/children. The transfer from child/children is derived from the set of questions in “Part B - Family and Family Transfers”: In the past 12 months,
how much money did you (and your spouse – if any) receive in total from your child/ children? (All children included)
(2) Income from different sources of work is from a set of questions on earnings in “Part E – Income”: How much did you receive in 2016, before taxes and other deductions?
(i.e., wage and salary; bonus, overtime, tips, or commissions; a professional practice or trade; privately held businesses, farms, rent, dividends or interest)
(3) Welfare from the government, i.e., Old Age Living Allowance (OALA), is provided for every Thai aged from 60 who does not receive any public/private pension 4 or income
from work. The OALA can be considered as a guaranteed minimum income. Thus, any respondent replied the amount of money received from transfer (1) and/or income from different sources (2), in total, less than 7,200 Baht per year, the minimum allowance of 600 Baht per month or 7,200 Baht per year is assigned as welfare.
Thus, the derived income to estimate income distribution in this study is presented in Table 3, showing the number of respondents in total of 2,739 persons (n), mean of income received, standard deviation (S.D.), and the minimum and maximum amount of income received.
Table 2: Working Status of the Respondents from HART Wave 2 (2017) by Age Group
Working Status
Age Group (Years)
60–69 70–70 80+
Number % Number % Number %
Employed 341 35.97 143 17.48 34 5.07 Not employed 607 64.03 675 82.52 636 94.93 Housework 476 50.21 486 59.41 452 67.46 Retired 111 11.71 168 20.54 160 23.88 Unemployed 20 2.11 21 2.57 24 3.58 Total 948 100.00 818 100.00 670 100.00
Table 3: The Derived Income from Family Transfer, Earning, and Old-age Living Allowance by Age Group, Gender, Living Area, Region, and Province. (Unit: Baht)
Age Group (Year) Mean S.D. Min Max Persons (n)
60–69 54,386 96,503 7,200 1,391,200 1,079
70–79 43,606 83,686 8,400 1,013,400 897
>80 33,044 96,647 9,600 2,009,600 763
Total 44,910 92,915 7,200 2,009,600 2,739
Gender Mean S.D. Min Max Persons (n)
Male 52,389 118,278 7,200 2,009,600 1,250
Female 38,633 63,691 7,200 736,400 1,489
Total 44,910 92,915 7,200 2,009,600 2,739
Living Area Mean S.D. Min Max Persons (n)
Urban 44,985 82,796 7,200 1,449,600 994
Rural 44,868 98,237 7,200 2,009,600 1,745
Total 44,910 92,915 7,200 2,009,600 2,739
Region Mean S.D. Min Max Persons (n)
BKK and Vicinities 36,018 60,802 7,200 547,200 435
Regions outside BKK
and vicinities 46,589 97,721 7,200 2,009,600 2,304
Total 44,910 92,915 7,200 2,009,600 2,739
Province Mean S.D. Min Max Persons (n)
Bangkok 30,723 55,793 7,200 377,200 226 Samut Prakan 55,293 81,594 7,200 547,200 79 Nonthaburi 51,967 71,744 7,200 338,400 53 Pathum Thani 20,804 25,686 7,200 140,100 77 Sing Buri 49,274 84,693 7,200 736,400 254 Chanthaburi 64,613 118,276 7,200 907,200 191 Surin 45,485 71,883 7,200 490,200 123 Khon Kaen 60,541 158,191 7,200 2,009,600 322 Chiangmai 53,164 108,220 7,200 1,449,600 373 Uttaradit 27,586 51,498 7,200 348,400 70 Phetchabun 40,963 66,832 7,200 614,400 409 Krabi 12,907 25,465 7,200 316,800 274 Songkhla 53,281 79,470 7,200 1,008,200 288 Total 44,910 92,915 7,200 2,009,600 2,739
Income Distribution in Thai aging society
From the derived income in Table 1, Gini coefficient index is estimated by the aged group, i.e., the young-old (aged 60–69), the mid-old (aged 70–75), and the oldest old (aged 80+). From Figure 6, Gini coefficient for all age groups is 0.62569 indicates income distribution among the older persons in Thailand is considerably unequal. Likewise, those between age groups indicate high income inequality, i.e., Gini coefficient for the young old (=0.63277) is higher than those the mid-old (=0.62667) and the oldest old (=0.55553). Related to gender, Gini coefficient for the older men (=0.65584) is higher than that for the older women (=0.58729). The percentile ratio of the average income of the 10% richest to the 10% poorest is 14.5.
Considering the income distribution among the respondents by region and by living
Figure 6: Gini Coefficient by Aged Group and by Gender Source: Data from HART Wave 2, 2017.
Figure 7: Gini Coefficient by Region and by Living Area Source: Data from HART Wave 2, 2017.
area, Figures 7 shows that the income distribution by region is highly unequal. Gini coefficient is highest in the northeastern region (0.64613), while lowest in the south (0.59334). By living area, Gini coefficient is higher in the urban (0.62675) than in the rural (0.62445)
Among the 13 provinces, income distribution situation is unequally distributed in almost all provinces with Gini coefficients are higher than 0.5, except in 2 provinces – Pathum Thani and Krabi with Gini coefficients of 0.49647 and 0.38141, respectively (Figure 8). Income inequality is relatively highest in Khon Kaen Province (=0.66294), and second by Bangkok (0.62704).
Thus, it can be summarized that income inequality among the older persons and between age groups in Thailand exists, as well as by gender, living area, and region.
Socio-economic Disparity of the Older Persons
Income inequality by Gini coefficient index provides information of disparity in terms of income earned and received. Complementary indicators of socio-economic disparity can reflect the income earning opportunity, especially educational attainment and employment. Low level of educational attainment leads to limit opportunity for economic security and choice of work in the formal and informal sectors 5 as shown in Figures 9 and 10.
Disparity in education attainment and employment
Majority of the respondents in all aged groups attained only primary education (between 77.1%–80.7%) and no formal education (between 3.8% - 15.9%), only between
Figure 8: Gini Coefficients by 13 Provinces, 2017 Source: Data from HART Wave 2, 2017.
1.5%–2.7% attained higher education (Figure 9). 3.80 7.50 15.90 77.10 80.70 78.70 16.20 9.00 3.70 2.70 2.50 1.50 0.00 10.00 20.00 30.00 40.00 50.00 60.00 70.00 80.00 90.00 60 - 69 70 - 79 80+ % Age (years)
No formal education Primary education Secondary or vocational Higher education Figure 9: Education Attainment of the Older Thais by Age Group
Source: Data from HART Wave 2, 2017.
7.17 17.17 24.90 15.49 30.04 28.48 36.76 66.20 62.33 54.26 38.34 18.31 0.00 10.00 20.00 30.00 40.00 50.00 60.00 70.00
No Education Primary Education Secondary Education Higher Education
%
Employed Housework Unemployed/Retired Figure 10: Employment Status of the Older Thais by Education
Source: Data from HART Wave 2, 2017.
21.56 13.09 39.63 23.13 38.74 63.57 0.00 10.00 20.00 30.00 40.00 50.00 60.00 70.00 %
Employed Housework Unemployed/Retired Figure 11 :Employment Status of the Older Thais by Gender
Lower education attainment lead to the limited opportunity for economic security in terms of employment or reemployment, and better earning. Figure 10 shows the employment status of the older Thais by education. High proportion of unemployed (including retired) older persons attained no education or up to secondary education (from 38.34% to 62.33%). Employed status increases according to higher education attainment. However, it is noticeably that the proportion of housework status is quite high in all educational levels (28.48%–66.20%), especially with higher education (66.2%). It implies that most of the older Thais work at home, e.g. taking care of the house or of the family members, rather than work as employees. The higher proportion of older men work as being employed or housework compared to that of older women, while higher proportion of older women is unemployed (including retired). Housework is the main employment status for both older men and women. (Figure 11)
Disparity of employment between urban and rural Areas
Relating to the employment status by living area, Figure 12 indicates approximately the same proportion of the older Thais being employed in the urban and rural areas, i.e. 32.77 % and 33.27%, respectively. For housework, the proportion is higher in urban area (52.56%) than in rural area (46.93%). The proportions of retirement and unemployed are higher in rural area (16.46% and 3.35%, respectively) compared to those in urban area (12.71% and 1.97%, respectively).
Disparity of employment by region
Northeast region is the lowest pool of employment of the older Thais as shown in Figure 13 with the proportion of employed of 25.62% compared to other regions. However,
32.77 33.27 52.56 46.93 12.71 16.46 1.97 3.35 0.00 10.00 20.00 30.00 40.00 50.00 60.00 Urban Rural %
Employed Housework Retired Unemployed
Figure 12: Employment Status of the Older Thais by Living Area Source: Data from HART Wave 2, 2017.
the proportion of housework is relatively highest (67.14%). Bangkok and vicinities is the largest pool of employment of the older Thais, followed by Central (36.96%), North (33.83%), and South (31.59%). For housework, the proportions among regions, excluding Northeast, varies between 37.60%–62.03%.
Considering retirement, however, in Bangkok and vicinities, the proportion for retirement is the highest (23.23%), followed by the North (20.35%) and the Central (15.20%); while those in the Northeast and the South are only 4.06% and 3.11%, respectively. For unemployment, In the South the proportion is the highest (3.27%), followed by the Northeast 3.18%, Bangkok and vicinities 2.56%, the Central 1.88, and the North 1.77%.
Conclusion and Policy Suggestion
Gini coefficient index to evaluate the income distribution in aging society in Thailand is an experimental initiation using HART Wave 2 (2017) data. The results indicate that income distribution among the older respondents in all age groups is not satisfactorily distributed, especially the young old and the mid old who still keep their working status to earn income. The distribution of income indicates the highest Gini coefficient index in the Northeast region.
Socio-economic disparity reflects the low education attainment of the older respondents that hinders their opportunity to continue being employed to earn income. The disparity figures show that more than 60% of the older respondents are not working or being employed. However, a large proportion of them do the housework in keeping the household chore and taking care of family member(s). This implies that they still are active and productive but no income earned or received.
33.83 36.96 25.62 31.59 36.61 44.05 45.97 67.14 62.03 37.60 20.35 15.20 4.06 3.11 23.23 1.77 1.88 3.18 3.27 2.56 0.00 10.00 20.00 30.00 40.00 50.00 60.00 70.00 80.00
North Central Northeast South Bangkok & Vicinity
%
Employed Housework Retired Unemployed Figure 13: Employment by Region Source: Data from HART Wave 2, 2017.
It is of importance to reconsider the performance of economic development in an aging society the contribution of the older persons both from their continuing employment and their productive services in the household (i.e., housework) with no economic value attached. Thus, to improve the income distribution for Thailand, the regional development to provide job/employment for the older persons should be focused in the Northeast before other regions and the human resource development of the young old, both men and women. The employment opportunity for the young old can be increased by a life-long education system that can upgrade their skills and by the flexible working system in terms of time and environment so that the older persons can continue to work and to earn income.
Specifically, job creation policy for the older persons can be related to the extension of retirement age, reemployment system, skill retraining, and flexible employment system. The flexible employment system in terms of time and working place can provide better chances and choices for the older persons who want to work and ease the constraints faced by the family members who do not have to leave the job to take care of their frail parents.
For the mid-old and the oldest old age groups, specific policy should be focus on the long-term care (LTC) related to management and standards for the institutional care and the family care. This can help creating job or employment for the young old and the mid old as care givers, especially for the older women.
Finally, the policy to promote ‘healthy aging’ in order to increase heathy life expectancy of population to be able to work longer is also crucial.
Notes
1 A means to monitor whether a country has met the SDGs, UN encourages the member countries to provide evidence-base data, which is high-quality, accessible, timely, reliable and disaggregated by income, sex, age, race, ethnicity, migration status, disability and geographic location and other characteristics relevant in national contexts (UN, 2015). 2 Dependency ratio is dependents of a population divided by the number of working age
people. Dependents are defined as those aged 0–15 and those aged 65+. Working people are those aged 15–64. Thus, the ratio indicates the number of people of nonworking age, compared with the number of those of working age.
3 The data are accessible by registration (http://rc-demo.nida.ac.th/casr/)
4 It is a progressive living allowance, with 600 baht paid monthly to those aged 60–69, 700 baht to those 70–79, 800 baht to those 80–89 and 1,000 baht to those 90 and older.
labor protection laws and regulations, e.g. self-employment, family employment, employment in agriculture.
References
“Facts on the Situation of Inequality in Thailand”. Retrieved from http://thaiembassy.se/wp-content/uploads/pdf.pdf
OECD (2018). Multi-dimensional Review of Thailand, Volume 1. Initial Assessment. OECD Development Pathways. Paris. http://dx.doi.org/10.1787/9789264293311-en
United Nations (UN). 2015. Transforming Our World: The 2013 Agenda for Sustainable Development. https://sustainabledevelopment.un.org/content/documents/21252030%20 Agenda%20for%20Sustainable%20Development%20web.pdf
United Nations (UN). 2018. World Population Prospects: The 2017 Revision. https://www.un.org/ development/desa/publications/world-population-prospects-the-2017-revision.html