i
Master’s Thesis
Impacts of Higher Education Enrollment on Economic Growth in
Uganda
by Nanyanzi Lilian
51218005
Supervisor Prof. Otsuka Kozo
March 2020
Master’s Thesis Presented To Ritsumeikan Asia Pacific University In Partial Fulfillment of the Requirements for the Degree of Master of International Cooperation Policy
Specializing in Development Economics
ii
TABLE OF CONTENTS
Impacts of Higher Education Enrollment on Economic Growth in ... i
Table of Contents ... ii List of Tables ... iv List of Figures ... iv List of Appendices ... iv List of Equations ... iv DECLARATION OF ORIGINALITY ... v ACKNOWLEDGEMENT ... vi ABSTRACT ... vii
List of Acronyms and Abbreviations. ... viii
CHAPTER 1: INTRODUCTION ... 1
1.1: Background of the Study ... 2
1.2: Uganda’s Education System ... 2
1.3: Challenges Facing Higher Education in Uganda. ... 3
1.4: Research Problem ... 5
1.5: Research Questions ... 6
1.6: Research Objectives and Hypothesis ... 6
1.7: Limitations ... 7
1.9: Outline of the Study ... 8
CHAPTER 2: LITERATURE REVIEW ... 9
2.1: Economic Growth Theory ... 9
2.2: Determinants of Economic Growth ... 10
2.3: Theoretical Review on Human Capital and Economic Growth ... 10
2.4: Empirical Review ... 14
2.5: Negative Relationship between Education and Economic Growth ... 16
CHAPTER 3: METHODOLOGY ... 18
3.1: Research Design ... 18
3.2: Data ... 19
3.3: Model ... 20
CHAPTER 4: ANALYSIS ... 22
4.1: Time Series Analysis ... 22
4.1.1: Time Series Unit Root Test. ... 23
4.1.2: Johansen Co-integration Test ... 24
iii
4.2: Panel Analysis ... 25
4.2. 2: Panel Co-integration ... 27
4.2.3: Panel Fully Modified Least Square (FMOLS). ... 28
4.2.4 Fixed Effects Model and Random Effects Model ... 29
4.2.5: Hausaman Test ... 31
CHAPTER 5: DISCUSSION AND SUMMARY OF ANALYSIS ... 31
5.1: Brain Drain ... 33
5.1.1: Effects of Brain Drain. ... 38
CHAPTER 6: CONCLUSION AND POLICY RECOMMENDATION ... 42
6.1: Conclusion ... 42
6.2: Policy Recommendations ... 42
6.3: Further Research ... 44
REFERENCES: ... 46
iv
LIST OF TABLES
Table 1: Enrollment Rates and Student-Teacher Ratio. ... 5
Table 2: Time Series Descriptive Statistics ... 22
Table 3: Time Series Unit Root Test ... 23
Table 4: Co-integration Test ... 24
Table 5: Results of Ordinary Least Square ... 25
Table 6: Descriptive Statistics of Panel Data ... 26
Table 7: Panel Unit Root Test ... 26
Table 8: Levin Lin and Chu Panel Unit Root Test ... 27
Table 9: Panel Co-integration ... 27
Table 10: Results of Panel Fully Modified Least Square ... 28
Table 11: Fixed Effects Model and Random Effects Model ... 29
Table 12: Results of Hausaman Test ... 31
Table 13: Number of Ugandans who migrated for Further Studies abroad ... 36
Table 14: Population of Ugandans Employed in Foreign Countries in 2013 ... 38
LIST OF FIGURES
Figure 1: Showing Higher Education Enrollment Rates in Uganda. ... 4Figure 2: Showing the GDP of Uganda. ... 19
Figure 3: A Graph Showing the Level of Education of Remitters to Uganda. ... 37
Figure 4: Showing Response of Medical Students about Migration ... 40
Figure 5: Showing the Percentage of Remittance Inflow to GDP of Uganda. ... 41
LIST OF APPENDICES
Appendix 1: The Fixed Effects Model ... 52Appendix 2: The Random Effects Model ... 53
Appendix 3: Definition of Terms……...………53
LIST OF EQUATIONS
Equation 1: Cobb Douglas function... 20v
DECLARATION OF ORIGINALITY
I, Nanyanzi Lilian (Student ID 51218005) hereby declare that the contents of this master’s Thesis are original and true and have not been submitted at any other University or Educational institution for the award of degree or diploma. All the information derived from other published or un-published sources have been cited and acknowledged appropriately.
Nanyanzi Lilian
vi
ACKNOWLEDGEMENT
I would like to express my sincere gratitude to everyone for the support and role they played in my journey. It has been a journey full of loopholes but with God’s grace, I have made it. I give praise and honor to God Almighty.
Secondly, I thank my loving family for the boundless love, support and care. I will always be grateful. My brother Kayiira Geoffrey, I am so proud of you. I can’t thank you enough for the financial and emotional support you have provided in this journey. My best friend and mother Navvuga Annet, no words can express my love for you. My Dear daughter Shantel has always been my inspiration. I love you family.
My highest gratitude goes to my supervisor Otsuka Kozo Sensei. Thank you, for the guidance, support and knowledge, it has been an honor to work with you. My sincere appreciation also goes to the Development Economics department of Ritsumeikan Asia Pacific University.
I would like to extend my utmost appreciation to all my senpai’s, mainly Andrew Isaac Ssonko-san. Thank you so much Andrew for the support, patience and knowledge. You have been a great pillar in my journey. My sincere appreciation goes to Donna Nunez, Kingsley Chukwemeuka and all friends who have always been there for me.
Lastly, I am grateful to Ritsumeikan Asia Pacific University and JASSO for the scholarship, for your support and for believing in me.
vii
ABSTRACT
This study aims at investigating the relationship between higher education enrollment and economic growth in Uganda by using GDP as a proxy for economic growth and higher education enrollment as a proxy for Human capital, for both time series and panel analysis of the five East African countries. The Co-integration and Ordinary Least Square method are applicable for time series estimation and a Panel Fully Modified Least Square (FMOLS) estimation for panel analysis. The findings show a negative and insignificant long-term relationship between higher education and GDP with a co-efficient of 0.085, which means that a 1% increase in higher education enrollment decreases GDP by 8.5%. The study also finds that Gross Fixed Capital formation and Population have a significant long-term relationship with the GDP, by having coefficients of 0.41 and 0.90 respectively.
Key words: Brain Drain, Economic Growth, Higher education enrollment, Human Capital.
viii
List of Acronyms and Abbreviations.
ADF Augmented Dickey Fuller
ARDL Auto Regressive Distributive Lag
COMESA Common Market for Eastern and Southern Africa Enroll Higher Education Enrollment
FMOLS Fully Modified Least Square GDP Gross Domestic Product GFK Gross Fixed Capital Formation
OECD Organization for Economic Co-operation and Development
OLS Ordinary Least Square
Popn Population
TFP Total Factor Productivity VAR Vector Auto Regression
1
CHAPTER 1: INTRODUCTION
New growth theory claims that education and human capital are crucial variables to promote economic growth. Lucas (1988), cites that human capital is the fundamental aspect of production, and education is an essential factor of human capital formation. Development in education of labor has a significant role in the country’s economic development, and hence makes it more globally competitive. Countries with good quality education and high enrollment rates like Japan and Germany are achieving rapid development compared to those with low education rate (Greiner, 2002). Spalleti (2014) acknowledges Adam Smith’s wealth of nations 1776 paper as an excellent study of human capital and economic growth, which accentuated a “division of labor” and a “law of capital accumulation.” He contends that the basis of economic growth is a result of the division of labor, free trade, physical capital, and technological evolvement. However, technological development is possible only with the training of labor through higher education, which is also essential in labor specialization. The study links education and economic growth development process. Over the years, various theoretical and empirical studies have been conducted on the relationship between education, human capital, and economic growth. Though most of the literature shows a positive impact of education and human capital on economic growth, some studies show that education investment has no significant impact on the economic growth except for a diminishing return. After all, Education must be complemented by other aspects like family support (Hanushek & Kim, 1995).
The importance of human capital has been empirically examined by a number of studies. Most studies use higher education enrollment rates as a measure of human capital
2
and GDP for economic growth. Nevertheless, the empirical result between higher education and economic growth are mixed, most studies find that higher education positively affects economic growth while some studies find that the relationship between higher education and economic growth is weak and insignificant. Some Scholars also argue that there is no causal relationship between education and economic growth. This study aims at inspecting the relationship between higher education enrollment and economic growth.
1.1: Background of the Study
Uganda is investing in education through different aspects like the establishment of a universal Primary and Secondary Education. Vocational institutes and Universities are culminating to reduce the literacy rate and consequently, the amount of skilled laborers.
To increase higher education enrollment, Uganda gives out grants and scholarships to exceptional students who are excellent in academics, sports, music, dance, and drama.
In Uganda, no study has yet shown a link between higher education enrollment and economic growth. There are multiple variables that contribute to human capital development, and the data that can be used to measure this against economic growth.
1.2: Uganda’s Education System
Uganda’s education system has a structure of seven years of Primary Education, six years of Secondary Education, and three to five years of a University or Higher
3
Education which in total, is about 13-18 years of Education, or possibly more. Most Ugandans go through Primary and Secondary Education. However, few continue their Tertiary studies due to poverty and early marriages. The Higher Education sector faces several challenges ranging from human and physical capital constraints such as there being few qualified Professors to the low pay and lack of facilitation processes available to said Professors. Thus, these conditions coupled with a lower pay, pushes the professional Professors to instead migrate to developed countries (Kajubi 1992). Higher Education also suffers from low Government funding, to which most of this is instead invested in other sectors like the Military. In 2014, 2.21% of the total GDP was allocated to the Education sector. These challenges call for a serious concern on the Education outcomes because they lead to the production of ‘half-baked’ graduates.
In 1992, Higher Education shifted from the Public sector to a co-habitation model of there being both Private and Public, to which this increased the number of Universities expecting an increase in student enrollment to higher education and human capital development studies. Currently, there are more than twenty Universities in Uganda. Major Public Universities include Makerere University, Kyambogo University, and Mbarara University. Leading Private Universities include Nkumba University, Kampala International University, and Uganda Christian University, among others.
1.3: Challenges Facing Higher Education in Uganda.
Uganda, like all other African countries, has been facing several constraints in the Higher Education sector. The challenges are mainly classified into physical and human capital constraints, inadequate research, and poor-quality Education. Africa has not fully managed to provide suitable quality Primary and Secondary Education nor the required
4
skills at the tertiary level for the Global job market, Goliber (1985). The quality of Education is a contributing factor to there being an insignificant relationship between Higher education enrollment and economic growth.
Secondly, due to an increase in the population, there has also been a gradual rise in the enrollment rate into Universities, which has led to traffic congestions. The Student- Teacher ratio is high, which makes it difficult for the Professors to manage the larger classes (Drape, Rudd, Lopez, & Radford, 2016). In 2000, the Student-Teacher ratio was 16.58 which increased to 31.45 by 2009 (World Bank, 2019). Another challenge is the issue of there being few qualified Professors, which is due to the low salary and poor working conditions. Other challenges that the Universities face are external funding, lack of resources, and lack of research within private Universities (Jegede, 2012). Due to funds, most research is left mid-way because it is too expensive and spans a long period of time. The poor working conditions and low wages for those employed at such Universities has caused there to be an un-sustainable high turnover rate among faculty members. The research in process is lost in the transition (Drape et. al., 2016).
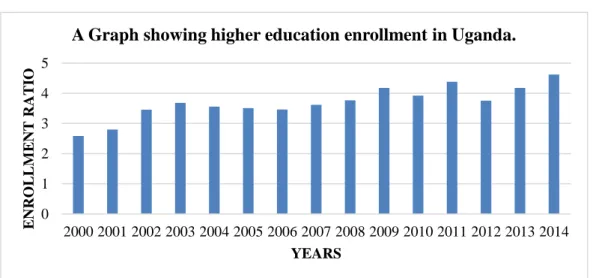
Figure 1: Showing Higher Education Enrollment Rates in Uganda.
Source: author (World Development Indicators)
0 1 2 3 4 5 2000 2001 2002 2003 2004 2005 2006 2007 2008 2009 2010 2011 2012 2013 2014 E NRO L L M E NT RATI O YEARS
5
Table 1: Enrollment Rates and Student-Teacher Ratio.
Years Gross Higher Education enrollment ratio Student-Professor ratio 2000 2.64734 16.587 2001 2.86875 15.407 2002 3.55137 22.917 2003 3.79638 24.930
Sources: Data from World Bank website and table by the researcher.
1.4: Research Problem
There is a prerequisite to examine the contribution of the higher education sector of Uganda, in order to suggest appropriate interventions to improve outcomes from the sector.
The research is vital for the improvement of human capital to access the millennium goal of sustainable economic growth.
Uganda’s GDP in 2016 was 25.89 Billion USD, with 2.64 % of the resources allocated to Education and Sports as the proportion to the national budget as Education investment. The Government has increased the rate of students enrolled with Government sponsorship to boost Education levels, but still, the total rate of School enrollment increase was very minimal in comparison with the investment. Uganda’s budget theme for 2016 was “strengthening Uganda’s competitiveness for sustainable wealth creation, employment and inclusive growth’’( Uganda Debt Network, 2016). And this has not been much different in the past few decades because human capital is still a big challenge in
6
the country where a lot of funds are spent on the importation of experts to work in different sectors like mining and road construction. Through enlightening the quality of Education, the attainment of human capital is achievable hence economic growth. The Ministry of Education and Sports has a strategic plan of retraining unemployed graduates to equip them with the skills required for the existing job market.
Whereas Education investments have been increasing significantly over the past decades, economic growth has not measured up. Some commentators have attributed the sluggish growth to inadequate skills, work attitude and ethics, and an absence of innovativeness. On the other hand, the increased investment was ideally or theoretically intended to translate into improved productivity, resulting in a higher output. In contrast, investments in Education are playing their part in the growth agenda, although, there could also be other factors influencing the sluggish growth. This calls for a thorough investigation into the effect of Education investments and enrollments on economic growth.
1.5: Research Questions
The following questions will be answered to achieve the aim of the research:
1. Does higher education enrollment contribute to an increase in Uganda’s economy? 2. What is the magnitude of the contribution?
1.6: Research Objectives and Hypothesis
This paper aims to expand on the existing studies of the relationship between human capital development and economic growth by analyzing Higher Education
7
enrollment as a factor. The study will be conducted in Uganda to analyze the link between Uganda’s Education on human capital development and growth.
This paper proposes the hypothesis that Higher Education enrollment positively affects economic growth in the long run.
1.7: Limitations
Most of the African countries have so many gaps in the data (World Bank, 2019), mainly in the earlier years, due to political instabilities and fewer funds allocated to research. This research focuses on Higher Education enrollment. However, most of the countries have no data for some periods because of the political instabilities and less investment in research which may also affect results and estimation.
The study of the effect of Education on growth is prey to the endogeneity in Education investment. There is a difference in population growth in different areas within the same country. Some parents might invest more in education than what the state captures. So, we have to assume that education investment is taking place only at the national level. There is no data on individual investment in education, so this research relies heavily on proxies like School enrollment.
Furthermore, an additional academic qualification may not increase the individual’s productivity. Education would have been measurable on innovations, and increased research of a country, but such data is not available in the country. The available data does not consider the informal training as a great attribute to human capital like cultural background, family support, and ties.
8
It is also cumbersome to eliminate the effects of migration and globalization. The existence of technology transfer, which impacts growth and failure to isolate these effects, poses a threat to estimates. Therefore, due to the assumptions and limitations, the expected paper will use GDP, higher education enrollment, population, and gross fixed capital formation to assess the magnitude of education enrollment on economic growth.
1.9: Outline of the Study
This thesis is divided into six parts. The first part, Chapter 1, is the introductory chapter, which discusses the background of the study, the research hypothesis and objectives, and the significance of the study. Chapter 2 reviews related literature on higher education and economic growth and is further subdivided into three parts. The first is theoretical, the second is empirical studies which show a positive relationship between higher education and economic growth. Thirdly, a focus on the studies which reveal a negative relationship between higher education and economic growth. Chapter 3 highlights the research methodology that this paper follows and describes the research design, research site, data sources, and instruments used to accomplish this study. Chapter 4 reports on the data analysis, estimation, and findings of the study. Chapter 5 reports discussions and the summary of the study. Chapter 6 concludes and summarizes the study as well as providing policy recommendations and future research routes on higher education and economic growth.
9
CHAPTER 2: LITERATURE REVIEW
2.1: Economic Growth Theory
There are currently two significant aspects of economic growth: the neoclassical, formalized by Solow (1956), which highlights “the importance of capital accumulation,” and, the endogenous growth theory, that was initiated by Romer (1986, 1990) and Lucas (1988), which draws attention to human capital and innovation.
The neoclassical growth theory assumes exogenous technological change, constant returns to substitutability between capital and labor, and diminishing marginal productivity of capital. The theory claims that an increase in capital-to-labor ratio is the critical foundation of economic growth. Secondly, when an economy reaches a steady state, there is much more capital is invested, however, there is no economic growth unless new innovations in technology are invented with the use of fewer resources. Thirdly, less developed economies would rapidly nurture than the advanced economies for the same amount of capital injected into that economy.
On the other hand, endogenous growth theory hypothesizes that the introduction of new accumulation factors such as knowledge and innovation, will induce self-sustained economic growth that will lead to divergent growth patterns. What is critical in these models is constant or increasing returns to capital caused by the endogenous character of production technology. Endogenous growth models show that accumulated growth is determined by the amount of fixed investment by private, profit-motivated firms, and individuals. Therefore, Governments can affect growth through investment in machines, skills, and technology. Taxation on capital and labor can deter investments and growth in the same manner. Several studies have taken the augmented Solow model as
10
the baseline empirical growth model. It comprises four determinants of economic growth; initial income, rates of human and physical capital accumulation, and population growth (Enrique, 2009).
2.2: Determinants of Economic Growth
Both the neoclassical and endogenous growth theories have identified some determinants which are similar. Several models have proposed numerous essential factors. The leading sources of growth in the theory have been investment, human capital development, foreign direct investment as a source of technological transfer, research and development and innovation, the strength of institutions, openness to trade, macro-economic soundness, macro-economic policies, social-cultural and political factors, demographics and geographical factors.
2.3: Theoretical Review on Human Capital and Economic Growth
Various studies acknowledge the role of education on the economic growth of a country, and many theories show a positive relationship. The development of a country is attributed to human capital and its investment in education. Lucas (1967), expounded an endogenous growth model which explained human capital as one of the significant factors of economic growth having a positive impact on labor productivity.
Human capital can be termed as “the knowledge, skills, and competence of an individual or group in the production of goods and services” (OECD, 2001). The skills attained comprise of communication, motivation, leadership, teamwork, problem-solving,
11
ethical values, reading, learning, writing, and the flexibility of an individual. Human capital is a determinant of education, training, and effectiveness to production. A person’s level of education affects one’s efficiency in the manufacturing and invention of goods and amenities in a market economy; the higher the level of education, the higher the wages (Becker, 1962).
Better qualifications and an upsurge in the level of education attracts a higher wage (Aghion et al., 2001). Krueger and Lindahl (2001) studied that an increase in a year of school, increases average earnings by 10% in the United States. Barro (2001) studied the impacts of education as a benchmark of human capital and discovered that economic growth has a positive relationship with starting levels of average years of school. The study measured the effect of various features on advancement in GDP by using cross-country regressions and incorporating different variables.
Skill formation is a continuing process from early childhood (Cunha & Heckman 2007; Hanushek 2016). Education is a continuing process, where the skills attained during earlier years of school are more essential in skill development. A child’s Intelligence Quotient (IQ) is also considered as a skill that develops over time. The study was conducted on children of different ages from different backgrounds and family status using a complete market model. The results showed that adult human capital development is an increment of early childhood investment which leads to the production of future skilled people
Williams (1967) claims that education has impact on a country both on a social and economic basis. The benefits of a better education include not only higher wages but also a reduced crime rate in the society, which in turn, spurs economic growth. Educated
12
people give respect to national values, are aware of the laws governing the country, are disciplined and able to advance understanding of their responsibilities and are also socially accountable towards their nation’s development.
Spence (1973), argues that in “job market signaling” employers are likely to hire people with higher education qualifications because of the expectations that they are more skilled. These employers are more likely to be prepared to give them higher wages. In this theory, employers hire individuals based on expectations and beliefs that highly educated people are more highly skilled, which will increase productivity than employees with lower qualifications. This theory assumes that all other costs involved in hiring are equal in the market for both lower and higher educated employees.
Hanushek (2016), argues that there is no verified measure of quality education so enrollment in higher institutions may have less effect on economic growth, mainly in developing countries. The more development in different skills, the higher the productivity levels, hence higher economic growth. The difference in the development of developed OECD countries as compared to the less developed is greatly due to the difference in the cognitive skills and the quality of education but all of them have similar policies (Hanushek & Woessmann 2011).
Educated people are quick at learning and understanding new technology and innovations (Nelson & Phelps, 1966). The more advanced the level of education, the more their ability to understand, memorize, and decode the technological change at a higher speed. The capital and technological diffusion models were conducted to prove the increase in technological change, and practice this as a result of higher education levels and innovation. Scientists and top managers need to possess a higher level of
13
education to improve technology and take risks in new product formation while yielding more profits to endorse economic growth.Mincer (1995) claims that education is a way that people influence investments in economy, because people of higher education levels invest more than less educated people.
Investment in physical capital raises the stock of human capital, if the household values education and countries produce high levels of output in the long run. Research has been conducted on the relationship between physical and human capital by formulating a growth model with externalities of investment and education (Halls & Jones 1999; Greiner, 2002). Greiner (2002) studies two countries, Japan and Germany, because the World Wars had heavily devastated them. They had lost almost all the physical capital but still had enough human capital. The study proves that they were able to develop because both physical and human capital are requisite for economic growth. Countries that invest more in physical capital and human capital have higher economic levels of growth, supported by the social institution, as well as Government policies that attract investment and promote education, compared to their counter-parts.
Quality education has a substantial effect on economic growth, but enrollment rates do not. A country with good quality education can quickly develop due to having experts and skilled labor. Fuller et al. (1986), used an institutional model of school expansion and analysis on Mexico, using the data of 1888-1990 and found out that quality education improves the manufacturing and commercial agriculture industry in urban sectors, but not in villages. Hanushek and Kimiko (2000) also contended that there is “an outstanding increase in productivity and national growth rates due to the quality of education.” It seems that the effects of education on economic growth depend on the quality of education, rather than the quantity.
14
Education plays a crucial role in the development of a country (Schultz, 1961) and is also important in the formation of human capital. It was a vital factor affecting the farmer’s income. Well-educated people have a strong influence on the positive effect of human capital, prosperity, and growth of a country. “Education enhances earnings at the private level, decreasing poverty, empowering people, encouraging health and flexibility in environment and developing competitiveness in economy” (Shah, 2011).
2.4: Empirical Review
Mariana (2015) and Awan et al. (2011) examined different country levels of education, and the results showed that people with a medium level of education are most affected by unemployment while those with higher education are more secure. The education levels and the number of years in school are positively related with the levels of wages and employment rate. Countrieswith high scientific and technological human capital have an increase in economic growth than their counter parts. An investment in a higher level of education is a long-time profitable venture to an individual and the economy. There are many benefits of investing in higher education ranging from a high wage to promotions and a variety of opportunities, which reduces poverty in the country. Appiah and Mcmahon (2002), find that education positively affects income growth directly and indirectly through reduced crime rate, improved health, investment in physical capital and political stability hence economic growth.
Winters (2011) used the ordinary least square method to examine the impact of the local capital level and the presence of higher education institutions on the quality of life of residents of 289 metropolitan areas. The local human capital level was measured
15
by the rate of adults with a college degree, the benefits of the higher education institutions measured by the rate of enrollment, and the quality of life measured by the housing prices. The empirical findings showed a positive impact of higher education institutions on the quality of life; hence, higher education investment is significant to individuals and the local society. Gaule (2016), also examined why Korea developed more than India. The findings indicate that though both countries attained independence in the same year, Korea put more emphasis on the quality and increase of higher education enrollment than India which developed the country faster. (Gyimah-Brempong et al., 2006) conducted a study on 34 African countries and the results showed that higher education has a relatively large and significant impact on the GDP per capital growth rates. The higher education elasticity growth rates are 0.09, which is three times higher than growth rates of physical capital investment.
The growth of the impacts of higher education depends on the quality of the education, specialization of labor, and the productivity of skilled labor in the market (Pissarides, 2000). Holmes (2013), conducted a study on the effect of the expansion of higher education on economic growth in OECD countries, both the less developed and developed countries. The results showed no significant relationship between higher education and economic growth but a positive relation between technical skills and economic growth. The level of schooling, quality, and skills attained at higher education are essential factors on the magnitude of economic growth. Training people to become skilled labors is one of the major forms of Human capital. Higher education which generates technology hastens economic and social development (Yogish, 2006) of a country.
16
Kyophilavong et al. (2018) found a positive relationship between all levels of education and economic growth in Laos. Education granger causes economic growth, which means lagged values of education affect GDP. Gemmell (1996) also claimed that “the determinants of economic growth are both human capital and growth rates. The total labor is taken as a proxy of physical capital. Labor force participation rate is the number of people employed, unemployed, and those seeking jobs or work as a proportion of the specified population.” Education is a vital aspect that has a major contribution in the economic development of labor-intensive countries.
According to research conducted by Ergen (1999), an annual increase in average years of formal education of the labor force in Turkey leads to an increase of 0.21 in the growth rate of GDP. Lau et al., (1993) claims that in Brazil an additional year of education of the workforce, increases the real output level by approximately 20% and 40% of the current GDP. The increment is accredited to Human capital development.
2.5: Negative Relationship between Education and Economic Growth
Contrary to winters (2011) and Gaule (2016), Dahl (2013) applied the Autoregressive Distributed Lag (ARDL) method of cointegration on a time series data from 1975-2011 in examining the effect of higher education on Total Factor Productivity (TFP) in Nepal. The findings show no impact of higher education on TFP meaning that higher education does not contribute to an individual’s efficiency nor economic growth. The study recommended the promotion of export trade because it has a positive impact on economic growth.
17
Klenow & Bil (2000), on a research on the impact of schooling on growth in human capita, employed a model of schooling and growth with finite lived individuals, growth rate from 1960-1990 of more than 50 countries to estimate the impact of schooling on growth of human capital at different ages. The results prove a weak causal relationship from enrollment to economic growth.
There is no association between the growth in education and growth of output per worker. Pritchett (1997), used Barro-Lee’s (1993) education data in the analysis and their findings showed that physical capital per worker has a positive and large impact on the growth rate of output per worker while the coefficient for educational capital’s contribution to the growth rate of output per worker was negative and not statistically different from zero. However, Krueger & Lindahl (2001) did not agree with the reliability of Pritchett's findings. Krueger and Lindahl advocate that Pritchett's results cannot be reliable as the findings included a measurement error in education attainment.
18
CHAPTER 3: METHODOLOGY
3.1: Research Design
This study will focus on the enrollment rates of higher education and economic growth using the econometric technique. The hypotheses will be tested using secondary data from the World Bank and Common Market for Eastern and Southern Africa (COMESA). This research will conduct both time series and panel analysis by estimating co-integration and using panel fully modified least square model to examine the long run relationship for panel analysis. The model in this thesis is similar to the one used by Yardigmcioglu, Gurdal and Altundemir; (2014) and by Bouhajeb, Mefteh and Ammar, (2018). These studies conducted a panel analysis on education and economic growth in OECD countries.
In this thesis, a time series analysis and a panel analysis will be conducted. In addition to the time series analysis with Uganda data, the panel data, five East African countries were selected; Uganda, Kenya, Tanzania, Rwanda and Burundi. These countries will be considered due to the similarity of the history of development, as well as similar education policies, specifically, enrollment rates. Their economic growth rates are similar, and the data used was obtained from the World Bank website and COMESA websites.
This study will focus on higher education enrollment rates, because it has been considered, due to its availability over a long horizon and the fact that many studies have used it as a proxy for human development, to translate into improved labor productivity, which leads to a higher labor output. Higher education is an essential aspect for African
19
countries to increase on the human capital development, to thus enhance economic growth.
Education affects growth through its contribution on raising innovation, hence technologies and improvement in productivity and efficiency are difficult margins to observe in reality.
3.2: Data
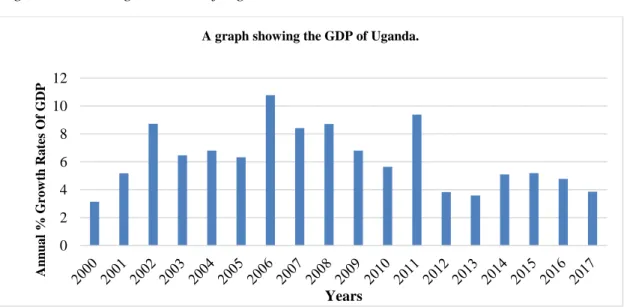
Uganda is an East African country which is still developing with a population of 42.7 million (World Bank). The GDP of Uganda has been gradually increasing ever since the attainment of political stability. GDP growth was estimated at 3.14% in 2000, which had increased to 5.18% in 2015. “The fiscal deficit widened to an estimated 4.7% in 2018, driven largely by ongoing public infrastructure investments supported by borrowing, which was attributed to both external and domestic distress. Inflation fell to an estimated 3.2% in 2018, due mainly to lesser food inflation and prudent monetary policy” (African Economic Outlook, 2018).
Figure 2: Showing the GDP of Uganda.
Sources: Data from World Bank and Graphic Design by the Researcher
0 2 4 6 8 10 12 An n u a l % G ro w th Ra te s O f G DP Years
20
Data for GDP, higher education enrollment, population and gross fixed capital formation for the five East African countries was collected from the World Bank website. These countries include; Uganda, Rwanda, Kenya, Tanzania and Burundi. And they selected because they are in the same region of Africa, and have the similar levels of development, enrollment rates and history of development.
3.3: Model
In order to investigate the impacts of higher education enrollment on economic growth, both time series model and a panel model have been estimated. In both
estimations, GDP is the dependent variable and higher education enrollment is the independent variable. GDP has been used as a proxy for economic growth and tertiary enrollment rates as a proxy for human capital to examine the relationship.
This study follows the Cobb Douglas function and the equation for our model is;
Equation 1: Cobb Douglas function
ln(GDP) = 𝛼 + 𝛽1ln(𝐾) + 𝛽2ln(𝐿) + 𝛽3𝑙𝑛(𝐻)
Where,
Capital (K) is formulated from gross fixed capital formation, Labor (L) is proxy by population,
Human Capital (H) is measured by enrollment rate at tertiary level.
For both time series data and panel data, unit root tests and Co-integration tests were conducted to check the unit root test.
21
Augmented Dickey Fuller (ADF) and Levin Lin Chu (LL) test were applied. Most macro-economic variables are non-stationary at level, so tests will be conducted on level and first-differenced data. A co-integration test is estimated to check the presence of the long run term relationship using Kao and combined ADF Fisher test.
For a panel data, in addition to fixed effects model and Random effects model, a Panel Fully Modified Least Square (FMOLS) is estimated. For time series data, a simple OLS is applied.
22
CHAPTER 4: ANALYSIS
Secondary data from the World Bank website is used to examine the relationship between higher education enrollment and economic growth in Uganda using GDP as a proxy for Economic Growth and higher education enrollment as a proxy for human capital.
4.1: Time Series Analysis
EViews software was used for the estimation on the data from 1980-2018 of Uganda. First, the unit root tests were conducted on all variables at level and first difference. Then, a co-integration test was conducted to test the existence of a long run relationship. Once a co-integration relationship was confirmed, the model described in the previous section was estimated using Ordinary Least Square (OLS).
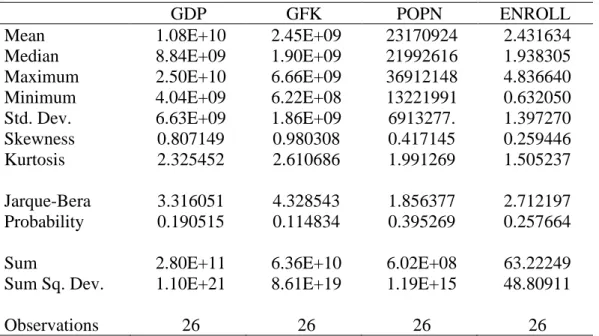
Table 2: Time Series Descriptive Statistics
GDP GFK POPN ENROLL
Mean 1.08E+10 2.45E+09 23170924 2.431634 Median 8.84E+09 1.90E+09 21992616 1.938305 Maximum 2.50E+10 6.66E+09 36912148 4.836640 Minimum 4.04E+09 6.22E+08 13221991 0.632050 Std. Dev. 6.63E+09 1.86E+09 6913277. 1.397270 Skewness 0.807149 0.980308 0.417145 0.259446 Kurtosis 2.325452 2.610686 1.991269 1.505237 Jarque-Bera 3.316051 4.328543 1.856377 2.712197 Probability 0.190515 0.114834 0.395269 0.257664 Sum 2.80E+11 6.36E+10 6.02E+08 63.22249 Sum Sq. Dev. 1.10E+21 8.61E+19 1.19E+15 48.80911
23
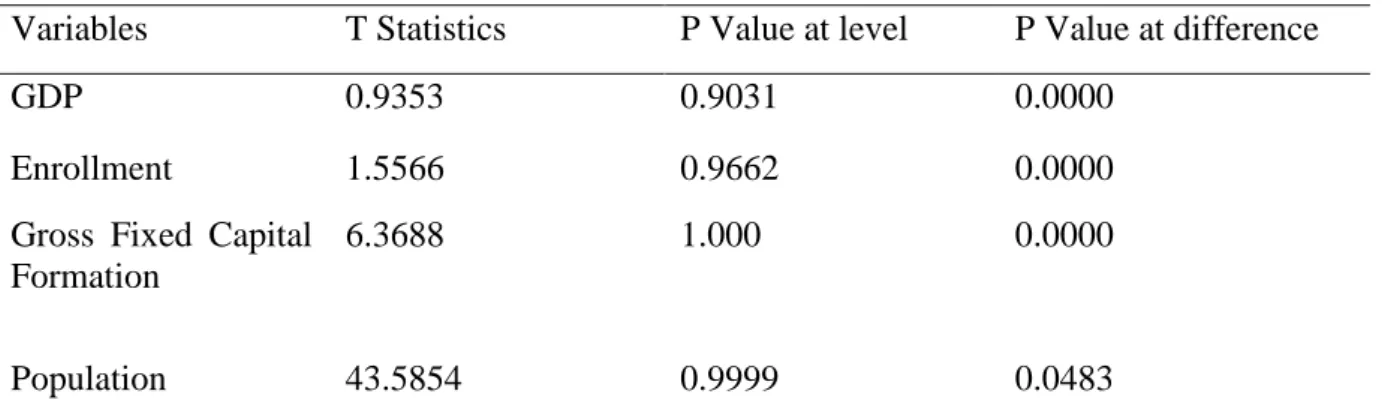
4.1.1: Time Series Unit Root Test. Table 3: Time Series Unit Root Test
Variables T Statistics P Value at level P Value at difference
GDP 0.9353 0.9031 0.0000
Enrollment 1.5566 0.9662 0.0000
Gross Fixed Capital Formation
6.3688 1.000 0.0000
Population 43.5854 0.9999 0.0483
Source: The Researcher’s estimations.
A Phillips Peron unit root and ADF test were conducted on all variables and then results indicated that all variables have unit root at level and no unit root when difference is taken. The unit root test shows that that the variables are I (1).
24
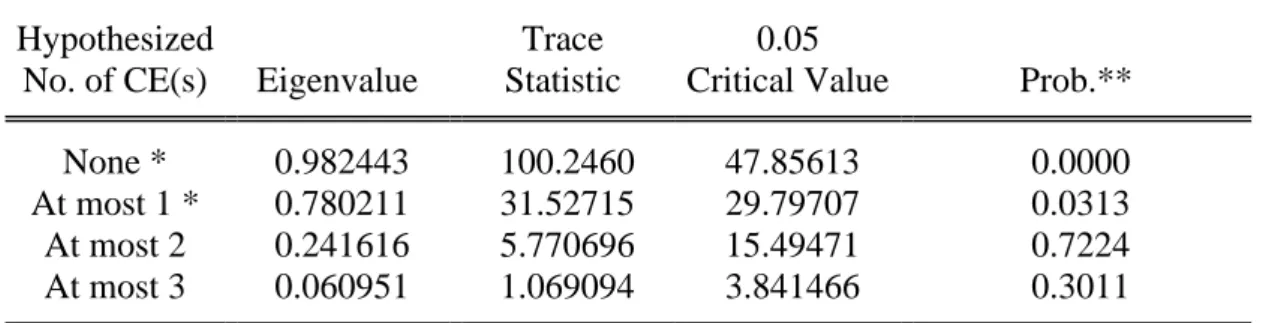
4.1.2: Johansen Co-integration Test
Table 4: Co-integration Test
Unrestricted Cointegration Rank Test (Trace)
Hypothesized Trace 0.05
No. of CE(s) Eigenvalue Statistic Critical Value Prob.** None * 0.982443 100.2460 47.85613 0.0000 At most 1 * 0.780211 31.52715 29.79707 0.0313 At most 2 0.241616 5.770696 15.49471 0.7224 At most 3 0.060951 1.069094 3.841466 0.3011 Trace test indicates 2 co-integrating equation(s) at the 0.05 level
* denotes rejection of the hypothesis at the 0.05 level **MacKinnon-Haug-Michelis (1999) p-values
Unrestricted Co-integration Rank Test (Maximum Eigenvalue) Hypothesized Max-Eigen 0.05
No. of CE(s) Eigenvalue Statistic Critical Value Prob.** None * 0.982443 68.71880 27.58434 0.0000 At most 1 * 0.780211 25.75645 21.13162 0.0104 At most 2 0.241616 4.701602 14.26460 0.7789 At most 3 0.060951 1.069094 3.841466 0.3011 Source: The Researcher’s estimations.
According to the results in table 4 above, we reject the null hypothesis of no co-integration, and we accept the alternate hypothesis of one co-integrating equation. The results indicate we have at most one co-integrating equation, so we can proceed with estimating the OLS.
25
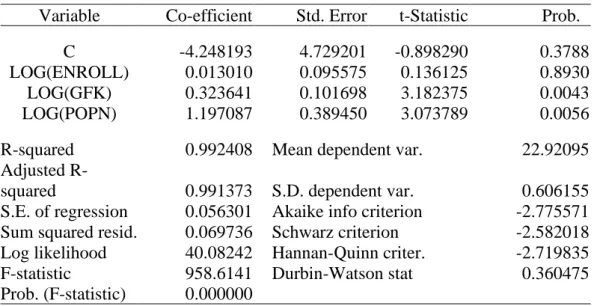
4.1.3: Ordinary Least Square Method.
Table 5: Results of Ordinary Least Square
Variable Co-efficient Std. Error t-Statistic Prob. C -4.248193 4.729201 -0.898290 0.3788 LOG(ENROLL) 0.013010 0.095575 0.136125 0.8930 LOG(GFK) 0.323641 0.101698 3.182375 0.0043 LOG(POPN) 1.197087 0.389450 3.073789 0.0056
.
R-squared 0.992408 Mean dependent var. 22.92095 Adjusted
R-squared 0.991373 S.D. dependent var. 0.606155 S.E. of regression 0.056301 Akaike info criterion -2.775571 Sum squared resid. 0.069736 Schwarz criterion -2.582018 Log likelihood 40.08242 Hannan-Quinn criter. -2.719835 F-statistic 958.6141 Durbin-Watson stat 0.360475 Prob. (F-statistic) 0.000000
Source: The Researcher’s estimations.
Table 5 above shows the estimation results from the time series data. According to the estimation results, higher education has an insignificant relationship with GDP, with a co-efficient of 0.0130 and a probability of 0.8930. Gross fixed capital formation has a positive relationship with GDP, with a co-efficient of 0.323641 and probability of 0.0043. Population also has a positive significant relationship with GDP, with a co-efficient of 1.197 and probability of 0.0056.
4.2: Panel Analysis
The time series data didn’t show a strong evidence that education has a positive impact on GDP in Uganda. As the data in Uganda is limited, this thesis also estimates the model with a panel data. As described before, the Panel data is consisting of five East African countries, which are; Uganda, Kenya, Tanzania, Rwanda and Burundi, because they all have similar economic growth and enrollment rates to Uganda.
26
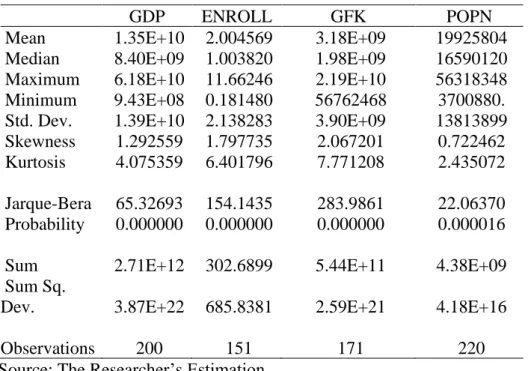
Table 6: Descriptive Statistics of Panel Data
GDP ENROLL GFK POPN
Mean 1.35E+10 2.004569 3.18E+09 19925804 Median 8.40E+09 1.003820 1.98E+09 16590120 Maximum 6.18E+10 11.66246 2.19E+10 56318348 Minimum 9.43E+08 0.181480 56762468 3700880. Std. Dev. 1.39E+10 2.138283 3.90E+09 13813899 Skewness 1.292559 1.797735 2.067201 0.722462 Kurtosis 4.075359 6.401796 7.771208 2.435072 Jarque-Bera 65.32693 154.1435 283.9861 22.06370 Probability 0.000000 0.000000 0.000000 0.000016 Sum 2.71E+12 302.6899 5.44E+11 4.38E+09 Sum Sq.
Dev. 3.87E+22 685.8381 2.59E+21 4.18E+16 Observations 200 151 171 220 Source: The Researcher’s Estimation
4.2.1: Panel Unit Root Test
Table 7: Panel Unit Root Test
Variable At Level probability value At Level statistic value 1st difference probability value 1st difference statistic value GDP 1.000 0.02009 0.0000 56.8115 Enrollment 0.9992 1.41595 0.000 61.7302 Gross Fixed Capital
Formation 1.000 0.4665 0.0000 125.730
Population 1.000 0.00057 0.0143 22.1691 Null unit root: assumes individual unit root process
Source: The Researcher’s Estimations.
27
All variables had a unit root at level implying non stationary and not having unit root at the first difference of their logs, meaning there where stationary. Similar results were achieved using the Levin Lin and Chu panel unit root test as shown below.
Table 8: Levin Lin and Chu Panel Unit Root Test
variable At level probability value At level statistic value 1st difference p value 1st difference statistic value GDP 1.000 25.5430 0.0002 -3.5351 Enrollment 1.000 4.5857 0.0000 -4.5100 Gross Fixed Capital Formation 1.000 12.5418 0.0000 -7.9811 Population 0.2836 0.02825 0.0014 -2.9864 Source: The Researcher’s estimations
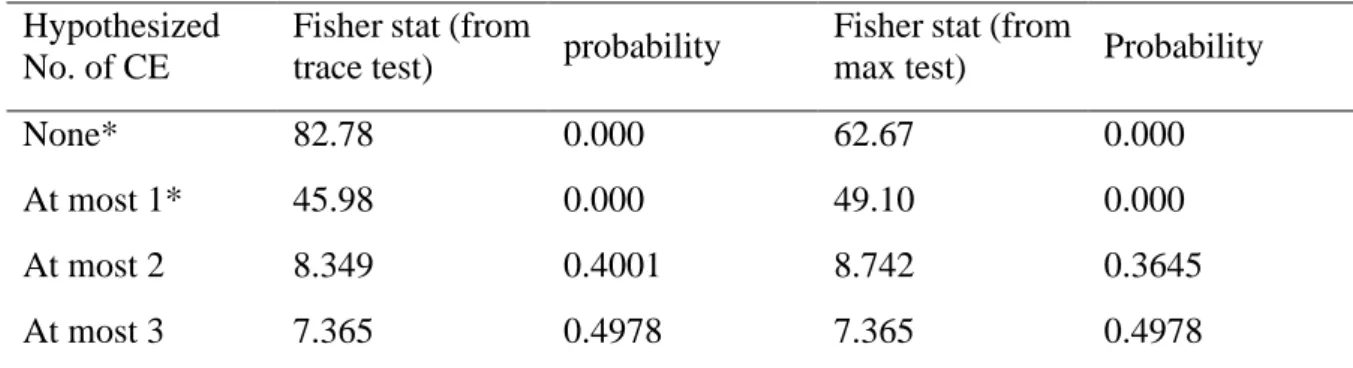
4.2. 2: Panel Co-integration
Johansen fisher panel co-integration was carried out on the panel data set. In table 9 below, the results showed at most, one co-integrating equation.
Table 9: Panel Co-integration
Hypothesized No. of CE
Fisher stat (from
trace test) probability
Fisher stat (from
max test) Probability
None* 82.78 0.000 62.67 0.000
At most 1* 45.98 0.000 49.10 0.000
At most 2 8.349 0.4001 8.742 0.3645
At most 3 7.365 0.4978 7.365 0.4978
Source: The Researcher’s Estimations.
28
According to the results in table 9 above, we reject the null hypothesis and accept the alternate hypothesis of at most, one co-integrating equation. A Kao co-integration test was also carried out and showed that there is a co-integrating equation among the variables according to the probability of 0.0094, which shows there is a long run relationship.
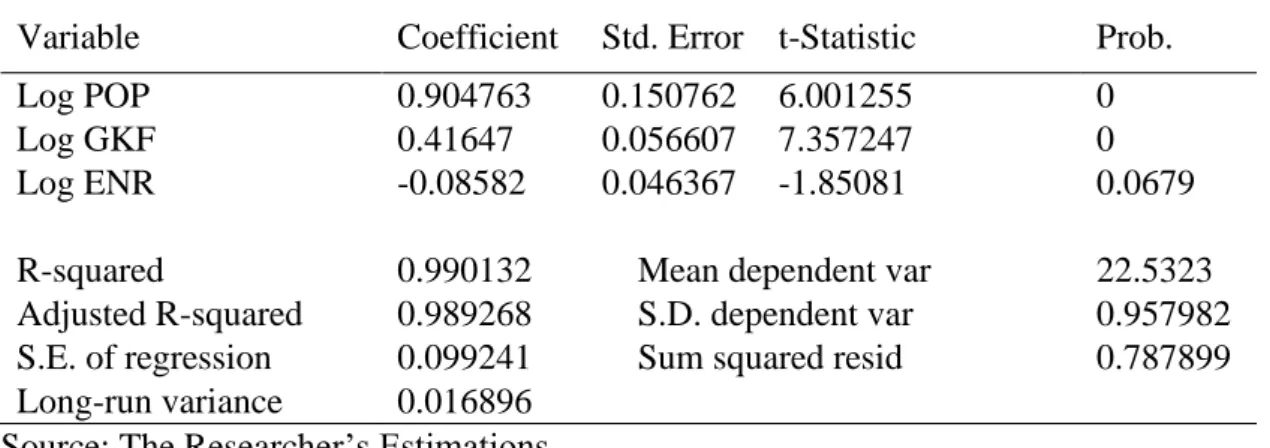
4.2.3: Panel Fully Modified Least Square (FMOLS).
The presence of co-integrating relationship among the variables endorses that there is a long-term relationship among variables, so the panel fully modified least square is appropriate to find out the long term and how the variables adjust towards a long run equilibrium. The model uses log GDP as the dependent variable and the independent variables; log higher education enrollment (Log ENR) , log population (Log POP) and log gross fixed capital formation(Log GFK).
Table 10: Results of Panel Fully Modified Least Square
Variable Coefficient Std. Error t-Statistic Prob. Log POP 0.904763 0.150762 6.001255 0 Log GKF 0.41647 0.056607 7.357247 0 Log ENR -0.08582 0.046367 -1.85081 0.0679 R-squared 0.990132 Mean dependent var 22.5323 Adjusted R-squared 0.989268 S.D. dependent var 0.957982 S.E. of regression 0.099241 Sum squared resid 0.787899 Long-run variance 0.016896
29
Table 10, corresponding to equation 2, reveals a negative relationship between higher education enrolment and economic growth. This indicates that higher education has a negative long-term relationship with economic growth with an elasticity of negative 8.5%. Population and Gross Fixed capital have a positive significant result with elasticities of 90.4% and 41.6%, respectively. This implies that a one percentage point increase in tertiary school enrolment reduces GDP growth by 8.5%.
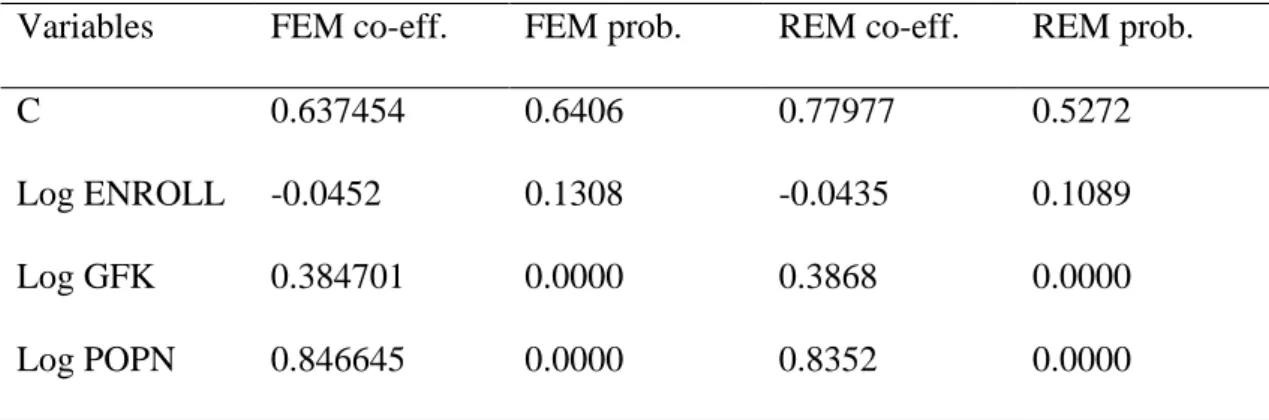
4.2.4 Fixed Effects Model and Random Effects Model
Table 11: Fixed Effects Model and Random Effects Model
Variables FEM co-eff. FEM prob. REM co-eff. REM prob.
C 0.637454 0.6406 0.77977 0.5272
Log ENROLL -0.0452 0.1308 -0.0435 0.1089 Log GFK 0.384701 0.0000 0.3868 0.0000 Log POPN 0.846645 0.0000 0.8352 0.0000 Source: Researcher’s estimations
Table 11 above, shows the results of the Fixed Effects Model and the Random Effects Model. The researcher uses log GDP as the dependent variable and the independent variables; Log Higher Education Enrollment (Log ENROLL), Log Gross Fixed Capital Formation (Log GFK) and Log Population (Log POPN). The results reveal a negative insignificant relationship between higher education enrollment and economic growth with a coefficient of -0.04 for both fixed effects and random effects model. The probability shows an insignificant relationship due to the probabilities 0.1308 and 0.84
30
for the models. Other variables, Gross Fixed Capital formation and population have a positive significant relationship with co-efficient of 0.38 and 0.84 respectively.
31
4.2.5: Hausaman Test
Table 12: Results of Hausaman Test
test cross-section random effect
Test results Chi-sq statistics Chi-sq d.f probability Cross-section random 3.581952 3 0.3103 Cross-section random effects comparison
variable Fixed effects Random effects
Var. probability Log enroll -0.045273 -0.043540 0.000158 0.8904 Log gfk 0.384701 0.386870 0.000042 0.7368 Log popn 0.846645 0.835293 0.0000922 0.7086 Variable Coefficient Standard Error t-Statistic Prob.
C 0.637454 1.361548 0.468183 0.6406
Log pop 0.846645 0.089901 9.41753 0 Log gfk 0.384701 0.035845 10.73232 0 Log enroll -0.04527 0.029731 -1.52275 0.1308 Source: The Researcher’s Estimations.
The table 12 above, shows the results of the Hausman test which was carried out to determine the appropriate model for the study. According to the probability of 0.3103, we reject the null hypothesis and accept the alternate hypothesis which suggests the Random Effects model as appropriate for the research.
The results obtained from estimating the Fixed Effects model, Random Effects model and Panel Fully Modified Least Square are consistent and indicate that enrollment has a negative and insignificant relationship with GDP.
32
CHAPTER 5: DISCUSSION AND SUMMARY OF ANALYSIS
Higher education enrollment has an insignificant negative long-run relationship with GDP due to the results obtained in the model. The insignificant negative result is likely to be brought about by a phenomenon of brain drain, where by even though the Government invests in higher education enrollment, the effect in long run is still negative and not significant. Adesote et al. (2018), Africa is on record as the continent with the highest brain drain rate, which is a hindrance to the economic development of the continent. Educated people migrate to developed countries after attaining a degree. Nevertheless, these results are not different from earlier empirical work in this area, which also confirms that in the long run, higher education cannot promote economic growth in developing countries. Brain drain is defined as the migration of people with higher education to other countries. It is more common in economies which are still in a phase of lower economic development, where graduates go to developed countries in search of ‘greener pastures.’ In 2010/11, 27% of migrants in the G20 had a high level of education (tertiary), as opposed to 23% in 2000/01 (Gibson & McKenzie, 2011). This links to the observed increase of 60%, or a total of 12 million tertiary educated immigrants (OECD 2017, p10). The higher salaries and better working conditions in the developed countries are one of the ‘pull’ factors which attracts higher educated people, and affects an increase in the enrollment rates of higher education (Gibson & McKenzie, 2011) in the developing countries.
33
5.1: Brain Drain
Brain drain is defined “ as the international allocation of human capital, primarily highly educated individuals, from developing to developed countries” (Broaded, 1993; Docquier & Rapoport 2006). It’s stated that the most immigrants in the high skilled labor bracket, who transfer to developed countries, frequently do so because of political, social and economic factors (Harvey 2012). These include higher payment, better working conditions and expectations of improved standards of living. Globalization has also influenced several individuals to travel from one country to another, due to International trade, finance and knowledge (Bhagwat, 2011). Research shows that the highly educated people have a higher desire for international movement than the less and uneducated ones. This is mainly owing to the higher salaries earned in the country of destination, better opportunities and low relocation costs (Boeri et al., 2012).
Brain drain is caused by both ‘pull’ and ‘push’ factors. The reasons influencing the migration from the source country are considered as push factors, and those inducing the movement to the destination country are regarded as pull factors (Dorigo & Tobler, 1983). Push factors include, poverty, political tyranny, corruption, desire to travel and barbaric culture acts. Most educated people in Africa travel to Europe, Asia and America because of the low salaries and poor working conditions in their home countries. Others travel due to the constant political instabilities in source countries (Giannoccolo 2009) and because the political climate is a vital aspect of movement, that also influences the ratio of brain drain. The level of political establishment has two essential aspects, equality and stability, which positively and negatively influence on the migration of skilled labor. In Africa, the leading cause of migration of educated people is political instability, terrorist attacks and poor governance (Benedict & Ukpere, 2012). Genocide in Rwanda
34
led to the migration of many high skilled people to neighboring and developed countries. The skilled laborers decided to permanently settle in the developed countries, which were more politically stable.
Furthermore, corruption is also another factor pushing migration of skilled labors. This is confirmed by the findings of Cooray and Schneider (2016). According to those researchers, “as corruption increases, the expatriation rate of high-skilled migrants increases while the emigration rate of medium- and low-skilled migrants advances at low levels of corruption and then starts to decline beyond a certain point”
The pull factors include the expectation of high salaries, better standards of living, better working conditions, and political stability in prospective host countries. Better working conditions, such as women workers being given a year of maternity leave in Japan is just one example. This vastly differs from most African countries. The intensive competition among developed countries in enticing and retaining more talented and skilled laborers increased during the Great Depression. There is also a tremendous rise in refugee and asylum seekers, which entails international migrants at a rate of approximately 10% (United Nations, 2017, p. 7).
The information on the labor market also influences the decision of skilled laborers to migrate. Kwok and Leland (1982) listed the following as elements inducing foreign students’ decision-making in the labor market; lack of employment opportunities, low salary levels in the native country and graduates’ preferences to live abroad. Most employers in the native countries of these students, pay comparably lower salaries, which are on the consideration of the average pay, and discourages the foreign students from returning to their native countries and consequently, decide to instead work in the
35
developed countries where they are highly paid. The information about a higher salary and better working conditions in developed countries motivate more foreign students to permanently migrate.
“Another cause of brain drain is the theory of Reasoned Action, which explains the relationship between attitude and other variables” (Ajzen et al., 1977). Attitude is defined as the positive and negative evaluation of an object while the concept of belief refers to activities that are consistently accepted to lead to favorable and unfavorable conditions. The theory clarified on the social intentions created or caused by the two factors: attitudes and belief (Ajzen et al., 1977). The theory was improved based on the psychological studies about attitude and behavior of the individual on the social environment. Besides that, it also describes those peoples’ reactions against any condition in the society, to differ from others. Hence, there is a link to their personality which accepts or rejects an equal situation. The behavior and belief of an individual influences their decision for and against migrating. A person who feels unsatisfied, will effortlessly migrate more often than the person who is content with their job.
36
Table 13: Number of Ugandans who migrated for Further Studies abroad
Country 2007 2008 2009 European Union 2,694 2,646 2,842 United Kingdom 2,253 2,150 2,284 Germany 119 116 137 Belgium 42 51 90 Sweden 29 47 49 Denmark 40 37 39 Netherlands 48 42 40 Finland 29 44 48 Ireland 30 42 40
Source: International Migration Organization, 2015
Table 13 above, is evidence that a big number of Ugandans travel after attaining their first degree. The data was sourced from the Eurostat data base, showing the different European countries Ugandans migrated to, to continue their studies. There is an increase in the migration rates from 2007 to 2009.
37
Figure 3: A Graph Showing the Level of Education of Remitters to Uganda.
Source: Uganda National Bureau of Statistics
The graph above shows results of a survey which was conducted in Uganda about the remittance received in 2008, that totaled to USD $ 732.4 million. The results showed that most of the Ugandans living abroad are educated and have a minimum qualification of a higher education degree.
1.3 1.7 4.9 6 16 24.8 45.4 0 5 10 15 20 25 30 35 40 45 50 none didn’t complete primary
don’t know completed primary post secondary qualification completed secondary degree and above % a g e o f re m itta n ce level of Education
38
Table 14: Population of Ugandans Employed in Foreign Countries in 2013
Country Men Women Total
Iraq 3,929 74 4,003
UAE 1,537 224 1,761
Afghanistan 241 - 241
Somalia 2 - 2
Sudan 1 - 1
Source: International Migration Organization, 2015
Table 14 above, is evidence of brain drain phenomenon in Uganda. Skilled laborers migrate to developed countries in search for better paying jobs. The unemployment rate in Uganda pushes most of the educated people to migrate after obtaining higher education. Data was attained from the ministry of gender and labor in Uganda.
5.1.1: Effects of Brain Drain.
Several studies claim that brain drain has a negative effect on the source country. Ngoma (2013), used secondary and tertiary school enrolments as proxies for human capital investment, an Ordinary Least Square and IV estimators. The findings indicated that in the short-term relationship, the prospect of migration effect adversely on human capital formation in the source country of the migrants, while the long-term impact was
39
insignificant. This means that brain drain is detrimental to the source countries in both short and long term.
Brain drain leads to the loss of human capital as the source country loses its potential highly skilled man power to the developed countries, thus deteriorating the home country’s development. Human capital is one of the elements essential in economic growth. Rauch (1993; Portes & Böröcz 1989) observed that travelling and movement are continuing processes, and constantly occurs in the same direction due to higher wages in the last stop country which leads to the deviation in per capita incomes. Under these conditions, the outflow of highly skilled workers is disadvantageous to the source country because it loses its experts and professionals needed for development, thence hindering technological innovation (Lindahl, 1985).
Brain drain results into financial and investment losses, of which African Governments’ invest a lot of resources in their citizens, to attain education by awarding them with scholarships, grants and loans to increase the enrollment rates. This is conducted in anticipation of an increase in human capital to achieve national millennium set goals of development. Unfortunately, they achieve disappointing results at the end with the migration of the skilled labor to developed countries in search of higher payments and better working conditions (Gibson, 2011). Due to insufficient experts in the labor market, the Government then opts to import professionals from other continents like Asia and America (Adesote & Osunkoya, 2018).
40
Figure 4: Showing Response of Medical Students about Migration
Source: (Rubagumya et. al. 2016).
A survey was conducted on Rwanda medical students to determine their attitude towards migration and career path, and it was found that most of them strongly desired to work and study abroad after their graduation, with few that were willing to work in Rwanda ( Rubagumya et al. 2016). This is a sign of brain drain and the willingness of the graduates in developing countries to migrate to other countries which affects the relationship between GDP and higher education enrollment.
42.70% 18.70% 11.50% 0.00% 5.00% 10.00% 15.00% 20.00% 25.00% 30.00% 35.00% 40.00% 45.00% DESIRE TO WORK/STUDY ABROAD LIKELY TO WORK/STUDY ABROAD INTERESTED IN PUBLIC HEALTH S tr o n g ly Ag re e
RESPONSE OF MEDICAL STUDENTS
A Graph Showing Career Plans of Future Medical Graduates of Rwanda
41
Figure 5: Showing the Percentage of Remittance Inflow to GDP of Uganda.
Source: World Bank
The graph above shows the percentage of the inflow of remittance to the GDP of Uganda from 1990-2017. Remittance contributes a good percentage of the GDP, so it too increases economic growth. A survey was carried out by the Uganda National Bureau of Statistics to examine the education level and status of Ugandans remitting money and their length of stay in foreign countries, and it was found that most of them migrated from Uganda after attaining a degree and are now working abroad.
0 1 2 3 4 5 6 7 8 T im e 1 9 9 0 1 9 9 1 1 9 9 2 1 9 9 3 1 9 9 4 1 9 9 5 1 9 9 6 1 9 9 7 1 9 9 8 1 9 9 9 2 0 0 0 2 0 0 1 2 0 0 2 2 0 0 3 2 0 0 4 2 0 0 5 2 0 0 6 2 0 0 7 2 0 0 8 2 0 0 9 2 0 1 0 2 0 1 1 2 0 1 2 2 0 1 3 2 0 1 4 2 0 1 5 2 0 1 6 2 0 1 7 % re m it a nce years
Personal remittances, received (% of GDP)
42
CHAPTER 6: CONCLUSION AND POLICY RECOMMENDATION
6.1: Conclusion
This paper examines the relationship between human capital and economic growth by using higher education enrollment rate as a proxy for human capital, GDP as a proxy for Economic growth, Gross Fixed Capital formation as a proxy for physical capital and total population using co-integration, OLS and Panel Fully Modified Least Square for both time series and panel data. The results show an insignificant long-term relationship between higher education and economic growth for both time series and panel analysis. Time series analysis results indicate, that higher education enrollment and GDP have a positive insignificant long-run relationship with an elasticity of 1.3%, while panel analysis results indicate a negative insignificant long-run relationship with an elasticity of 8.5%. Gross Fixed Capital Formation and Population have a positive significant long-term relationship with GDP. The results attained are similar to other studies conducted; (Pritchett, 1997; Klenow & Bills 2000). This result was not anticipated and will need further investigation.
6.2: Policy Recommendations
Uganda’s Government should put more emphasis on the quality of education rather than the quantity. The efforts which have been put into increasing enrollment rates, should instead be put into investing more in education. This can be achieved by increasing the funds allocated to the education sector so that graduates attain the skills needed in the labor market, and to also train them so they acquire technical skills. Fuller et. al. (1986), studied the effect of the quality of education on economic growth and found a positive
43
significant relationship. Countries with good quality education rapidly developed compared to their counterparts that had poor quality education (Gaule, 2016).
The education system of Uganda should also be reinstated, to not only encompass the Higher Education sector but rather for all education levels; Primary and Secondary. The curriculum and syllabus of all the levels of education should create graduates who are innovative and job creators, not seekers. The training given to the students at all levels must empower them to have knowledge, creativity and skills to become entrepreneurs who have the ability to start up new projects, rather than being unemployed or migrating to the developed countries in expectation of better paying jobs after graduation.
Increasing investment in other sectors like tourism and trade should, moreover, also occur in lieu of just investing in education alone, so that educated professionals will be less likely to migrate to developed countries in search for better paying jobs. Other sectors like trade and tourism can boost economic growth by rising the GDP, and this too will increase the employment rate of both skilled and unskilled laborers, thence increasing economic growth.
A restricting Government policy on the migration of the skilled laborers is also an option to consider (Romero, 2013). Uganda should set up strict laws on the migration of educated people, mainly the ones who have been sponsored or awarded scholarship by the Government to reduce on the human capital and financial losses of investing in students who then later migrate to developed countries after graduation. A Government can also restrict access to the TOEFL test which is a requirement by most developed countries where English is a Primary language. Scholarships should be awarded to those