Introduction
Population in Japan began to decline in 2005. The aging of society and the decline in birth rate are expected to accelerate. As a result, the country is likely to face a decrease in the labor force population, which also affects the sustainable development of the Japanese economy and society.
In this paper, I describe present systems and problems of Japanese social security, facing the aging of society with fewer children, especially the long term care insurance, supports for children and parents raising them. I also refer to an international comparison of social expenditures.
We have a broad definition of social security in Japan, which includes not only public aid and social insurances but social welfare services for the elderly, handicapped people and children.
1. The aging of society with fewer children
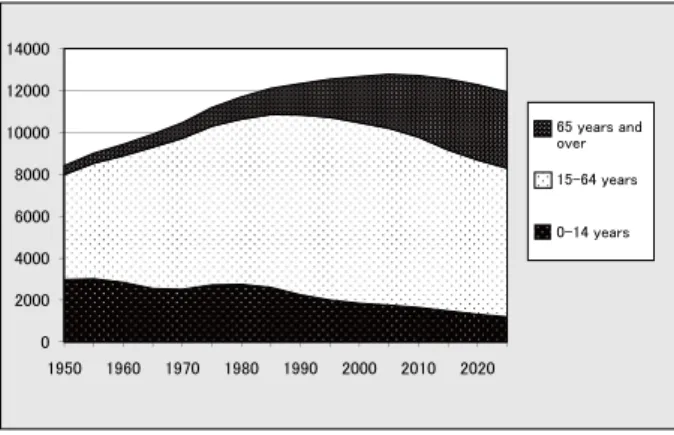
Japanese population was 127,771,000 in 2007 and will decrease to 115,220,000 in 2030, according to the Ministry of Health, Labor and Welfare. Aging ratio will rise from 21.5% to 31.8% in the same period. The number of children younger than 15 years old was 17,590,000 in 2005 and will decrease
to 11,150,000. The total fertility ratio was 1.37 in 2008 and will still be very low in 2030. The number of people between 15 and 64 years old will also decline from 84,420,000 to 67,400,000.
As for family structure, the average number of household members has been consistently decreasing. The number was 3.22 in 1980 and 2.56 in 2005. Households consisting of a couple and their children accounted for 42.1% of all households in 1980, but the percentage declined to 29.9% in 2005. One-person households, on the contrary, rose to 29.5% in 2005 from 19.8% in 1980. Households of only a couple also rose from 12.5% to 19.6%.
2010 年 11 月 29 日受付/ 2011 年1月 19 日受理
Junichi FUJIOKA
関西福祉大学 社会福祉学部
Overview
Social security in the aging of society with fewer children in Japan
Junichi Fujioka
Abstract:The long term care insurance was introduced in 2000. The number of the people who use long term care and assistance has rapidly increased since the introduction. However, the insurance has lots of problems today, such as shortage of both facilities and care workers and still existing heavy burden of family caregivers.On the other hand, several plans were made and different measures are being carried out, aiming to allow society to endeavor to support child rearing. There is still a wide gap between the reality and people’s desire concerning marriage, childbearing and parenting.
Problems in the long-term care insurance should be solved and children and parents raising them should be more supported, based on the concepts of broad-based capabilities and human right.
Key Words:aging of society, decline in the birth rate, long-term care insurance, supports for children and parents raising them, capability approach
㪪㫆㫌㫉㪺㪼㪑㩷㪤㫀㫅㫀㫊㫋㫉㫐㩷㫆㪽㩷㪟㪼㪸㫃㫋㪿㪃㩷㪣㪸㪹㫆㫉㩷㪸㫅㪻㩷㪮㪼㫃㪽㪸㫉㪼 㪇 㪉㪇㪇㪇 㪋㪇㪇㪇 㪍㪇㪇㪇 㪏㪇㪇㪇 㪈㪇㪇㪇㪇 㪈㪉㪇㪇㪇 㪈㪋㪇㪇㪇 㪈㪐㪌㪇 㪈㪐㪍㪇 㪈㪐㪎㪇 㪈㪐㪏㪇 㪈㪐㪐㪇 㪉㪇㪇㪇 㪉㪇㪈㪇 㪉㪇㪉㪇 㪍㪌㩷㫐㪼㪸㫉㫊㩷㪸㫅㪻㩷 㫆㫍㪼㫉 㪈㪌㪄㪍㪋㩷㫐㪼㪸㫉㫊 㪇㪄㪈㪋㩷㫐㪼㪸㫉㫊
Figure 1 Trends in the Total population and Future Populations projected by Age Group (10 thousand people)
The ratio of one-person households is expected to increase further in the future, accounting for 37.4% in 2030, though the ratio of households of married couple with children is expected to decrease to 21.9%.
2. Long-term care insurance
(1) Before enacting the long –term care insurance
The law of long-term care insurance was enacted in 1997, came into effect in 2000, and was revised in 2006. About 10 years before this enactment, a ten-year strategy to promote healthcare and welfare for the elderly (so called The Gold Plan) was created and the law of certified Social Workers and Care workers was enacted.
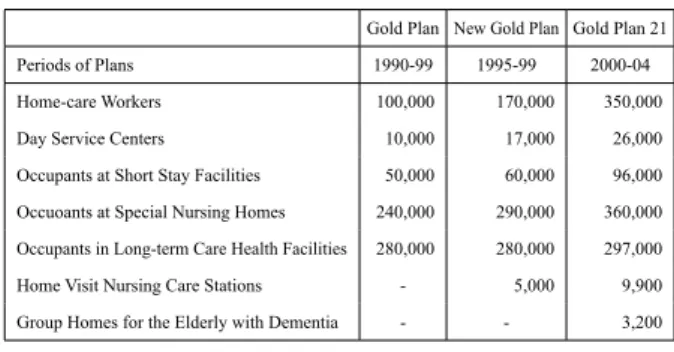
The Gold Plan aimed at expanding the service infrastructure in the fields of health care and welfare for the elderly. Goals were set for the ten-year period from fiscal 1990 to fiscal 1999. The plan was revised two times. Table 1 shows goals of these plans.
The law of Certified Social Workers and Care Workers was put into act in 1987. There are two ways to become a certified care worker, one is graduating from a technical college or a special school in a university and the other way is passing the state exam after three years of work as a caregiver. However,
the former will be abolished in 2011.
To become a certified social worker, you have to pass a state exam after graduating from a special school in a university.
In 1991, the training program for in-home caregivers was started. After completion of the program trainees receive certification. The program is divided into three classes. The first class requires 230 training hours, 130 hours for the second, and 50 hours for the third. The program of the third class is today not carried out any more.
Certified Psychiatric Social Worker is a certification that was introduced in 1997. These social workers operate mainly in hospitals.
(2) Long-term care insurance system ① Insurers and Insured
Insurers are all municipalities of which the number is 1,818. The primary insured are made up of people who are 65 years and over, totaling 27,570,000 people in 2008. The secondary insured are those between 40 and 64 years of age who are insured by the health care insurance, totaling 42,390,000. Everyone who is insured must pay an insurance premium.
Premiums for Primary Insured depend on municipalities. The average premium is 4,270 Yen/month. Premiums for high income individuals are 1.5 times higher, while those for low income individuals are half the normal amount. Premiums for the Secondary Insured are 1.098~1.23 percent of standard remuneration and standard bonus.
② Two Steps of Care Need Certification
Step 1: A municipal investigator visits the applicant for long-term care and gives them a 67 item interview on ADL, BPSD (Behavioral and Psychological Symptoms of Dementia), Mental & Behavior Disorder, IADL and Recent Treatment of Diseases. The first assessment is carried out based on the computer calculations of this investigation.
Step 2: A final assessment is made by the care need certification committee, based on the first assessment, a family doctor’s opinions etc.
There are seven levels of long term care need, two support levels and five care levels. Assessment is made about whether the applicant is recognized as self-help or one of these levels.
After these steps a care manager makes a plan for care services which are deemed necessary for the person requiring 㪇㩼 㪈㪇㩼 㪉㪇㩼 㪊㪇㩼 㪋㪇㩼 㪌㪇㩼 㪍㪇㩼 㪎㪇㩼 㪏㪇㩼 㪐㪇㩼 㪈㪇㪇㩼 㪈㪐㪎㪌 㪈㪐㪏㪇 㪈㪐㪏㪌 㪈㪐㪐㪇 㪈㪐㪐㪌 㪉㪇㪇㪇 㪉㪇㪇㪌 㪉㪇㪇㪏 㪇㩼 㪈㪇㩼 㪉㪇㩼 㪊㪇㩼 㪋㪇㩼 㪌㪇㩼 㪍㪇㩼 㪎㪇㩼 㪏㪇㩼 㪐㪇㩼 㪈㪇㪇㩼 㪈㪐㪎㪌 㪈㪐㪏㪇 㪈㪐㪏㪌 㪈㪐㪐㪇 㪈㪐㪐㪌 㪉㪇㪇㪇 㪉㪇㪇㪌 㪉㪇㪇㪏 other Three generation family Parent with unmarried children couple with unmarried children Couple only one person Figure 2 Household Structure
Table 1 Main Goals of the Gold Plan etc.
Gold Plan New Gold Plan Gold Plan 21 Periods of Plans 1990-99 1995-99 2000-04 Home-care Workers 100,000 170,000 350,000 Day Service Centers 10,000 17,000 26,000 Occupants at Short Stay Facilities 50,000 60,000 96,000 Occuoants at Special Nursing Homes 240,000 290,000 360,000 Occupants in Long-term Care Health Facilities 280,000 280,000 297,000 Home Visit Nursing Care Stations - 5,000 9,900 Group Homes for the Elderly with Dementia - - 3,200
Source: Ministry of Health, Labor and Welfare Source: Ministry of Health, Labor and Welfare
care, taking maximum units available for in-home care services into account.
Lastly, the person requiring care makes a contract with organizations of caregivers and begins to receive cares and services.
The number of the people requiring care services was 2,182,000 in 2000, and the number almost doubled in 2006 and reaching 4,548,000 in 2008.
③ Three types of the Long Term Care Services
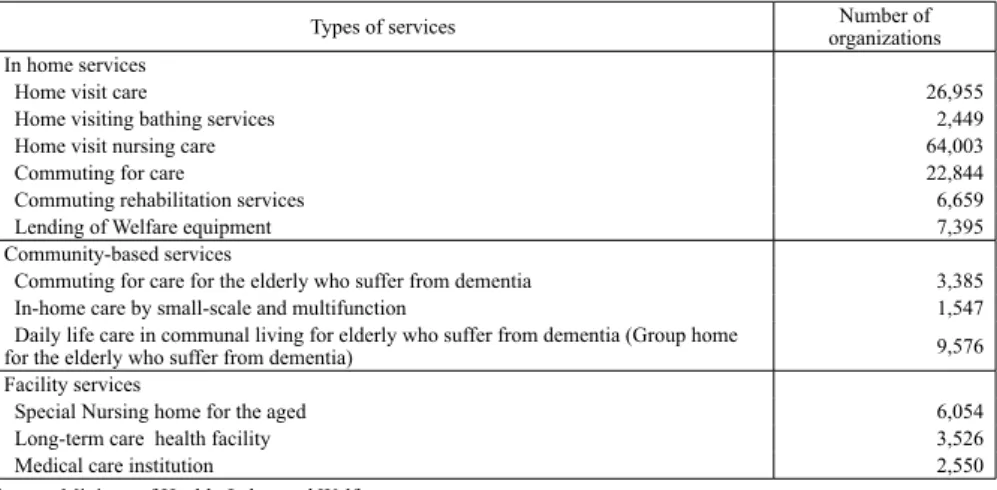
Long term care services are broken down into three types, facility services, in-home services and community-based care services. Facility services include special nursing home,
long-term care health facility and medical care institution. In-home services include home visit care, home visiting bathing services, home visit nursing care, commuting for care, commuting rehabilitation services, short-term stay at a care-facility, and Lending of Welfare equipment. Community-based care services, which were introduced in 2006, contain commuting for care for the elderly who suffer from dementia, in-home care by small-scale and multifunction, group home for the elderly who suffer from dementia, etc. Besides, comprehensive prevention services are introduced in 2006 for in-home services and community-based care services. Table 2, 3 and 4 show the number of service users, the number of service organizations for each type and establishing
Table 2 The number of Service Users
1000 people Type of Services 2000 2,003 2006 2008 In home sevices(including prevention) 971 2,015 2,547 2,685 Community-based care services(including prevention) 142 205
Facility services 518 721 789 825
Total 1,490 2,736 3,477 3,715
Source: Ministry of Health, Labor and Welfare
Table 3 The number of service organization for each type
Types of services organizationsNumber of In home services
Home visit care 26,955
Home visiting bathing services 2,449
Home visit nursing care 64,003
Commuting for care 22,844
Commuting rehabilitation services 6,659
Lending of Welfare equipment 7,395
Community-based services
Commuting for care for the elderly who suffer from dementia 3,385 In-home care by small-scale and multifunction 1,547 Daily life care in communal living for elderly who suffer from dementia (Group home
for the elderly who suffer from dementia) 9,576 Facility services
Special Nursing home for the aged 6,054 Long-term care health facility 3,526
Medical care institution 2,550
Source: Ministry of Health, Labor and Welfare
Table 4 Establishing Organizations %
Types of services GovernmentLocal Social Welfare Judical person Medical Judical Person Campany OrganizationNon-profit others Total
Home visit care 0.7 26.5 7.2 54.1 5.9 5.6 100
Home visiting bathing services 1.1 55 2.3 38.7 0.9 2 100
Short-term stay 4.4 84.2 2.8 7.7 0.4 0.5 100
Lending of Welfare equipment 0.1 3.5 2.1 89 1 4.3 100 Commuting for care for the Elderly
with dementia 1.6 53.1 12.4 24.2 5.8 2.9 100
Group home for the E.lderly with
dementia 0.2 22.2 18 53.3 5.3 1 100
Special nursing home 8.5 91.5 0 0 0 0 100
Long-term care health facility 4.5 15.9 73.7 0 0 5.9 100 Medical care institution 2.1 1.3 78.1 0.2 0 18.3 100 Source: Ministry of Health, Labor and Welfare
organizations.
Community-based comprehensive support center was introduced in 2006, which is expected to play an important role in (a) prevention management, (b) general consulting and guidance, (c) protection of right, and (d) supports and coordination of care managers in the area.
④ Finance and Charges
10 % of the total costs is borne by the user. The rest of the costs is financed, half by insurance premiums, and the other half by government, of which a quarter by central government, one eighth by prefectures and one eighth by municipalities.
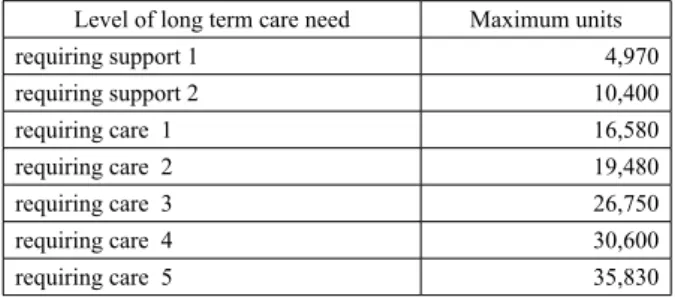
Maximum units available for in-home care services are determined by the law as shown in table 5. Services cost normally 10 yen per unit, but a little higher in big cities than other areas. Users are charged 10% of the costs for the services they used. In addition, users can buy welfare equipments, such as sitting type toilets, and renovate user’s own houses such as installation of handrail. They can spend 100,000yen for equipments and 200,000yen for house renovation. They also have to pay 10% of the costs.
Charges for facility care services are fixed amount. Table 6 shows the examples of special nursing homes for the elderly. Charges for a single occupancy room with unit care are a little higher than a non-single room. Additional charges are necessary for the room and foods. These charges are reduced
for low income earners. (3) Problems
The long-term care insurance in Japan today has lots of problems.
Firstly, there is a shortage of facilities. Lots of elderly people are waiting for vacancies in the facilities.
Secondly, we also have a shortage of care workers. Working conditions for care workers are not ideal, for example, low pay and long working hours.
Thirdly, home visit nursing cares are supplied by different organizations from home visit care. Thus nursing cares are not always collaborated with care services.
Fourthly, the difference in insurance premiums among municipalities is very big.
Fifthly, the heavy burden placed on family caregivers still exists although it has been alleviated to an extent.
Sixthly, financial problems are rising. Insurance premiums are likely to increase.
Lastly, but not least, the improvement of the QOL of the elderly should be placed to the basic position of the system.
The long term care insurance is revised every three years. The next revision will be done in 2012.
3. Support for children and parents raising them
"Basic Direction for Future Child Rearing Support Measures (so called Angel Plan)" was formed in December 1994. This plan aims to allow the society as a whole to endeavor to support child rearing in a comprehensive and systematic manner. After this several plans were made and different measures were carried out.
There is still a wide gap between the reality and people’s desire concerning marriage, childbirth and parenting. Total fertility ratio was 1.26 in 2006. However, the ratio would have been 1.75 if calculated by what people desire (Ministry of Finance, 2008, p.96).
(1) Causes of the low fertility ratio
Causes of low fertility ratio are discussed in several ways. ① Though the number of working women is increasing, the environment in which working women are bearing and raising children is not adequate. ② Shortage of day nurseries. ③ Family member’s long working hours. ④ Compensation for child care leave is inadequate. ⑤ Economic burdens from education are high.
Table 5 Maximum units available for in-home care services
Level of long term care need Maximum units
requiring support 1 4,970 requiring support 2 10,400 requiring care 1 16,580 requiring care 2 19,480 requiring care 3 26,750 requiring care 4 30,600 requiring care 5 35,830
Source: Ministry of Health, Labor and Welfare
Table 6 An example of charges of special nursing homes for the elderly
units /day
Level of long term care need occupancy roommultiple room with unit careSingle occupancy
requiring care 1 639 657
requiring care 2 710 728
requiring care 3 780 798
requiring care 4 851 869
requiring care 5 921 929
(2) Inadequate Aid and Support
① There were 22,484 day nurseries, which were used by 2.02 million children in April, 2007. The number of children waiting admission into day nurseries was 17,926. There are still many waitlisted children, especially in urban areas.
② Maternity and child care leave are covered by medical insurance, which covers up to 2/3 of the equivalent of the employee’s salary, and employment insurance, which covers up to 1/2 of it .
③ A child allowance, i.e. an allowance for child-rearing, was paid to parents who are raising preschool-aged children. The amount was 5,000yen or 10,000yen/month according to the age of the child etc. Parents whose income of the previous year was beyond a certain amount cannot receive this allowance (income limitation).
The new government, which came into power in 2009, founded a new child allowance of 13,000 yen/month which shall be paid to all parents raising children until the child’s graduation from middle school regardless of household income.
④ There are no tuition fees for public elementary and middle schools, but parents must bear the costs for lunch. Tuition fees for high school vary from school to school. It is between 5,000 yen and 12,000 yen per month for public schools. However, the amount that parents must pay for the first year of private school is about 1 million yen including the entrance fee.
The new government substantially made the tuition fees for public high school free in 2010.
According to international comparison of family-related social spending as a percentage of GDP (2003), Japanese spending is very low, as shown by table 7.
4. Social Expenditure
"Social security benefit expenditure" is a total sum of money and service annually given to the citizens through social security systems such as social insurance and welfare. According to the calculations done by the National Institute of Population and Social Security Research, the social security benefit expenditure totaled ¥98.7 trillion in fiscal 2009.
As shown in Table 8, the social security benefit expenditure has been expanding year by year. In fiscal 1970, the expenditure amounted to ¥3.5 trillion, which was 5.7% of National Income. Comparing these figures with the fiscal 2009, the total amount of the expenditure has increased by about 28 times and to 26.8% of National income.
To compare public social expenditures by broad social policy area in percentage of NNI with some other OECD countries, Japanese percentage is relatively low. Swedish and French are both very high, but have different structures. The ratio of pension is highest in France, though all social services except health in Sweden are higher than in other countries. The ratio of pension is very high in Japan, but income support to working age population and all social services except health are low. The ratio of active labor market programs in Sweden is high, though the ratio in Japan is low.
Table 7 International comparison of family-related social spending as a percentage of GDP (2003) % Family Allowance Maternity and Parental Leave Other Cash
Benefits Day-care & Home-help BenefitsOther Total Japan 0.19 0.12 0.33 0.11 0.75 U.S. 0.09 0.32 0.29 0.7 Italy 0.44 0.19 0.03 0.58 0.08 1.32 Germany 0.93 0.25 0.15 0.4 0.38 2.11 U.K. 0.84 0.1 1.24 0.58 0.17 2.93 France 1.11 0.34 1.19 0.39 3.03 Sweden 0.85 0.66 0.09 1.74 0.21 3.55 Source: OECD
Table 8 Trends of Social Security Expenditures as a Percentage of
National Income trillion yen, %
1970 1980 1990 2000 2009budget National insome 61.0 203.2 348.3 371.6 367.7 Total Social expenditure 5.7 12.2 13.6 21.0 26.8 Pension 1.5 5.2 6.9 11.1 14.0 Medical care 3.4 5.3 5.3 7.0 8.4 Social welafare & others 1.0 1.8 1.4 2.9 4.4
Source: the National Institute of Population and Social Security Research
Table 9 Public social expenditure, in percentage of NNI, in 2005
%
Pensions (old age and
survivors) Income support to the
working age population
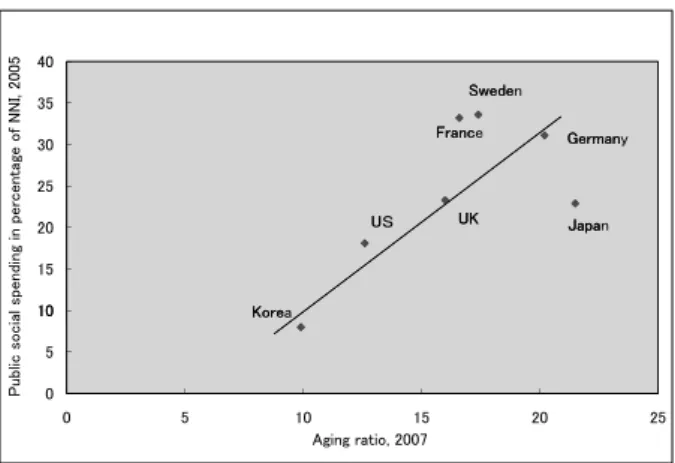
Health All social services except health Active Labour Market Programmes Total Sweden 8.8 7.8 7.7 7.8 1.5 33.6 France 14.0 5.8 8.9 3.3 1.0 33.1 Germany 13.2 5.2 8.9 2.6 1.1 31.1 United Kingdom 6.2 5.0 7.7 3.8 0.6 23.3 Japan 10.7 1.9 7.8 2.2 0.3 22.9 United States 6.8 2.2 7.9 1.0 0.1 18.0 Korea 1.8 1.6 3.7 0.8 0.1 7.9 Source: OECD
To examine an international comparison of the scale of public social expenditure and aging ratio, an almost straight line can be drawn from Korea through US and UK till Germany. Japan is below the line, but Sweden and France are over the line, as shown in figure 3.
Conclusion
Social exclusions from social security system and/or labor market etc. are urgent problems to solve. As Amartia Sen (Sen, A. 2001, p.87)mentioned, poverty must be seen as the
deprivation of basic capabilities rather than merely as lowness of income. Mick Carpenter et al. advocated a broad-based capabilities and human right approach as the most appropriate way forward beyond both employability and human capital approaches (Carpenter M. et al. 2007, p.6).
Problems in the long-term care insurance should be solved; children and parents raising them should be more supported from these points of view. Social security for the elderly and children to keep, call forth and develop human capabilities is as important as active labor market policies. Social Family relationship also could be improved by enough support and care for the elderly, children and parents. The work-family balance is one of the goals in our everyday life.
Reference
1. Carpenter M., B.Freda and S.Speeden, 2007, Beyond the
Workfare State, The Policy Press.
2. Ministry of Health, Labor and Welfare, 2008, Annual Health,
Labour and Welfare Report, 2008 fiscal year version (Japanese
version).
3. Ministry of Health, Labor and Welfare, 2009, Annual Health,
Labour and Welfare Report, 2008-2009 (English version).
4. OECD, 2009, Society at a Glance 2009.
5. Sen, A., 2001, Development as Freedom, Oxford University Press. 㪊㪇 㪊㪌 㪋㪇 㪝㫉㪸㫅㪺 㪪㫎㪼㪻㪼 㪞㪼㫉㫄㪸㫅 㪉㪇 㪉㪌 㪊㪇 㪝㫉㪸㫅㪺 㪪㫎㪼㪻㪼 㪞㪼㫉㫄㪸㫅 㪡 㪬㪢 㪬 㪈㪇 㪈㪌 㪉㪇 㪝㫉㪸㫅㪺 㪪㫎㪼㪻㪼 㪞㪼㫉㫄㪸㫅 㪡㪸㫇㪸 㪬㪢 㪬 㪢㫆㫉㪼 㪇 㪌 㪈㪇 㪝㫉㪸㫅㪺 㪪㫎㪼㪻㪼 㪞㪼㫉㫄㪸㫅 㪡㪸㫇㪸 㪬㪢 㪬 㪢㫆㫉㪼 㪇 㪌 㪈㪇 㪈㪌 㪉㪇 㪉㪌 㪧㫌㪹㫃㫀㪺㩷㫊㫆㪺㫀㪸㫃㩷㫊㫇㪼㫅㪻㫀㫅㪾㩷㫀㫅㩷㫇㪼㫉㪺㪼㫅㫋㪸㪾㪼㩷㫆㪽㩷㪥㪥㪠㪃㩷㪉㪇㪇㪌 㪘㪾㫀㫅㪾㩷㫉㪸㫋㫀㫆㪃㩷㪉㪇㪇㪎 㪝㫉㪸㫅㪺㪼 㪪㫎㪼㪻㪼㫅 㪞㪼㫉㫄㪸㫅㫐 㪡㪸㫇㪸㫅 㪬㪢 㪬䌓 㪢㫆㫉㪼㪸
Figure 3 International comparison of the scale of public social expenditure and aging ratio