NF-κBシグナル制御におけるHSP70/DNAJA3複合体の
機能解析
著者
熊田 幸平
学位授与機関
Tohoku University
学位授与番号
11301甲第18894号
URL
http://hdl.handle.net/10097/00129247
NF-κB
AGO Argonaute
ARD Ankyrin repeat domain B. bassiana Beauveria bassiana
CERK1 Chitin elicitor receptor kinase 1 c-IAP Cellular inhibitor of apoptosis protein co-IP Coimmunoprecipitation
DD Death domain
DMEM Dulbecco's Modified Eagle's Medium DMSO Dimethyl sulfoxide
DNAJA3 DnaJ homolog subfamily A member 3 Dpt-lacZ Diptericin-lacZ
Drs-GFP Drosomycin-GFP
Dredd Death related ced-3/Nedd-2-like caspase Droj2 DnaJ-like-2
Ecc15 Erwinia carotovora carotovora 15 E. coli Escherichia coli
EDTA Ethylenediaminetetraacetic acid FCS Fetal calf serum
GFP Green fluorescence protein
GNBP Gram-negative bacteria-binding protein GRR Glycine-rich region
GS Gene search system
Gyc76c Gyanylyl cyclase at 76C
HEK293 Human embryonic kidney cells 293 HLH Helix loop helix motif
HOP Hsp70/Hsp90 organizing protein HPD Histidine-proline-aspartate HRP Horse radish peroxidase
HSC70-4 Heat shock protein 70 cognate 4 HSF1 Heat shock factor 1
HSP Heat shock protein
IgG Immunoglobulin G
IκB Inhibitor of kappa B
IKK IκB kinase
IL Interleukin
IL-1R Interleukin-1 receptor
Imd Immune deficiency
IP Immunoprecipitation
IRAK IL-1 receptor-associated kinase ird Immune response deficient KBD Kinase binding domain
KD Kinase domain
LB Luria-Bertani
LC-MS Liquid chromatography-mass spectrometry LPS Lipopolysaccharide
LZ Leucin-zipper motif
mAb Monoclonal antibody
MyD88 Myeloid differentiation primary gene 88 NAK NF-κB-activating kinase
NB Nutrient broth
NBD NEMO binding domain
NF-κB Nuclear factor kappa B NLS Nuclear localization signal
NP-40 Nonidet P-40
PBS Phosphate buffered saline PES 2-phenylethylene sulfonamide
PEST Proline, glutamimate, serine, threonine-rich sequence PGRP Peptidoglycan recognition proteins
PVDF Polyvinylidene difluoride
RHD Rel homology domain
RIP Receptor-interacting protein kinase RISC RNA-induced silencing complex
RT Room temperature SDS Sodium dodecyl sulfate siRNA Small interfering RNA
smFRET Single-molecule fluorescence resonance energy transfer
spz Spaetzle
SRD Signal-receiving domain S. saprophyticus Staphylococcus saprophyticus TA1 Transactivation domain 1
TAB TAK1-binding
TAD Transcription activation domain
TAK Transforming growth factor-β-activated kinase TBS Tris buffered saline
TIR Toll-IL-1R
TLR Toll-like receptor TNFα Tumor necrosis factor α
TRADD TNFR1-associated death domain protein TRAF TNF receptor-associated factor
UAS Upstream activation sequence UBD Ubiquitin-binding domain
1 Droj2 22 Droj2 RNAi 24 Droj2 RNAi 27 Droj2 31 34 HEK293 HSP70/ DNAJA3 NF-κB 37
DNAJA3 HEK293 IKKβ
IκBα NF-κB p65 39
HSP70 HEK293 NF-κB
42
HSP70 HEK293 IKKβ IκBα
NF-κB p65 45
HSP70 HEK293 IκBα NF-κB p65
48
DNAJA3 HSP70 53
HSPA1A HSPA8 HSPA9 HEK293
HSPA1A HSPA8 HSPA9 IκBα NF-κB p65 60 64 HSPA8 HSC70-4 71 HSC70-4 HSC70-4 73 HSC70-4 75 HSC70-4 77 79 83 90 107 122 123
2 (1) (2) (3) (4) NF-κB NF-κB
(5) NF-κB
(5) LPS lipopolysaccharide
flagellin TLR Toll-like receptor
NF-κB TNFα (tumor necrosis factor α)
IL (interleukin)-6
(6, 7) NF-κB
NF-κB (8–10)
NF-κB RelA NF-κB p65 RelB c-Rel NF-κB1
p50 p105 NF-κB2 p52 p100
NF-κB N RHD Rel homology domain
DNA (11–13) NF-κB
NF-κB RelA RelB c-Rel C
TAD Transcription activation domain p50 p52
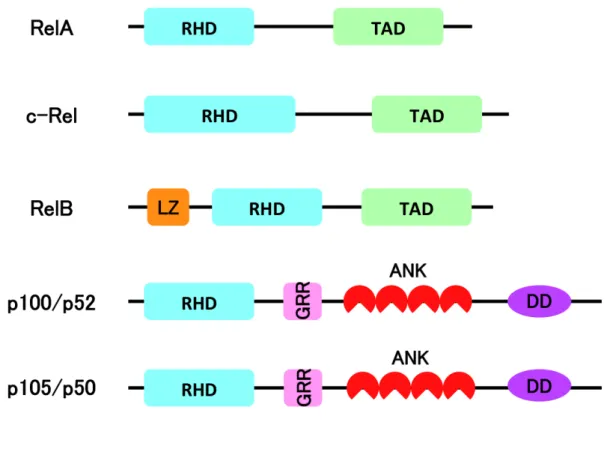
RelA RelB c-Rel (11–13) Fig. 1 NF-κB
DNA (14) NF-κB
IκB NF-κB IκB
IκB NF-κB NF-κB
(11, 12) IκB N SRD signal-receiving domain
glutamate-serine- and threonine-rich sequence ARD NF-κB
Fig. 2 IκB IκBα IκBβ IκBε
IκBα RelA p50 NF-κB RHD
Nuclear Localization Signal NLS
NF-κB (11, 12) IκBε RelA
c-Rel/RelA IκBβ RelA/p50
(8, 9, 12, 13) NF-κB p50 p52
p105 p100 C ankyrin repeat
IκBγ IκBδ IκB
(15) IκBγ p50 RelA c-Rel IκBδ RelB
(15, 17, 18) IκB IκBNS BCL3 IκB (19–21) NF-κB IκB ankyrin repeat (22) IκB NF-κB NF-κB
IKK IκB kinase IKK
2 IKKα IKKβ
IKKγ NEMO Fig. 3
IKK
DNA
IKKα IKKβ 50% 70%
N KD (kinase domain) LZ (leucine-zipper motif) HLH (helix loop helix motif) IKKα IKKβ LZ
HLH KD
(23) IKKα IKKβ C NBD
(NEMO binding domain) NEMO NEMO
HLX1 CC1 HLX2 CC2
LZ (leucine-zipper domain) ZF (zinc-finger
domain) (23) NF-κB NEMO CC2-LZ
ZF K63
IKKα IKKβ NEMO
HLX1 CC1 KBD (kinase binding domain) IKKα
IKKβ NBD IKK
(5) IKK
NF-κB TLR/IL-1R (IL-1 receptor) TNF-α
2 TLR/IL-1R TLR
IL-1R TIR (Toll-IL-1R) MyD88
(myeloid differentiation primary gene 88) MyD88 IRAK (IL-1
receptor-associated kinase) 1 IRAK4 TRAF6 (TNF
receptor-associated factor 6) (24) TRAF6
Ubc13/Uev1A K63
(25) TRAF6 TRAF6 (26), TAK1
(transforming growth factor-β-activated kinase 1)(27) NEMO(28) K63 .
TAK1 TAB (TAK1-binding) 2/3 NEMO
TAK1 IKK
177 181 IKKα 176 180
(23) IKK IκB SRD
32 36 IκB 48
(14)
IκBα SCFβ-TrCP
IKK IκB RelA (14,
29) NF-κB
TNF-α TNFR1 TNF-α
TRADD (TNFR1-associated death domain protein), TRAF2/5 c-IAP (cellular inhibitor of apoptosis protein) 1/2 RIP1 (receptor-interacting protein kinase 1)
(30). c-IAP1/2 RIP1 K11 K63 (31, 32) IL-1R/TLR TAK1 IKK . NF-κB NF-κB 1 10 TLR IL-1 TNF NF-κB NF-κB IKK
(12, 33) IKK IKK IKK NF-κB (18) NF-κB TLR Toll (34)
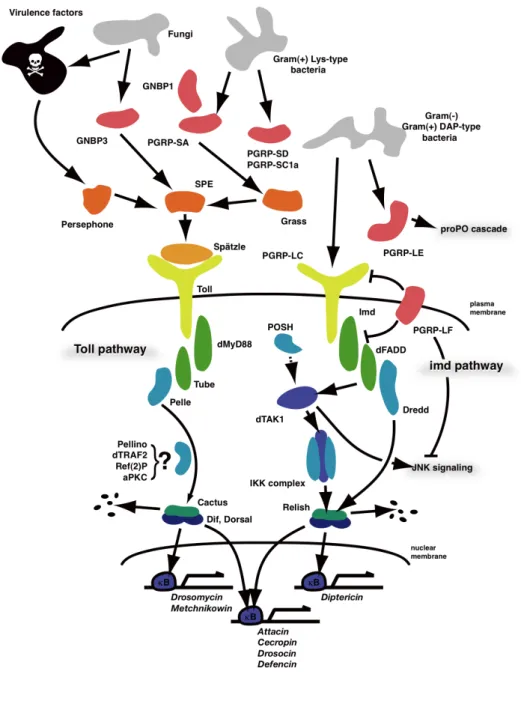
NF-κB Toll Imd 2 (35, 36) (Fig. 4)
Toll (35, 37)
Toll spaezle
(38–40) späzle Toll
dMyD88 Tube Pelle (41, 42)
IκB Cactus
(43, 44) Cactus
NF-κB Dif/Dosal
Drosomycin (45, 46)
Imd PGRP (Peptidoglycan recognition proteins)-LC
PGRP-LE (47–49)
Imd caspase-8 Dredd Death
related ced-3/Nedd-2-like caspase E3 Diap2
E2 (50, 51) Tak1
IKK (51)
IKK Imd NF-κB Relish
(52) Relish Dredd C Diptericin (53) NF-κB Toll Imd NF-κB TNF-α Fig. 5, 6 NF-κB
Gene Search System GS
GS UAS
upstream activation sequence
(54) UAS GAL4
GAL4 UAS
GAL4 GS
GAL4
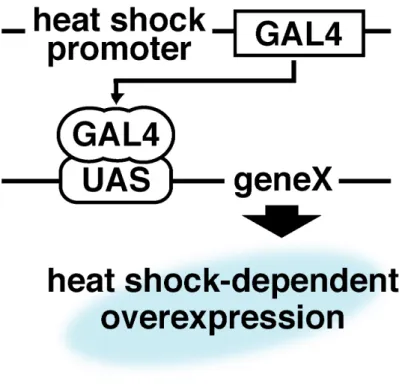
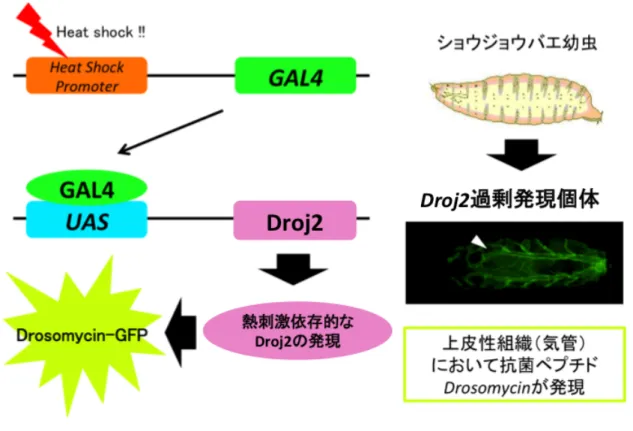
heat shock Fig. 7
GAL4 UAS gene
X
Drosomycin Diptericin lacZ GFP
Diptericin-lacZ Drosomycin-GFP Fig. 8
in vivo
PGRP-LE(55) Toll Gyc76C(56)
1 GS
Droj2 (CG8863) Fig. 9 Droj2
Drosomycin (57) Droj2
DnaJ J domain Zinc finger domain DnaJ C
403 DnaJ
(57) Fig. 9 DnaJ DnaK
ATPase
(58) DnaJ
DnaK (58) DnaJ DnaK
J domain − −
HPD DnaK ATPase
(58). Zinc finger domain CXXCXGXG 4
8 Cys 4 Cys
(59). DnaJ C DnaJ (58) DnaJ
HSP heat shock protein
70 (60, 61) HSP70 ATP (60) (60) DnaJ HSP70 ATPase HSP70 (61) (Fig. 11) DnaJ HSP70 (60, 61) HSP70 13 DnaJ 49 HSP70 DnaJ (61, 62) DnaJ J domain HSP70 DnaJ HSP70/DnaJ / / NF-κB
HSP90-HOP Hsp70/Hsp90 organizing protein OsCERK1
(63) NF-κB
HSP90-Cdc37 IKKα/β/γ IKK
TNFα NF-κB
(64) HSP70 IKKγ coiled-coil domain IKKγ
IKK TNFα NF-κB (65) / NF-κB / HSP70/DnaJ NF-κB
Figure 1 NF-κB
Rel homology domain RHD Transcription activation domain TAD Leucine zipper motif LZ Glycine-rich region GRR Ankyrin repeat
ANK Death domain DD TAD Rel
p52 p50
p100 p105 C NLS ANK
Figure 2 IκB
Ankyrin repeat ANK proline-glutamate-serine-threonine-rich
sequence (PEST) IκB ANK NF-κB
Figure 3 IKK
Kinase domain KD Leucine zipper LZ Helix loop helix motif HLH NEMO-binding domain NBD Kinase-binding domain KBD Ubiquitin-binding domain UBD Zinc finger motif ZF
IKKα IKKβ KD IKK
KD
IKKγ/NEMO KBD NBD IKKα/β
Figure 4 NF-κB
PGRP GNBP
Toll Imd
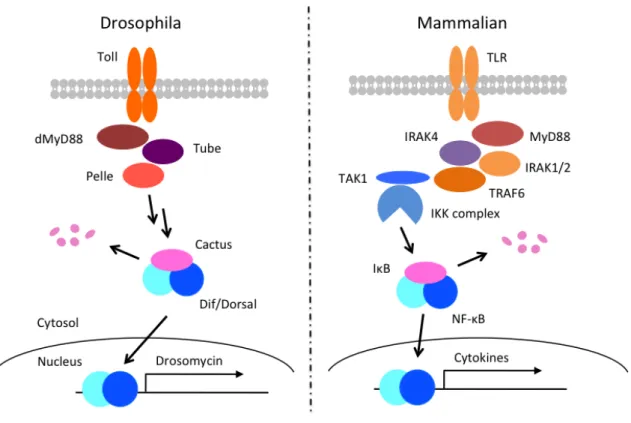
Figure 5 Toll TLR
Toll TLR
Toll dMyD88 Pelle Cactus Dif/Dorsal TLR MyD88 IRAK IκB NF-κB
Figure 6 Imd TNF-α
imd TNF-α
Imd dFADD Dredd
dTAK1 IKK Relish C Relish N RIP FADD
Figure 7 GAL4/UASシステム
GAL4 は酵母由来の転写活性化因子であり,UAS (upstream activation sequence) に結合してその下流の遺伝子 geneX を転写促進する.本探索系では heat-shock プロモーターの下流に GAL4 が連結されたショウジョウバエを GAL4 系統とし て,また UAS-geneX として GS 系統を用いた.
Figure 8
Diptericin-lacZ Dpt-lacZ Drosomycin-GFP
Drs-GFP hs GAL4 GS
Figure 9 GS Droj2
GS Droj2
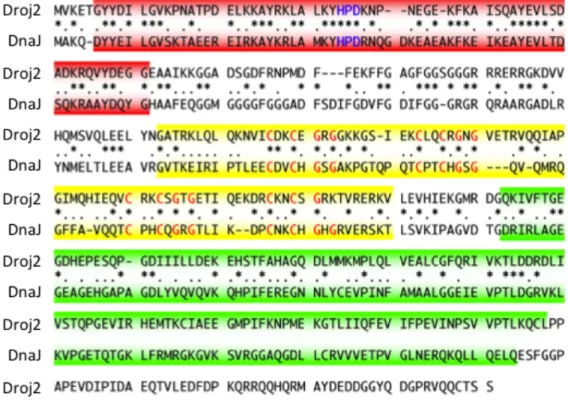
Figure 10 Droj2 E.coli DnaJ
Droj2 (CG8863) E.coli DnaJ DnaJ
DnaK DnaK ATPase
- - HPD DnaK
ATPase DnaJ
CXXCXGXG zinc finger DnaK
DnaJ C DnaJ
21
Nature Reviews Molecular Cell Biology 2010;11(8):579-592
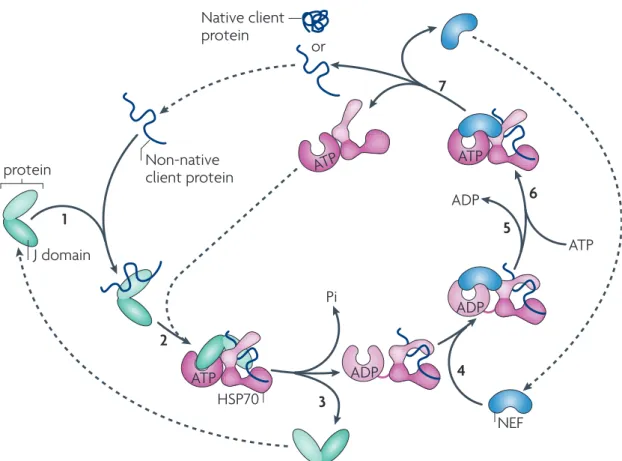
Figure 11 DnaJ HSP70
DnaJ HSP70 DnaJ
(J protein) HSP70 ATPase HSP70
Nature Reviews | Molecular Cell Biology
ATP ADP ADP ATP ATP ATP ADP or 1 2 3 4 5 6 7 Pi NEF J protein Non-native client protein
Native client protein a
HSP70
Adenine
nucleotide-binding cleft Hydrophobic
linker
Peptide-binding cleft
Lid ATPase domain Peptide-binding domain
b
J domain
J proteins drive the multifunctionality of HSP70s. Although it is possible to imagine that the versatility of HSP70 function could be achieved primarily through the amplification and diversification of HSP70 genes during evolution3, this does not seem to be the case. The number
of HSP70s in each cell is rather limited. However, J proteins often far outnumber HSP70s and NEFs in a cellular compartment12,13. For example, in mammals there is
one type of HSP70 in mitochondria and one type in the endoplasmic reticulum (ER), and four and six J proteins, respectively12,13. Overall, humans have only 11 HSP70s
and 13 NEFs, but 41 J proteins (FIG. 3; see Supplementary information S1 (figure)). In addition, and in contrast to HSP70, J proteins show a large degree of sequence and structural divergence (FIG. 3), consistent with the idea that they play a major part in driving the multifunctionality of the HSP70 machinery.
Diversity of J protein structure
The J domain is both the defining domain and the key to a functional interaction with HSP70s as it stimulates their ATPase activity12,13. However, many J proteins bear
little if any sequence or structural similarity outside this domain (FIG. 3; see Supplementary information S2 (figure))and increasing evidence indicates that these non-homologous regions are primary determinants of HSP70 function.
J domain — the common denominator. J proteins, by definition, contain a highly conserved ~70 amino acid signature region, the J domain, which is named after the founding member, Escherichia coli DnaJ (FIG. 4a). Particularly conserved is a His, Pro and Asp tripeptide (HPD), which is in a loop between the two main helices (helix II and helix III). This HPD motif is crucial for J domain function; that is, stimulation of HSP70’s ATPase activity. The exact mechanism of J domain-stimulated ATPase activity and the ensuing conform-ational changes resulting in stabilization of client interaction remain a matter of debate. However, it is established that exposed residues of the J domain form a surface for HSP70 interaction14,15. Crucial interactions
occur with HSP70’s ATPase domain and the adjacent flexible region, which links it to the client protein-binding domain (FIG. 2). These interactions are crucial for transmitting the conformation change necessary for closing the peptide-binding pocket15–20.
J protein groups, structure and classification. The J pro-tein family has often been referred to as the HSP40 family; but, as most members have a molecular weight that differs greatly from 40 kDa, we refer to them as J proteins throughout this Review. Despite the omni-present J domain, J proteins, as a group, are strikingly dissimilar, with various additional domains (FIG. 3, see Supplementary information S2 (figure)). Historically, J proteins have been divided into three classes (class I, II and III, also known as class A, B and C, respec-tively)13,21-23, with class I designation being based on the
motifs and domains present in E. coli DnaJ. Thus, by def-inition, class I J proteins have an N-terminal J domain, followed by a Gly and Phe-rich region, four repeats of the CxxCxGxG type zinc finger motif and a C-terminal
extension, which is now known to bind client pro-teins24–26. This type of C-terminal region is composed
of two barrel topology domains, C-terminal domain I (CTD I) and CTD II. CTD I has a hydrophobic pocket in which client proteins are thought to bind, as well as a zinc-finger domain extruding from it, which may
Figure 2 | Canonical model of the core HSP70 machinery’s mode of action in
protein folding and HSP70 structure. a | The mode of action of the heat shock 70 kDa
protein (HSP70) core machinery, based on in vitro refolding studies of denatured proteins. J proteins bind to client proteins through their peptide-binding domain (1) and interact with HSP70–ATP through their J domain (2). The client rapidly, but transiently,
interacts with the ‘open’ peptide-binding site of HSP70. ATP hydrolysis is stimulated by both the J domain and client, causing a conformational change in HSP70 that closes the helical lid over the cleft and stabilizes the client interaction, and the J protein then leaves the complex (3). A nucleotide exchange factor (NEF), which has a higher affinity for HSP70–ADP than HSP70–ATP, binds HSP70 (4). The ADP then dissociates through
distortion of the ATP-binding domain (5), after which ATP binds to HSP70 (6). The client is released because of its low affinity for HSP70–ATP (7). ATP binding to HSP70 is favoured as cellular ATP concentrations are typically much higher than those of ADP. If the native state of the client is not attained on release, the J protein rebinds to its exposed
hydrophobic regions and the cycle begins again. b | The structure of HSP70 with ADP bound to the nucleotide-binding domain135 (protein data bank code 2KHO). The ATPase
domain and peptide-binding domain are connected by a short, flexible, hydrophobic linker. These domains dock when in the ATP-bound state, which is also thought to displace the lid, allowing easy access and egress of the client protein from the cleft17,136.
Droj2
1 Droj2
Droj2
Droj2
Erwinia carotovora carotovora 15 Ecc15 Beauveria bassiana B. bassiana
(57) Fig. 12
Droj2 RNAi B. bassiana
Droj2 Droj2
Droj2 RNAi Droj2
Figure 12 Ecc15
Ecc15
1 3 6 12 24 48 72 mRNA
Droj2 RNAi PGRP-SA PGRP-SD PGRP-LC PGRP-LE (36) Droj2 RNAi GAL4/UAS Droj2
GAL4 c564-GAL4 UAS Droj2
RNA UAS-Droj2 RNAi II
UAS-Droj2 RNAi III Droj2
Droj2 GAL4 UAS GAL80 GAL80ts tub-GAL80ts GAL80ts 18°C GAL4 29°C GAL4 18°C 29°C Droj2 Oregon R yellow
c564>yellow
Imd NF-κB Relish RelishE20
Toll
spätzle spz spzrm7 Relish
spz
Fig. 13 Droj2 RNAi
Staphylococcus saprophyticus S. saprophyticus
Fig. 13A, D Escherichia coli
E. coli Ecc15 Oregon R yellow
Fig. 13B, C 2 Droj2 RNAi
Droj2 Droj2
Figure 13 Droj2
Droj2 c564>Droj2 RNAi (II) c564>Droj2 RNAi (III) Oregon R c564>yellow RelishE20, spzrm7
Ecc15 E. coli S. saprophyticus
72 A. B. Ecc15
C. E. coli D. S. saprophyticus
3 100%
Droj2 RNAi Droj2 NF-κB Droj2 Droj2 RNAi Droj2
total RNA Drosomycin
Diptericin mRNA PCR
Oregon R yellow
c564>yellow
Relish RelishE20
späzle spzrm7
Relish spz
PCR Fig. 14
Ecc15 Diptericin
Oregon R yellow Droj2
E. coli Diptericin Droj2 S. saprophyticus Drosomycin , Droj2 (Fig. 14) Droj2 NF-κB Imd
Figure 14 Droj2
Droj2 c564>Droj2
RelishE20, spzrm7 Ecc15 E. coli S.
saprophyticus 6
24 total RNA
Diptericin Drosomycin mRNA PCR A.
Ecc15 B. E. coli C. S. saprophyticus Diptericin
Drosomycin rpL32 *p
Droj2
Droj2 Imd
Droj2 Imd
Droj2 RNAi Droj2 Imd
Droj2 Imd
Imd Imd
Diptericin (66–68)
Imd Droj2 RNAi
Diptericin Imd
Droj2 Diptericin
Droj2
Imd PGRP-LE Imd Dredd Relish
PGRP-LE Imd Dredd Relish
Droj2 Imd
Diptericin Fig. 15
Droj2 Imd Relish
32 Figure 15 Droj2 RNAi
GAL4 Collagen (Cg)-GAL4 Imd
PGRP-LE imd Dredd Relish
Droj2 RNAi Diptericin PCR
A. PGRP-LE B. imd C. Dredd D. Relish
DNAJA3 Is Required for I!B Phosphorylation—Western blot analysis of human DNAJA3 revealed that flagellin-induced NF-!B accumulation in the nucleus was suppressed in DNAJA3 knockdown cells (Fig. 6, A and B). This finding indicates that DNAJA3 functions upstream of NF-!B nuclear translocation. Analysis of Drosophila Droj2 suggested that Droj2 works genet-ically downstream of Relish or in the regulation of Relish (Fig. 4, A–D). Relish protein contains the N-terminal Rel homology domain and the C-terminal I!B-like ankyrin repeat domain (57). We hypothesized that human Droj2 functions around I!B and NF-!B. Phosphorylated I!B is subjected to protein degra-dation, and phosphorylation of the NF-!B p65 subunit occurs with I!B dissociation and is important for its nuclear translo-cation (13). Western blot analysis for the phosphorylated I!B" and NF-!B p65 revealed that the increase in phosphorylated I!B" and p65 following flagellin stimulation was not observed in DNAJA3 knockdown cells (Fig. 6C). Consistent with this, the decrease in the amount of total I!B" protein following flagellin stimulation was not detected in DNAJA3 knockdown cells. Less I!B signal before stimulation in DNAJA3 knockdown cells
would be due to the fact that I!B is a transcriptional target of NF-!Bs (58). These findings suggest that DNAJA3 is required for the phosphorylation of I!B". IKK is the kinase responsible for NF-!B phosphorylation. Fig. 6D shows that overexpression of the catalytic IKK# subunit induced the phosphorylation of p65 and that phosphorylation was attenuated in DNAJA3 knockdown cells. This finding indicates that DNAJA3 func-tions downstream of IKK.
Discussion
Although the NF-!B signaling pathway is well studied because of its importance in many biologic processes, the com-plete picture of the complex molecular mechanisms of this pathway have not yet been elucidated. In this study, we identi-fied the cochaperone Droj2, which is involved in the Imd path-way, a Drosophila NF-!B pathpath-way, from our genome-wide gain-of-function screening in flies. Epistatic analysis revealed that Droj2 functions downstream of, or parallel to, NF-!B Rel-ish, and a cell culture assay revealed that Droj2 is prerequisite to the nuclear translocation of Relish, suggesting that Droj2 func-FIGURE 4. Droj2 functions genetically downstream of, or parallel to, PGRP-LE, imd, Dredd, and Relish. A–D, quantitative RT-PCR analysis of Diptericin expression following overexpression of PGRP-LE (A), imd (B), Dredd (C), and Relish (D) in larvae carrying UAS-lacZ or UAS-Droj2-RNAi-2. Cg-GAL4 was used to drive the Imd pathway components, and the level of Diptericin expression in each overexpression line was set to 1. The experiments were repeated two to three times and yielded similar results. Data were analyzed using Student’s t test, and values represent the mean ! S.E. of triplicate samples. *, p " 0.05; **, p " 0.01.
Droj2/DNAJA3 Regulates NF-!B Signaling in Drosophila/Humans
at TOHOKU UNIVERSITY on February 9, 2019
http://www.jbc.org/
Diptericin rpL32 (*p<0.05, **p<0.01; Student’s t test)
Droj2 Droj2 Droj2 RNAi Ecc15 E. coli NF-κB NF-κB 1 Imd Diptericin Droj2 RNAi
Diptericin Droj2 Imd
Droj2 Imd
Droj2 Imd Relish
Relish C IκB Rel-49
Imd Dredd caspase-8
C (53) RNA
II Drosophila IKK dIKK
Relish N (52, 69) dIKK
Relish Relish DNA
dIKK Relish Relish Droj2 Relish Relish Droj2 Droj2 Imd Droj2 HSP70 ATPase
RNA Argonaute Ago RNA
(70, 71) RNA Ago
HSP70/HSP40/HSP90 Ago
RNA RISC RNA-induced silencing complex
Relish DNA Dredd dIKK Relish
Droj2
Droj2 Imd
Drosomycin Drosomycin Imd (72) Droj2 Drosomycin Droj2 DnaJ 36 (62) DnaJ DnaJ Droj2 NF-κB Imd Diptericin NF-κB DnaJ NF-κB
HEK293 HSP70/ DNAJA3 NF-κB
Droj2 Droj2 Imd
Droj2 J
domain Zinc finger domain
50 DnaJ HSP40
DnaJ
Droj2 NF-κB
HEK293 (Human
Embryonic Kidney cells 293) DnaJ
TLR5 flagellin NF-κB DNAJA3 B7 C6 C8 C27 flagellin NF-κB (73) Droj2 DNAJA3 DNAJA3 HEK293 NF-κB NF-κB IκBα NF-κB p65 DNAJA3 NF-κB (73) DNAJA3 NF-κB IκBα NF-κB p65 NF-κB DNAJA3 NF-κB DNAJA3 HSP70
NF-κB DNAJA3 HSP70
NF-κB HSP70 HSP70
DNAJA3 HEK293 IKKβ IκBα NF-κB p65
Droj2 DNAJA3 IκBα
NF-κB p65 flagellin NF-κB
IκBα NF-κB p65 IKK IκBα
NF-κB (74) DNAJA3
IKK IκBα NF-κB p65
DNAJA3 HEK293
IKK 1 IKKβ
immunoprecipitation; IP IKKβ IκBα NF-κB p65
IP input
Non-Target siRNA DNJA3
DNAJA3 input IKKβ IκBα
NF-κB p65 DNAJA3
IKKβ IP
IκBα NF-κB p65 DNAJA3
IκBα NF-κB p65 (Fig. 16, 17)
DNAJA3 NF-κB p65 IKKβ IκBα NF-κB p65
Figure 16 DNAJA3 IKKβ IκBα NF-κB p65
Non-target DNAJA3 IKKβ
siRNA
41 Figure 17 Figure 16 ImageJ Input α-tubulin Non-Target siRNA 100% DNAJA3 siRNA
stimulated with the TLR5 ligand flagellin. We found that the NF-
k
B
reporter activity stimulated by flagellin was suppressed by PES in a
concentration-dependent manner (
Fig. 2
A). Next, we analyzed the
IKK
b
/I
k
B
a
/NF-
k
B p65 complex under this condition.
Co-immunoprecipitation experiments revealed that the interactions
of IKK
b
with I
k
B
a
and NF-
k
B p65 were inhibited by PES treatment
(
Fig. 2
B and C). Consequently, the phosphorylation of NF-
k
B p65
induced by flagellin stimulation was suppressed by PES treatment,
whereas the phosphorylation of I
k
B
a
was not impaired (
Fig. 2
D and
E). These findings suggest that HSP70s regulate NF-
k
B activity
through stabilizing the IKK
b
/I
k
B
a
/NF-
k
B p65 complex.
3.3. DNAJA3 interacted with some HSP70 family proteins
The human HSP70 family has 13 members, and PES inhibits
HSP70 [
17
,
18
]. Therefore, we sought to identify the HSP70 family
proteins interacting with DNAJA3 in vivo. For this purpose,
Flag-tagged DNAJA3 protein was transiently expressed in HEK293 cells,
and its interacting proteins were co-immunoprecipitated from the
cell lysate using an anti-Flag antibody (
Fig. 3
A). The interacting
A
B
0 20 40 60 80 100 120 Relativ e Intensity (% of control) Input siRNA NF- p65 0 20 40 60 80 100 120 Relativ e Intensity (% of control) siRNA NF- p65 NF- p65 DNAJA3 -tubulin siRNA InputFig. 1. Western blotting analysis of the IKK
b
/Ik
Ba
/NF-k
B p65 complex under DNAJA3 knockdown. (A) HEK293 cells were transfected with DNAJA3 or control (non-target) siRNA. Celllysates (Input) were immunoprecipitated with anti-IKK
b
antibody (IP). Western blotting analysis was performed using anti-IKKb
, Ik
Ba
, NF-k
B p65, DNAJA3, anda
-tubulinanti-bodies. (B) Quantifications of the band intensity in A. The relative values normalized by the intensity of control cells are shown. Similar results were obtained from two or three independent experiments (data not shown).
1 3 10 PES 0 20 40 60 80 100 120 NF -re p o rt er ac ti vi ty Flagellin (
A
p-NF- p65 p-NF- p65 p-HSP70 Actin Flagellin 0.1 0.3 1 3 10 PES (B
0 20 40 60 80 100 120 R ela ti vei n te n si ty ( p-NF- -1 3 10 PES 0.3 0.1 ( FlagellinD
NF- p65 Actin InputE
0 20 40 60 80 100 120 Rel ati ve In ten si ty Input NF- p65C
0 20 40 60 80 100 120 Re lati ve Int ensi ty NF- p65Fig. 2. Effects of the HSP70 inhibitor on NF-
k
B activity and the IKKb
/Ik
Ba
/NF-k
B p65 complex. (A) Luciferase reporter assay in HEK293 cells transfected with NF-k
B-Luc, treated withPES, and stimulated with flagellin. Values represent the mean ± S.E. of triplicate samples. (B) Western blot analysis of cell lysates after the PES-treatment. The following antibodies were used: anti-IKK
b
, anti-Ik
Ba
, antieNFek
B p65, and anti-actin. (C) Quantifications of the band intensity in B. The relative values normalized by the intensity of control(DMSO-treated) cells are shown. (D) Cell lysates (Input) were immunoprecipitated with anti-IKK
b
antibody (IP). Western blotting analysis was performed using the following antibodies:HSP70 HEK293 NF-κB DnaJ 1 DNAJA3 IKKβ/IκBα/NF-κB p65 NF-κB p65 NF-κB DnaJ HSP70 / DNAJA3 NF-κB HSP70 NF-κB HSP70 NF-κB HSP70 NF-κB Elam-Luc
pRL-TK HEK293 HSP70 pifithrin-µ (PES)
flagellin NF-κB
Elam-Luc
pRL-TK NF-κB
PES HSP70 HSPA1A HSPA1B
(75) HSP70 (76) DMSO flagellin NF-κB PES NF-κB Fig. 18 HSP70 NF-κB
Figure 18 HSP70 NF-κB HEK293 2 Elam-Luc pRL-TK HSP70 PES TLR5 flagellin NF-κB NF-κB DMSO 100% PES flagellin
HSP70 HEK293 IKKβ IκBα NF-κB p65 HSP70 DNAJA3 flagellin NF-κB DNAJA3 IKKβ/IκBα/NF-κB p65 NF-κB HSP70 DNAJA3 IKKβ/IκBα/NF-κB p65
HSP70 HEK293 IKKβ IκBα
NF-κB p65
PES HEK293 IKKβ
IP IKKβ IκBα NF-κB p65
input
DMSO PES
IKKβ IP
IκBα NF-κB p65 PES (Fig. 19,
20)
HSP70 DNAJA3 IKKβ IκBα NF-κB p65
DNAJA3
HSP70 input NF-κB p65
NF-κB p65 DNAJA3
Figure 19 HSP70 IKKβ IκBα NF-κB p65
DMSO PES IKKβ
Figure 20 Figure 18 ImageJ Input Actin DMSO 100% PES siRNA
stimulated with the TLR5 ligand flagellin. We found that the NF-
k
B
reporter activity stimulated by flagellin was suppressed by PES in a
concentration-dependent manner (
Fig. 2
A). Next, we analyzed the
IKK
b
/I
k
B
a
/NF-
k
B p65 complex under this condition.
Co-immunoprecipitation experiments revealed that the interactions
of IKK
b
with I
k
B
a
and NF-
k
B p65 were inhibited by PES treatment
(
Fig. 2
B and C). Consequently, the phosphorylation of NF-
k
B p65
induced by flagellin stimulation was suppressed by PES treatment,
whereas the phosphorylation of I
k
B
a
was not impaired (
Fig. 2
D and
E). These findings suggest that HSP70s regulate NF-
k
B activity
through stabilizing the IKK
b
/I
k
B
a
/NF-
k
B p65 complex.
3.3. DNAJA3 interacted with some HSP70 family proteins
The human HSP70 family has 13 members, and PES inhibits
HSP70 [
17
,
18
]. Therefore, we sought to identify the HSP70 family
proteins interacting with DNAJA3 in vivo. For this purpose,
Flag-tagged DNAJA3 protein was transiently expressed in HEK293 cells,
and its interacting proteins were co-immunoprecipitated from the
cell lysate using an anti-Flag antibody (
Fig. 3
A). The interacting
A
B
0 20 40 60 80 100 120 Relativ e Intensity (% of control) Input siRNA NF- p65 0 20 40 60 80 100 120 Relativ e Intensity (% of control) siRNA NF- p65 NF- p65 DNAJA3 -tubulin siRNA InputFig. 1. Western blotting analysis of the IKK
b
/Ik
Ba
/NF-k
B p65 complex under DNAJA3 knockdown. (A) HEK293 cells were transfected with DNAJA3 or control (non-target) siRNA. Cell lysates (Input) were immunoprecipitated with anti-IKKb
antibody (IP). Western blotting analysis was performed using anti-IKKb
, Ik
Ba
, NF-k
B p65, DNAJA3, anda
-tubulin anti-bodies. (B) Quantifications of the band intensity in A. The relative values normalized by the intensity of control cells are shown. Similar results were obtained from two or three independent experiments (data not shown).1 3 10 PES 0 20 40 60 80 100 120 NF -re p o rt er ac ti vi ty Flagellin (
A
p-NF- p65 p-NF- p65 p-HSP70 Actin Flagellin 0.1 0.3 1 3 10 PES (B
0 20 40 60 80 100 120 R ela ti vei n te n si ty ( p-NF- -1 3 10 PES 0.3 0.1 ( FlagellinD
NF- p65 Actin InputE
0 20 40 60 80 100 120 Rel ati ve In ten si ty Input NF- p65C
0 20 40 60 80 100 120 Re lati ve Int ensi ty NF- p65Fig. 2. Effects of the HSP70 inhibitor on NF-
k
B activity and the IKKb
/Ik
Ba
/NF-k
B p65 complex. (A) Luciferase reporter assay in HEK293 cells transfected with NF-k
B-Luc, treated with PES, and stimulated with flagellin. Values represent the mean ± S.E. of triplicate samples. (B) Western blot analysis of cell lysates after the PES-treatment. The following antibodies were used: anti-IKKb
, anti-Ik
Ba
, antieNFek
B p65, and anti-actin. (C) Quantifications of the band intensity in B. The relative values normalized by the intensity of control (DMSO-treated) cells are shown. (D) Cell lysates (Input) were immunoprecipitated with anti-IKKb
antibody (IP). Western blotting analysis was performed using the following antibodies: anti-phospho-IKKa
/b
, IKKb
, phospho-Ik
Ba
, Ik
Ba
, phosphoeNFek
B p65, NF-k
B p65, HSP70, and actin antibodies. (E) Quantification of the band intensity in D. The relative values normalized by the intensity of control cells are shown. Similar results were obtained from two or three independent experiments (data not shown).HSP70 HEK293 IκBα NF-κB p65 HSP70 DNAJA3 IKKβ/IκBα/NF-κB p65 NF-κB HSP70 IKKβ/IκBα/NF-κB p65 NF-κB IκBα NF-κB p65
PES flagellin HEK293
IκBα NF-κB p65
DMSO flagellin
IκBα NF-κB p65
PES flagellin NF-κB p65
Fig. 21, 22 IκBα
PES Fig. 21 DMSO
IκBα flagellin IκBα
PES IκBα Fig. 21 HSP70 NF-κB p65 NF-κB DNAJA3 IκBα NF-κB p65 (73) Fig. 23 HSP70 NF-κB p65 IKK HSP90 (64, 77) DNAJA3 HSP90 DNAJA3
Figure 21 HSP70 IκBα NF-κB p65
PES HEK293 flagellin
IKKα (Ser176) /IKKβ (Ser177) IκBα (Ser32) NF-κB p65 (Ser536)
flagellin
Figure 22 Figure 21 ImageJ NF-κB p65 (Ser356) NF-κB p65 DMSO flagellin 100% flagellin
stimulated with the TLR5 ligand flagellin. We found that the NF-
k
B
reporter activity stimulated by flagellin was suppressed by PES in a
concentration-dependent manner (
Fig. 2
A). Next, we analyzed the
IKK
b
/I
k
B
a
/NF-
k
B p65 complex under this condition.
Co-immunoprecipitation experiments revealed that the interactions
of IKK
b
with I
k
B
a
and NF-
k
B p65 were inhibited by PES treatment
(
Fig. 2
B and C). Consequently, the phosphorylation of NF-
k
B p65
induced by flagellin stimulation was suppressed by PES treatment,
whereas the phosphorylation of I
k
B
a
was not impaired (
Fig. 2
D and
E). These findings suggest that HSP70s regulate NF-
k
B activity
through stabilizing the IKK
b
/I
k
B
a
/NF-
k
B p65 complex.
3.3. DNAJA3 interacted with some HSP70 family proteins
The human HSP70 family has 13 members, and PES inhibits
HSP70 [
17
,
18
]. Therefore, we sought to identify the HSP70 family
proteins interacting with DNAJA3 in vivo. For this purpose,
Flag-tagged DNAJA3 protein was transiently expressed in HEK293 cells,
and its interacting proteins were co-immunoprecipitated from the
cell lysate using an anti-Flag antibody (
Fig. 3
A). The interacting
A
B
0 20 40 60 80 100 120Relativ
e
Intensity
(%
of
control)
Input
siRNANF-
p65
0 20 40 60 80 100 120Relativ
e
Intensity
(%
of
control)
siRNANF-
p65
NF- p65 DNAJA3 -tubulin siRNA InputFig. 1. Western blotting analysis of the IKK
b
/I
k
B
a
/NF-
k
B p65 complex under DNAJA3 knockdown. (A) HEK293 cells were transfected with DNAJA3 or control (non-target) siRNA. Cell
lysates (Input) were immunoprecipitated with anti-IKK
b
antibody (IP). Western blotting analysis was performed using anti-IKK
b
, I
k
B
a
, NF-
k
B p65, DNAJA3, and
a
-tubulin
anti-bodies. (B) Quantifications of the band intensity in A. The relative values normalized by the intensity of control cells are shown. Similar results were obtained from two or three
independent experiments (data not shown).
1 3 10 PES 0 20 40 60 80 100 120 NF -re p o rt er ac ti vi ty Flagellin (
A
p-NF- p65 p-NF- p65 p-HSP70 Actin Flagellin 0.1 0.3 1 3 10 PES (B
0 20 40 60 80 100 120 R ela ti vei n te n si ty ( p-NF- -1 3 10 PES 0.3 0.1 ( FlagellinD
NF- p65 Actin InputE
0 20 40 60 80 100 120 Rel ati ve In ten si ty Input NF- p65C
0 20 40 60 80 100 120 Re lati ve Int ensi ty NF- p65Fig. 2. Effects of the HSP70 inhibitor on NF-
k
B activity and the IKK
b
/I
k
B
a
/NF-
k
B p65 complex. (A) Luciferase reporter assay in HEK293 cells transfected with NF-
k
B-Luc, treated with
PES, and stimulated with flagellin. Values represent the mean ± S.E. of triplicate samples. (B) Western blot analysis of cell lysates after the PES-treatment. The following antibodies
were used: anti-IKK
b
, anti-I
k
B
a
, antieNFe
k
B p65, and anti-actin. (C) Quantifications of the band intensity in B. The relative values normalized by the intensity of control
(DMSO-treated) cells are shown. (D) Cell lysates (Input) were immunoprecipitated with anti-IKK
b
antibody (IP). Western blotting analysis was performed using the following antibodies:
anti-phospho-IKK
a
/
b
, IKK
b
, phospho-I
k
B
a
, I
k
B
a
, phosphoeNFe
k
B p65, NF-
k
B p65, HSP70, and actin antibodies. (E) Quantification of the band intensity in D. The relative values
normalized by the intensity of control cells are shown. Similar results were obtained from two or three independent experiments (data not shown).
Figure 23 DNAJA3 HEK293 Flaggelin
IκBα NF-κB p65
DNAJA3 HEK293 flagellin
IκBα (Ser32) NF-κB p65 (Ser536)
DNAJA3 HSP70 HSP70 DNAJA3 IKKβ/IκBα/NF-κB p65 NF-κB p65 NF-κB HSP70 13 (78) DnaJ (61) DnaJ C DnaJ HSP70 DnaJ 49 DnaJ NF-κB HSP70 DnaJ HEK293 IP LC-MS DNAJA3 HSP70
C FLAG DNAJA3 DNAJA3-FLAG
HEK293 FLAG IP FLAG SDS-PAGE LC−MS input Empty DNAJA3-FLAG Fig. 24 FLAG IP Empty DNAJA3-FLAG Fig. 24
DNAJA3-FLAG
HSP70
70 kDa * LC-MS
DNAJA3-FLAG co-IP HSP70 HSPA1A HSPA8 HSPA9
ARALAR1/2 Ca
PABPC1 pre-mRNA A
XRCC6 DNA
AIFM1 DDX3X RNA
LMNA A SYNCRIP pre-mRNA
DNAJA3 HSPA1A HSPA8 HSPA9
HSPA1A HSPA8 HSPA9
HSP70 (78) DNAJA3
(79)
DNAJA3 HSPA1A HSPA8 HSPA9
HSP70 HSPA1A
HSPA8 (78) HEK293 DNAJA3
flagellin HSP70
Figure 24 DNAJA3-FLAG FLAG IP SDS-PAGE
C FLAG DNAJA3 HEK293
FLAG IP SDS-PAGE
DNAJA3-FLAG
HSPA1A HSPA8 HSPA9 HEK293 NF-κB
HSP70 HSPA1A HSPA8
HSPA9 DNAJA3 HSP70
DNAJA3 NF-κB
HSPA1A HSPA8 HSPA9 HEK293
NF-κB Elam-Luc pRL-TK TLR5 flagellin NF-κB HSP70 NF-κB Non-Target siRNA TLR5 MyD88 siRNA Non-Target siRNA flagellin NF-κB
MyD88 siRNA flagellin
NF-κB HSPA1A HSPA8 HSPA9
siRNA NF-κB
Fig. 25 NF-κB
siRNA siRNA
HSP70
siRNA Fig. 26
siRNA HSPA1A #1 HSPA8 #1 HSPA9 #2 NF-κB
HSP70 flagellin
NF-κB HSPA1A HSPA8
HSPA9 NF-κB
Figure 25 HSPA1A HSPA8 HSPA9 NF-κB
HSPA1A HSPA8 HSPA9 siRNA HEK293 2
Elam-Luc pRL-TK TLR5
flagellin NF-κB
NF-κB
Non-Target siRNA 100%
Figure 26 HSPA1A HSPA8 HSPA9
HSPA1A HSPA8 HSPA9 siRNA HEK293 total
RNA PCR mRNA
Non-target siRNA 1
HSPA1A HSPA8 HSPA9 IκBα NF-κB p65
HSPA1A HSPA8 HSPA9 flagellin NF-κB
HSP70 NF-κB IκBα NF-κB p65
HSPA1A #1 HSPA8 #1
HSPA9 #2 siRNA flagellin
IκBα NF-κB p65
Non-Target siRNA
flagellin IKKα/β NF-κB p65 IκBα IκBα
flagellin MyD88
HSP70 HSPA1A HSPA8
flagellin NF-κB p65
Fig. 27 HSPA9 flagellin
NF-κB p65 IκBα IκBα HSP70 HSP70 DNAJA3 DNAJA3 Non-Target siRNA HSP70 DNAJA3 Fig. 27
Fig. 27 DNAJA3
HSPA1A HSPA8
NF-κB p65
HSP70 DNAJA3 HSPA1A
Figure 27 HSPA1A HSPA8 HSPA9 IκBα NF-κB p65
HSPA1A HSPA8 HSPA9 siRNA HEK293 flagellin
IKKα (Ser176) /IKKβ (Ser177) IκBα (Ser32) NF-κB p65 (Ser536)
Droj2 DNAJA3 NF-κB IκBα NF-κB p65 NF-κB DNAJA3 HSP70 NF-κB HSP70 flagellin NF-κB NF-κB NF-κB p65 HSP70 NF-κB p65 NF-κB DNAJA3 HSP70 IKKβ IκBα NF-κB p65 DNAJA3 HSP70 IKKβ/IκBα/NF-κB p65 NF-κB p65 (80) C TA1 Ser536 Ser536 TNFα IL-1 LPS (81, 82) IKKα IKKβ (81) HSP70 IKKβ NF-κB p65 NF-κB p65 Ser536 IKK
(83, 84) HSP70 DNAJA3 IκBα NF-κB p65 (73) HSP70 NF-κB p65 IKK HSP90 (64, 77) DNAJA3 HSP90 (85) DNAJA3 HSP90 IKK DNAJA3 HSP70 HSP90 DNAJA3 HSP70 NF-κB HSP70/DnaJ / (71, 86–88)
HSP70/DNAJA3 IKKβ IKKβ/IκBα/NF-κB
p65 DNAJA3
HSP70 IKKβ IκBα NF-κB p65
Fig.16 Fig.19 2 IKKβ
IκBα NF-κB p65 HSP70 HSP90 -(89) HSP90 HSP90 HSP90
HSP90 (89)
HSP70 ATP HSP90
(90, 91) HSP70 HSP90
DNAJA3 IKKβ IκBα NF-κB p65
HSP70/DnaJ HSP70 1 HSPA8 DNAJC6 ATPase (92–94) HSP70/DnaJ HSP70 DnaJ HSP70/DnaJ NF-κB HSP70 DnaJ NF-κB HSP70 DnaJ DNAJA3 HSP70 HEK293 HSPA1A
HSPA8 HSPA9 DNAJA3 HSPA1A
HSP70 pH
HSF1 heat shock factor 1 (95, 96)
HSPA1A
(97, 98) (78) HSPA8
HSP70
(99,
100) HSPA9 HSP70
(101, 102) HSPA1A HSPA8 HSPA9
HSP70 (78) DNAJA3
(79) DNAJA3 HSPA1A HSPA8 HSPA9
HSP70 HSPA1A HSPA8
(78) flagellin HEK293
HSP70 DNAJA3
DNAJA3 HSPA1A HSPA8 HSPA9
flagellin NF-κB HSP70 NF-κB NF-κB IκBα NF-κB p65 HSPA1A HSPA8 NF-κB p65 HSP70 NF-κB
HSPA1A HSPA8 IKKβ/IκBα/NF-κB p65
HSPA9 NF-κB p65
p65 HSPA9 flagellin NF-κB NF-κB (103, 104) flagellin NF-κB HSPA9 NF-κB 1 10 TLR (6, 7) IL-1 TNF (5) NF-κB HSP70/DnaJ NF-κB NF-κB TLR/IL-1R TNF-α IKK flagellin TLR5 NF-κB
NF-κB HSPA1A, HSPA8 DNAJA3
/ NF-κB
HSP (105) (106–108) (109) (110) (111, 112) (113, 114) LPS HSP70 (115) NF-κB NF-κB HSP NF-κB HSP70 DNAJA3 IKKβ/IκBα/NF-κB p65 NF-κB p65 NF-κB NF-κB
HSPA1A, HSPA8 DNAJA3
/ NF-κB
NF-κB
HSPA8 HSC70-4
DNAJA3
HSP70 IKKβ/IκBα/NF-κB p65 NF-κB p65
NF-κB DNAJA3 13
HSP70 HSPA1A HSPA8 HSPA9
HSP70 HSPA1A HSPA8 NF-κB p65 NF-κB HSP70 HSP70 NF-κB HSP70 HSPA8
HSC70-4 Heat shock protein 70 cognate 4 Table 1
HSC70-4 Droj2
(116) HSC70-4 Droj2
Table 1 HSP70
BLAST https://blast.ncbi.nlm.nih.gov/Blast.cgi HSP70
HSC70-4 HSC70-4 NF-κB HSPA8 HSC70-4 HSC70-4 RNAi HSC70-4 (117) GAL4
c564-GAL4 UAS HSC70-4 RNA
UAS-HSC70-4 RNAi GAL4
tub-GAL80ts 18°C 29°C HSC70-4 HSC70-4 RNAi total RNA HSC70-4 PCR HSC70-4 2 HSC70-4 Fig. 28
Figure 28 HSC70-4 HSC70-4 HSC70-4 HSC70-4 PCR HSC70-4 mRNA rp49 mRNA 1
HSC70-4
HSC70-4 HSC70-4
HSC70-4 RNAi
Ecc15 8
GFP RNAi Imd
NF-κB Relish relishE20
Relish HSC70-4 RNAi 1 #1 Fig. 29 Ecc15 Relish 1 HSC70-4 RNAi #1 #2 HSC70-4 RNAi #1 HSC70-4 Droj2 HSC70-4 RNAi 2 2 HSC70-4
Figure 29 HSC70-4
HSC70-4
Ecc15 8 .
. Ecc15 3
1.0 *p 0.05; log-rank
HSC70-4 HSC70-4 Diptericin HSC70-4 Diptericin HSC70-4 RNAi Diptericin HSC70-4
total RNA Diptericin mRNA
PCR GFP Ecc15 Diptericin HSC70-4 1 (#1) Diptericin Fig, 30 HSC70-4 1 (#2) Ecc15 Diptericin (#1) Ecc15 Diptericin HSC70-4 Diptericin HSC70-4 RNAi 2 Diptericin HSC70-4
Figure 30 HSC70-4 Diptericin
HSC70-4
Ecc15 6 total
RNA Diptericin mRNA PCR
Diptericin rp49 *p 0.05;
HSP70 HSPA8 HSC70-4 HSC70-4 Ecc15 HSC70-4 Diptericin HSC70-4 Imd HSP70 NF-κB HSC70-4 RNAi 2 Diptericin RNA HSC70-4 (118) Fig. 31 HSC70-4 Droj2 (116) Imd HSC70-4
Droj2 HSC70-4 Imd HSC70-4 Imd HSC70-4 Imd HSC70-4 Imd Toll HSC70-4 HSP70 HSC70-4 NF-κB HSP70 NF-κB HSP70 HSP70 HSP70 NF-κB HSC70-4 NF-κB HSC70-4 Droj2 NF-κB
Figure 31 HSC70-4
NF-κB
/ NF-κB
Droj2
Droj2 RNAi Droj2
Droj2 RNAi
Diptericin Droj2 Imd
Droj2
Imd Relish
Dredd Relish C dIKK Relish
Relish Droj2 RNAi Relish Relish Droj2 Droj2 Imd Droj2 Drosomycin Droj2 Toll Imd DnaJ 36
NF-κB DnaJ
DnaJ RNAi
NF-κB
Droj2 J domain Zinc finger domain
50 DnaJ DnaJ Droj2 NF-κB HEK293 DnaJ TLR5 flagellin NF-κB Droj2 DNAJA3 DNAJA3 IκBα NF-κB p65 NF-κB DNAJA3 NF-κB IκBα NF-κB p65 NF-κB DNAJA3 NF-κB DNAJA3 HSP70 NF-κB HSP70 DNAJA3 HSP70 HSP70 flagellin NF-κB NF-κB NF-κB p65 HSP70 NF-κB p65 NF-κB DNAJA3
HSP70 IKKβ IκBα NF-κB p65 DNAJA3 HSP70 IKKβ/IκBα/NF-κB p65 DNAJA3 HSP70 IKKβ/IκBα/NF-κB p65 1 HSP70 DNAJA3 IKKβ 1
single-molecule fluorescence resonance energy transfer; smFRET
(119, 120) FRET 2
(121) IKKβ
HSP70 DNAJA3 IKKβ IκBα NF-κB p65
HSP70 NF-κB p65 IKKβ/IκBα/NF-κB p65
NF-κB p65 IKK
IKKε NAK NF-κB-activating kinase
(83, 84) HSP70
HSP70
HSP70 DNAJA3 NF-κB
HSP70/DnaJ HSP70 DnaJ
NF-κB HSP70 DnaJ
DNAJA3 HSP70
HEK293 HSPA1A HSPA8 HSPA9 DNAJA3
HSP70 DNAJA3
DNAJA3 HSP70
NF-κB HSPA1A
HSPA8 NF-κB p65 NF-κB
HSPA1A HSPA8 IKKβ/IκBα/NF-κB p65
HSP70 HSPA9 NF-κB p65 NF-κB HSPA9 NF-κB HSP70 NF-κB HSP70 HSP70 HSPA8 HSP70 HSC70-4 HSC70-4
Ecc15 Ecc15 Diptericin HSC70-4 Imd HSP70 NF-κB HSC70-4 Droj2 Imd HSC70-4 Droj2 HSC70-4 Imd HSC70-4 Imd HSC70-4 Imd Toll HSC70-4 HSP70 NF-κB HSP70 NF-κB Toll Imd HSP70 HSP70 NF-κB NF-κB HSP70/DnaJ
flagellin TLR5 NF-κB HSP70/DNAJA3 / NF-κB / HSP70/DnaJ NF-κB HSPA1A/HSPA8 DNAJA3 HSC70-4 Droj2 NF-κB HSP70/DnaJ 1 (Fig. 32) HSP70/DnaJ NF-κB NF-κB NF-κB
1. / 10.5% 4% 6.5% 4-0.3% 1% 25°C 18°C 29°C 2. 2-1.
c564-GAL4 tub-GAL80ts UAS-yellow UAS-GFP RNAi
UAS-Droj2 RNAi UAS-HSC70-4 RNAi
Oregon R ( wild type ) RelishE20/ RelishE20 spzrm7/spzrm7
w;c564-GAL4/c564-GAL4;tub-GAL80ts/tub-GAL80ts w;+/+;UAS-Droj2 IR/UAS-Droj2 IR (VDRC #23637) w; UAS-Droj2 IR/UAS-Droj2 IR;+/+ (VDRC #23638) yw;+/+;UAS-yellow/UAS-yellow (Bloomington #3043) w;+/+;UAS-GFP IR/UAS-GFP IR (Bloomington #9383)
w;Cg-GAL4/GFP-CyO;+/+ Bloomington UAS-Dredd on 3rd chromosome P. Meier UAS-PGRP-LE 13-15-1 on 3rd chromosome UAS-Relish on 2nd chromosome
UAS-Imd on 2nd chromosome
UAS-HSC70-4 RNAi R1 (NIG #4264 R-1) UAS-HSC70-4 RNAi R2 (NIG #4264 R-2)
2-2.
10-15 mL 1.0 mL
2 mL 3,600 g, 5 min, RT
1 mL 2,000 g 5 min RT
1 mL GeneQuant pro GE Healthcare
OD600 OD600≒1
1 1 70 nL
Narishige PC-10 Drummond
Scientific company 3-000-203-G/X Heater Level No.1 70.0 No.2 58.0 Nanoject Ⅱ Drummond Scientific company 3-000-204
OD600
Escherichia coli (K-12) OD600≒1.0 LB 37°C
Erwinia carotovora carotovora 15 OD600≒1.0 LB 30°C
2-3. 3-7 25 29°C 7 3 1 3 2-4. LB LB plate
LB Broth Miller Nacalai tesque 20068-75 12.5 g MilliQ H2O 500 mL 121°C 20
LB plate LB Broth Miller 5.0 g Agar Nacarai tesque
01028-85 3.0 g MilliQ H2O 200 mL 121°C 20
10 cm plate 10
2-5. NB Nutrient Broth NB plate
Beef extract Oxoid 1.5 g Special Peptone Oxoid 2.5 g MilliQ H2O 500
mL pH 7 121°C 20
NB plate beef extract 0.6 g special peptone 1.0 g MilliQ
H2O 200 mL pH 7 Agar 3.0 g
121°C 20 10 cm 10
3-1. Trizol total RNA total RNA 10 03961CK28 TRIzol (Invitrogen) 500 µL total RNA TRIzol 500 µL (Nacalai tesque) 150 µL 6,000 rpm 30
Bertin Technologies Precellys 24 5
16,000 g, 15 min, 4°C 300 µL
(Nacalai tesque) 300 µL
RNA 5 (16,000 g, 15 min, 4°C)
DEPC 75% 100% Nacarai
tesque :DEPC =3:1 400 µL (16,000 g, 5 min, 4°C)
75% 400 µL (16,000 g, 5 min, 4°C)
30 µL RNase, DNase-free
RNA RNA 1.5 µL NanoDrop
2000 Thermo scientific OD260 OD260=1
40 mg/mL RNA
3-2. HEK293 total RNA
total RNA Quick-RNA Micro-Prep kit ZYMO RESEARCH
ZR RNA Buffer Zymo-Spin IC Column 12,000 g 1
min RT Flow-through RNA wash buffer 700 µL
12,000 g 30 sec RT Flow-through
RNA wash buffer 400 µL 12,000 g 30 sec RT Flow-through 12,000 g 2 min RT
wash buffer RNase-free 1.5 mL
DNase/RNase-free water 10 µL 1
20,400 g 30 sec RT RNA
RNA 1.5 µL NanoDrop 2000 OD260
OD260=1 40 mg/ml RNA
3-3. 1st strand cDNA
RNA 1.0 µg oligo (dT)15 primer Promega 1.0 µL RNase, DNase-free
12.5 µL 70°C 10 1
flash
42°C 5 Rever Tra Ace (Toyobo) 1.0
µL 42°C 50 99°C 5
flash −30°C PCR
12.5 µL 5x RT reaction buffer Toyobo 4.0 µL 10 mM dNTPs Promega 2.0 µL RNase inhibitor Promega 0.5 µL
3-4. Light Cycler Roche Diagnostics PCR
PCR H2O (Roche) 12.4 µL 25 µM MgCl2 (Roche) 1.6 µL 10 µM primer forward reverse 1.0 µL, 10x LC DNA master (Roche) 2.0 µL, 10
cDNA 2.0 µL LightCycler
(400 g 2 sec RT) LightCycler (Roche Diagnostics)
PCR primer
PCR melting
curve
PCR
rp49 95°C, 10 min → ( 95°C, 15 sec → 60°C, 10 sec → 72°C, 8 sec ) × 40 cycles → Melting → 40°C, 30 sec
rpL32 95°C, 10 min → ( 95°C, 15 sec → 60°C, 10 sec → 72°C, 8 sec ) × 40 cycles → Melting → 40°C, 30 sec
Diptericin 95°C, 10 min → ( 95°C, 15 sec → 60°C, 10 sec → 72°C, 10 sec ) × 40 cycles → Melting → 40°C, 30 sec
Drosomycin 95°C, 10 min → ( 95°C, 15 sec → 58°C, 10 sec → 72°C, 8 sec ) × 40 cycles → Melting → 40°C, 30 sec
HSC70-4 95°C, 10 min → ( 95°C, 15 sec → 60°C, 10 sec → 72°C, 8 sec ) × 40 cycles → Melting → 40°C, 30 sec
GAPDH 95°C, 10 min → ( 95°C, 15 sec → 60°C, 10 sec → 72°C, 8 sec ) × 40 cycles → Melting → 40°C, 30 sec
HSPA1A 95°C, 10 min → ( 95°C, 15 sec → 60°C, 10 sec → 72°C, 8 sec ) × 40 cycles → Melting → 40°C, 30 sec
× 40 cycles → Melting → 40°C, 30 sec
HSPA9 95°C, 10 min → ( 95°C, 15 sec → 60°C, 10 sec → 72°C, 8 sec ) × 40 cycles → Melting → 40°C, 30 sec
Melting ; 95°C→65°C 15 sec→65°C ~95°C
Light Cycler Primer
rpL32 (rp49) -F 5'- AGATCGTGAAGAAGCGCACCAAG -3' rpL32 (rp49) -R 5'- CACCAGGAACTTCTTGAATCCGG -3' Diptericin-F 5'- GTTCACCATTGCCGTCGCCTTAC -3' Diptericin-R 5'- CCCAAGTGCTGTCCATATCCTCC -3' Drosomycin-F 5'- TTGTTCGCCCTCTTCGCTGTCCT -3' Drosomycin-R 5'- GCATCCTTCGCACCAGCACTTCA -3' HSC70-4-F 5'- ACAAGAAGGCTGTTGGAGAGC -3' HSC70-4-R 5'- GGACTTGACCTCAAAGATACCGT -3' GAPDH-F 5’- GCACCGTCAAGGCTGAGAAC -3’ GAPDH-R 5’- TGGTGAAGACGCCAGTGGA -3’ HSPA1A-F 5’-CCTGGAGTCCTACGCCTTCAAC -3’ HSPA1A-R 5’- CTTGACACTTGTCCAGCACCTTC -3’ HSPA8-F 5’- GGAAATTGCAGAAGCCTACCTTG -3’ HSPA8-R 5’- CTTTGGTAGCCTGACGCTGAGA -3’ HSPA9-F 5’- TTAGACTTGTTTCAAGGCGGGATTA -3’ HSPA9-R 5’- TGGCACCTTCGGCATTCTC -3’
4-1. siRNA 96well
96 Well Cell Culture Plate greiner bio-one HEK293 40-50
100 µL DMEM gibco 10% FCS biowest
2 mM L-glutamine gibco 37°C CO2 5.0
OPTI-MEM gibco 20 µL 1 µM siRNA QIAGEN FlexiTube siRNA 0.4 µL
Lipofectamine RNAiMAX Invitrogen 0.4 µL 10
well 37°C CO2 5.0 48
siRNA
* siRNA
AllStars Negative Control siRNA (QIAGEN #1027280) FlexiTube siRNA (QIAGEN)
Hs_MYD88_5 AACTGGAACAGACAAACTATC Hs_DNAJA3_5 CTCCGGCATGGAAACCATCAA Hs_HSPA1A_3 (#1) AGAGATGAATTTATACTGCCA Hs_HSPA1A_9 (#2) TCCGGTTTCTACATGCAGAGA Hs_HSPA8_6 (#1) AAGGACCTAAATTCGTAGCAA Hs_HSPA8_12 (#2) TTAAGCTGCTATAGTAAGTTA Hs_HSPA9_3 (#1) ATGAAGTTGACCCGTGCTCAA Hs_HSPA9_5 (#2) AATTGTATTCTCCGAGTCAGA 4-2. Reporter plasmid
96 Well Cell Culture Plate HEK293 60-80
100 µL DMEM 10% FCS 2 mM L-glutamine 37°C CO2
Invitrogen 0.2 µL Lipofectamine LTX Invitrogen 0.5 µL
10 96
well plate well 37°C CO2 5.0 18
*
pELAM-Luciferase 100 ng/well
pRL-TK 20 ng/well Promega
4-3. HSP70
Reporter plasmid 18 HEK293
0.1 0.3 1 3 10 µM pifithrin-µ (PES) Sigma well
37°C CO2 5.0 1
4-4.
FLA-ST Ultrapure InvivoGen 3 ng/mL 96 well plate
well 37°C CO2 5.0 4
4-5. Luciferase
96 well plate well 80 µL Dual-glo Luciferase Buffer Dual-glo Luciferase Substrate Promega Dual-glo Luciferase assay system
70 µL , 10 Molecular
device SpectraMax L-TYA Firefly Luciferase activity
Dual-glo Luciferase assay system 70 µL 10
Molecular device SpectraMax L-TYA Renilla Luciferase activity
5. IKKβ
5-1. HSP70
100 mm Cell Culture Dish BD Falcon HEK293 100
DMEM 10% FCS 2 mM L-glutamine 37°C
CO2 5.0 10 µM PES 37°C
CO2 5.0 1
5-2. siRNA
100 mm Cell Culture Dish HEK293 40-50
DMEM 10% FCS 2 mM L-glutamine 37°C CO2
5.0 OPTI-MEM 2.0 mL 10 µM siRNA QIAGEN FlexiTube
siRNA 4.0 µL Lipofectamine RNAiMAX 40 µL 10
37°C CO2 5.0 36
siRNA
* siRNA
AllStars Negative Control siRNA (QIAGEN #1027280) FlexiTube siRNA (QIAGEN)
5-3.
PES siRNA 5.0 mL PBS
SIGMA pH7.4 500 µL cell lysis buffer 25 mM Tris
(SIGMA), 150 mM NaCl ( ), 1% NP-40 ( ), 1 mM
EDTA, Complete Mini (Roche) 1.5 mL Quality
Scientific Plastics 20 15,000 g, 4°C,
10 min 1.5 mL DC Protein Assay Kit (Bio-Rad)
input Flagellin 15
FLA-ST Ultrapure 300 ng/mL 37°C CO2 5.0
15
5-4. IKKβ
5-3 200 µL 2 1.5 mL IKKβ
IKKβ (D30C6) Rabbit mAb (Cell Signaling)
Rabbit (DA1E) mAb IgG XP Isotype Control 2.0 µL 4°C
2 30 µL slurry
Dynabeads M-280 Sheep anti-Rabbit IgG (novex) cell lysis buffer
2 /1
4°C 45 Cell lysis
buffer 3 1x SDS sample buffer 50 mM Tris-HCl
SIGMA 2% SDS 10% glycerol 100 mM
β-mercapto ethanol SIGMA 0.0125 Bromo phenol blue Wako 30 µL
95°C 5 boil
5-5. SDS-PAGE
10% SDS-PAGE
Mini-PROTEIN III Electrophoresis Cell Bio-Rad 40 mA
Mini-PROTEIN III Electrophoresis Cell Bio-Rad
100 V PVDF GE
Healthcare Hybond-P 1 PVDF
5% /TBST (0.1% Tween20 nacalai tesque
TBS) 1 PVDF
1 1 TBST 5
3 HRP IgG GE Healthcare
5,000 2 1
TBST 5 3 Luminata Forte Western HRP Substrate
MILLIPORE HRP ImageQuant
LAS 4000 mini GE Healthcare 1 2
*
α-tubulin (ab18251) Rabbit polyclonal Ab Abcam 800 Actin (ab179467) Rabbit mAb Abcam 10,000
Tid-1 (RS13) Mouse mAb Cell Signaling 1,000
IκBα (L35A5) Mouse mAb (Amino-terminal Antigen) Cell Signaling 1,000
NF-κB p65 (D14E12) XP Rabbit mAb Cell Signaling 1,000 IKKβ (D30C6) Rabbit mAb (Cell Signaling, 1,000 )
* 2
ECL Anti-rabbit IgG, Horseradish Peroxidase linked whole antibody (from sheep) (GE Healthcare 5,000 )
ECL Anti-mouse IgG, Horseradish Peroxidase linked whole antibody (from sheep) (GE Healthcare 5,000 )
Mouse Anti-Rabbit IgG (Light-Chain Specific) (D4W3E) mAb (HRP Conjugate) (Cell Signaling 5,000 )
6. DNAJA3 DNAJA3 HSP70
6-1. DNAJA3-FLAG
6 well plate BD Falcon HEK293 60-80
DMEM 10% FCS 2 mM L-glutamine 37°C
CO2 5.0 OPTI-MEM 400 µL
pcDNA3/DNAJA3-FLAG 2.5 µg Plus Reagent 8.0 µL Lipofectamine LTX 10
µL 10
well 37°C CO2 5.0 24
6-2.
1.0 mL PBS 300 µL cell lysis buffer
1.5 mL 20 15,000
g, 4°C, 10 min 1.5 mL DC Protein Assay Kit
input
6-3. FLAG
6-2 200 µL 1.5 mL 0.1 mg/mL
FLAG FLAG M2 Mouse mAb (Sigma) 2.0 µL 4°C
2 30 µL slurry
Dynabeads M-280 Sheep anti-Mouse IgG (novex) cell lysis buffer
2 /1
4°C 45 Cell lysis buffer
3 300 µg/mL FLAG peptide 40 µL
10 1/3
4x SDS sample buffer 95°C 5 boil IP
6-4. SDS-PAGE
4–15% TGX Bio-Rad
SDS-PAGE Mini-PROTEIN III Electrophoresis Cell
40 mA EzStain Silver Atto
150 mm dish 20 mL 25 mL 5 mL S-1 0.5 mL 10 50 mL 10 3 50 mL S-2 0.5 mL 5 50 mL 30 100 mL S-3 0.5 mL S-4 0.5 mL 50 mL 30
50 mL
10
50 mL 5 2
1.5 mL
LC-MS
7. HSP70 HSPA1A HSPA8 HSPA9
NF-κB
7-1. HSP70
6 well plate HEK293 100
DMEM 10% FCS 2 mM L-glutamine 37°C CO2 5.0
10 µM PES 37°C CO2
5.0 1
7-2. siRNA RNAi
6 well plate HEK293 40-50
DMEM 10% FCS 2 mM L-glutamine 37°C CO2 5.0 OPTI-MEM 400 µL 10 µM siRNA QIAGEN FlexiTube siRNA
1.0 µL Lipofectamine RNAiMAX 10 µL 10
well 37°C CO2 5.0 36
siRNA
AllStars Negative Control siRNA (QIAGEN #1027280) FlexiTube siRNA (QIAGEN)
Hs_MYD88_5 AACTGGAACAGACAAACTATC Hs_HSPA1A_3 (#1) AGAGATGAATTTATACTGCCA Hs_HSPA8_6 (#1) AAGGACCTAAATTCGTAGCAA Hs_HSPA9_5 (#2) AATTGTATTCTCCGAGTCAGA
7-3.
FLA-ST Ultrapure 300 ng/mL 6 well plate well 37°C
CO2 5.0 15 1.0 mL PBS
200 µL cell lysis buffer 1.5 mL
20 15,000 g, 4°C, 10 min
1.5 mL DC Protein Assay Kit
1/3 4x SDS sample buffer
95°C 5 boil
7-4. SDS-PAGE
10% SDS-PAGE
Mini-PROTEIN III Electrophoresis Cell 40 mA
Mini-PROTEIN III Electrophoresis Cell 100 V
PVDF 1
PVDF 5% /TBST
1 1 4°C TBST 5
3 HRP IgG
5,000 2 1 TBST 5
3 Luminata Forte Western HRP Substrate HRP
ImageQuant LAS 4000 mini
1 2
*
Tid-1 (RS13) Mouse mAb Cell Signaling 1,000 HSP70 (6B3) Rat mAb Cell Signaling 1,000
IκBα (L35A5) Mouse mAb (Amino-terminal Antigen) Cell Signaling 1,000
Phospho-IκB-α (Ser32) (14D4) Rabbit mAb Cell Signaling 1,000 NF-κB p65 (D14E12) XP Rabbit mAb Cell Signaling 1,000
Phospho-NF-κB p65 (Ser536) (93H1) Rabbit mAb Cell Signaling 1,000 Actin (ab179467) Rabbit mAb abcam 10,000
IKKβ (D30C6) Rabbit mAb (Cell Signaling, 1,000 )
Phospho-IKKα (Ser176) / IKKβ (Ser177) (C84E11) Rabbit mAb (Cell Signaling,
1,000 )
* 2
ECL Anti-rabbit IgG, Horseradish Peroxidase linked whole antibody (from sheep) (GE Healthcare 5,000 )
ECL Anti-mouse IgG, Horseradish Peroxidase linked whole antibody (from sheep) (GE Healthcare 5,000 )
1. Müller, U., Vogel, P., Alber, G., and Schaub, G. (2008) The innate immune system of mammals and insects. Contrib. Microbiol. 15, 21–44
2. Fearon, D. T., and Locksley, R. M. (1996) The instructive role of innate immunity in the acquired immune response. Science (80-. ). 272, 50–54
3. (2016) . . 105, 747–752
4. (2017) . . 54, 105–113
5. Napetschnig, J., and Wu, H. (2013) Molecular Basis of NF-κB Signaling. Annu. Rev. Biophys. 42, 443–468
6. Kawai, T., and Akira, S. (2010) The role of pattern-recognition receptors in innate immunity: Update on toll-like receptors. Nat. Immunol. 11, 373–384 7. Akira, S., Uematsu, S., and Takeuchi, O. (2006) Pathogen recognition and innate
immunity. Cell. 124, 783–801
8. Bassères, D. S., and Baldwin, A. S. (2006) Nuclear factor-κB and inhibitor of κB kinase pathways in oncogenic initiation and progression. Oncogene. 25, 6817– 6830
9. Courtois, G., and Gilmore, T. D. (2006) Mutations in the NF-κB signaling pathway: Implications for human disease. Oncogene. 25, 6831–6843 10. Toubi, E., and Shoenfeld, Y. (2004) Toll-like receptors and their role in the
development of autoimmune diseases. Autoimmunity. 37, 183–188
11. Li, Q., and Verma, I. M. (2002) NF-κB regulation in the immune system. Nat. Rev. Immunol. 2, 725–734
12. Hayden, M. S., and Ghosh, S. (2008) Shared principles in NF-kappaB signaling. Cell. 132, 344–62