in the Mixed State of Superconducting Tantalum (I)
journal or
publication title
福井大学工学部研究報告
volume 20
number 2
page range 139‑144
year 1972‑09
URL http://hdl.handle.net/10098/4731
I:ffect of Oscillatory Fields on DC Resistance in the Mixed State of Superconducting Tantalum (I)
Masasi INOUE,* Hisao YAGI,* and Toshiaki TATsuKAwA*
(Receiveb Feb. 18. 1972)
The electrical resistance of superconducting Ta has been measured by the de potentiometric method at liquid helium temperature under the static and oscillatory magnetic fields over the frequency range from 100Hz to 1 kHz. The resistive voltages in the mixed state were found to depend on the de sample current, temperature, and the applied fields (frequency and amplitude). A hysteresis of the resistance against the static magnetic field was observed.
The results are qualitatively understood by the current model of the flux-flow and eddy-current mechanism.
1. Introduction
One of the focal points of interest in the superconductivity is the de and ae resis- tance in the mixed state under the applied electric and magnetic fields, specifically for Type II or hard superconductors. Type II superconductors are characterized by the existence of the mixed state in the magnetic field HC1<H<Hc2 , where the quantized magnetic flux, known as vortex line or fluxoid, penetrates into the superconductors. Fundamentally, all phenomena stated above are related With the motion of the fluxoids, with and without a pinning center, which gives rise to electric fields in the specimen and thus various dissipative and galvanomagnetic effects resu1t.1-3)
Some of the recent studies reported to date on the flux-flow resistance measurement are given in Table I. These studies have made it clear that; (1) the induced alternating current, produced by an oscillatory magnetic field, reduces markedly the effects of pinning on the time average motion of the fluxoids ,depinning effect) and thus this motion approaches ideal viscous flux-flow,4) (2) the similar conclusions are also found for In
+
1.5 atm. % Bi, in addition to the frequency Q) dependence of the oscillatory field strength HacT at which the I-V curves of the resistance begins to be "ohmic", HacToc Q)-lj2, and the non-linear portion of the I-V curves is due to pinning of the fluxoids,S) and (3) the resistive voltage enhancement in the presp-nce of oscillatory fields is interpreted in terms of the eddy-current model6), as predicted by Cody and Miller.71 The frequency dependence of the resistance is thus mostly understood by the eddy-current mechanism.Usually a flat sheet of superconductors is used in the flux-flow experiments under
*
Department of Applied Physics.superconductors.
Sample Nb4 ) (polycrystalline plate) In+ 1. 5%Bi5 ) (foil) I
Hdcr t Dimension 2.5XO.51XO.02 cmS 3 X 1 XO.02cm8
~~ Hac Magnetic Hac= 1 ... 4 kG Hdc= 12.3 G
Field H ac (150 G, 20 kHz) Hac( 0 ...,20 G, 10 k ... 150 kHz) Mechanism depinning-+vi3cous flow flux-flow
Sample Nb6 ) (film) I
~r
Dimension 18, 120.um (thickness)--
Magnetic Hdc = 350 ... 2.5 kG HacField Hac(1.2 ... 3.7G, 5 ... 5 kHz) Mechanism eddy-current7 )
The first column shows the experimental arrangements, where I is the sample current, Hdc the static magnetic field, and Hac the oscillatory field.
the static magnetic field, heing applied perpendicular to the sheet. In this paper are reported the similar experiments on superconducting Tantalum, where the specimen of a sheet is wound helically aroud a bakelite bobbin to which the static (DC) and oscillatory (AC) magnetic fields are applied perpendicular. The results are qualitatively compared with the current models mentioned above. In our laboratory the same specimen of Ta has been used as a liquid level indicator for a metal dewar and the electrical properties of Ta wound helically are reported.8) Also the similar subjects for hard superconductors are of current interest. For Nb-50%Ti, Nb-50%Ti-Ta, and Nb-25%Zr the results will be reported in another paper, of which Nb-Ti wires have been used as V-band "wired-wall" cavity for ESR and ENDOR measurement9,W as well as a low field superconducting magnet.l l l
2. Experimental
The Ta foil of thickness 20,u was cut into a ribbon shape of width -1. 0 mm and then wound helically around a bakelite bobbin (5 mm ¢ x 15 mm), just as the level indicator.S) The experimental set-up for production of the magnetic fields, DC and AC, is shown in Fig. 1, where both fields are parallel and perpendicular to the bobbin.
The combined magnet of a Helmholtz type consists of a coil for AC magnetic field Hac (Inner layer) and a coil for DC field Hdc (Outer layer), both of which are made of conventional copper wire. The DC power of the magnet was supplied by a stabilized electronic device and the AC power by an out-put transformer through a power amp-
lifier and rf generator (frequency range 100Hz to 1 kHz).
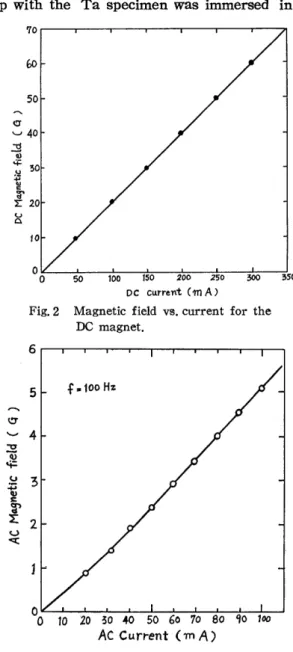
Figs. 2 and 3 show the magnetic field strength for each coil, DC and AC fields, as a function of the supplied current, measured by a commercial Gauss-meter at room
temperature, respectively. The whole set-up with the Ta specimen was immersed in the iquid helium bath at 4.2 K and some- 70 r - - , - - - , - - . . , - - - r - - , - - - , . - - ' 7 ' I
times at--4.3 K by raising the He vapor pressure. The electrical resistance 'Was measured by a usual potentiometric method with four-terminals, with and without AC magnetic fields.
,~ ~ ~
~ A C C, 1;
k7 )(
1 em.
Fig.1 Experlmental set-up for the AC or oscillatory magnetic field (Inner layer) and for the DC magnetic field (Outer layer).
3. Results and discussion
u 0.
cr ...
v
-0'i=
.+; v cu s:
l: ~
<C u 50
50 100 150 200 250 300
DC Cllrrent (111 A)
Fig. 2 Magnetic field vs. current for the DC magnet.
6
5 f .100 Hz
4
3
2
°0 10 20 30 40 50 60 10 80 t:jo 100
AC Current (m A)
Fig.3 Magnetic field vs. current for the AC magnet at f= 100 Hz.
350
Fig. 4 shows the dependence on the DC magnetic field of the resistances at 4.2 and about 4.3 K for different sample currents 18 • As shown later, the observed behaviors are dependent on Is, a current density being 10 A/cm2 for 1,=2 rnA and 50 A/cm2 for 18=10 rnA, and on temperature. A hysteresis of the resistances is seen between de- creasing and increasing the fields, suggestive of Type II superconductor, while pure Ta is reported to be a Type I superconductor.12l The Ta specimen used is considered to be impure and involves some structural defects to form a pinning center, though the
acual Type II superconductors such as Nb, Nb-Ti, etc. Because of the contact resistances between Ta and Cu-Ieads, the absolute values of the resistances, of the order of 10-2 ohm-em, may be a little larger than those reported.4,5,6)
A typical curve of the effect of the AC magnetic field (Hac=5 G, /=100 Hz) on the resistance in the mixed state is shown in Fig. 5 'With the DC magnetic field Hdc
=80 G applied. The resistive voltages appear at about Hdc=65 G. Application of the AC field at a fixed field Hdc then causes the enhancement, as indicated by a dotted line. However no recovery of
I.<...."...-t) 211,1, '0"'"
"'21(
_4·3K .... _
100 150 ZOO
Magnetic field (q)
Fig. 4 The DC magnetic fiel:i dependence of the resistances at 4.2 and about 4.3 K, with different sample current Is. A hysteresis is indicated by an arrow.
the resistance was observed even if the AC field was switched off, but rather the values persisted until the DC field was decreased to about 53 G in this case, which may be due to a flux pinning.
In Fig. 6 are shown the relative changes in the enhanced resistances against the amplitude or strength of the AC field for various frequencies, where the static field Hdc is kept at 68 G, near the first critical field HC1=65 G, and at 100 G, near the middle of the mixed state. The ordinate shows the difference (RHac - RQ) divided by Ro, where RHac is the resistance under the AC field and Ro at zero AC field. Fig. 6 shows that for Hdc=68 G these values depend on Hac and on frequency f, while for
5.---.---.---.----~----~
4.2K To.
DC
Fig. 5 The resistive enhancement by the AC magnetic field (Hac=5 G, /=100 Hz) in the mixed state at Hdc=80 G, indicated by a dotted line. The solid lines show the change in the resist- ance with Hdc when Hac = O.
Hdc=100 G the changes are very small and less dependent on
f.
For the former case, the induced resistances are seen to pass through a maximum as a function of /, approximately at 100 Hz, which are the similar behaviors found for Nb by Huebener et al., in which the frequency f* associated with the maximum values increases linearly with the static field Hac.S) They also reported the independence of [*on the amplitude Hac, while in the present resul ts this isobscure.
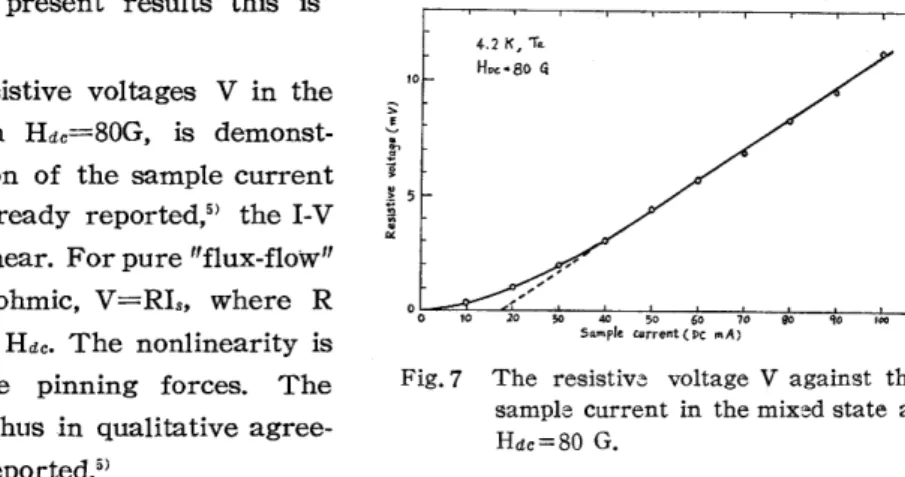
Finally, the resistive voltages V in the mixed state, with Hdc=80G, is demonst- rated as a function of the sample current Is in Fig. 7. As already reported,5) the I-V curve shows nonlinear. For pure "flux-flow"
resistivity, it is ohmic, V=RIs, where R depends only on Hac. The nonlinearity is attributed to the pinning forces. The present result is thus in qualitative agree- ment with those reported.·)
10
4-.2 K, To.
HOG-BO ~
°o~~-4n-~~'-~~'-~50'-7,60'-~70'-~~--+'~O--±-~
S .. mple <orrent (PC .. A)
Fig. 7 The resistive voltage V against the sample current in the mixed state at Hdc=80 G.
In summary, the present experimental results made on the helically wound Ta are qualitatively understood in terms of the current models and summerized as follows.
(1) Although pure Ta is known as a Type I superconductor, our impure samples behave rather like a Type II superconductor, having a pinning force as well. This is shown by a hysteresis effect of the resistance against the static magnetic field and by the nonlinear I-V curve for a small current density.
(2) It may be due to the pure flux-flow mechanism that the I-V curve for a large current density is linear and that the induced resistances by an oscillatory magnetic field tend to saturate to a constant value with the strength Hac, as shown in Fig. 6.
These facts are also suggestive of the depinning effect of the oscillatory magnetic field on the motion of fl uxo ids.
(3) The appearance of a maximum of the AC frequency may be due to the eddy- current mechanism, as pointed out by Huebener et alY and Cody et al.1) However, the detailed frequency dependence has not been drawn from the present results.
Although the samples used are not of a simple form, usually of a plate sheet, and thus the situation is a little complicated in geometry, the overall behaviors seem to be quite similar to those reported to date. More detailed studies will be reported later.
Acknowledgement
One of us (M.I) is grateful to Professor E. Tatsumoto (Hiroshima University) for his many advice. We thank S. Morishita for the measurements, S. Kato for assistance of construction of the magnet used, K. Tsubokawa, and T. Saito for many technical assistance. A part of this study has been financially supported by the Scientific Research Funds of the Ministry of Education.
1) E. A. Lynton: Superconductivity 3rd Ed. (Methuen, London, 1969), Chap. 7, P. 76.
2) Y. B. Kim and M. J. Stephen: Superconductivity, ed. R. D. Parks (Marcel Dekker, New York, 1969) Vol. 2, p. 1107.
3) D. Saint-James, G. Sarma, and E. J. Thomas: Type I I Superconductivity (Pergamon Press, London, 1969), Part II, p.209.
4) A. T. Fiory and B. Serin: Phys. Letters 25A (1967) 557.
5) J. A. Cape and I. F. Silvera: Phys. Rev. Letters 20 (1968) 326.
6) G. P. Huebener, G. Kostorz, and V. A. Rowe: J. Low Temp. Phys. 4 (1971) 73.
7) G. D. Cody and R. E. Miller: Phys. Rev. 173 (1968) 481.
8) H. Yagi, M. Inoue, and T. Tatsukawa: Memoirs Fac. Eng. Fukui Univ. 18 (1970) 205.
9) H. Yagi, M. Inoue, T. Tatsukawa, S. Kato, and O. Yaeguchi: Japan. J. appl. Phys. 9 (1970) 1534.
10) M. Inoue and H. Yagi: Memoirs Fac. Eng. Fukui Univ. 19 (1971) 101.
11) H. Yagi, M. Inoue, T. Tatsukawa, S. Kato, and O. Yaeguchi: ibid. 19 (1971) 93.
12) J. Buchanan, G. K. Chang, and B. Serin: J. Phys. Chern. Solids 26 (1965) 1183.