九州大学学術情報リポジトリ
Kyushu University Institutional Repository
兄弟の多様性がもたらす有性生殖の優位性
道下, 誠
https://doi.org/10.15017/1931739
出版情報:Kyushu University, 2017, 博士(理学), 課程博士 バージョン:
権利関係:
Ph.D. Thesis
Advantage of sexual reproduction caused by enhanced sibling diversity
Makoto Douge
Submitted to Graduate School of System Life Sciences, Kyushu University In fulfillment of the requirement for the degree of Doctor of Philosophy
2018
Contents Preface
Acknowledgement
Chapter 1: Sibling diversity gives sexual reproduction the advantage in a changing environment.
Introduction
Sib-competition model
・Population structure and reproduction of sexual and asexual organisms ・Competition within a patch and adaptation to the local environment ・Environmental correlations
・The relative advantage of sexual reproduction
Revised sib-competition model with enhanced advantage of sex ・The evolutionary advantage of sex enhanced
・Realized advantage of sexual versus asexual reproduction Why is sex not as advantageous as expected?
・The number of phenotypes among siblings is smaller than N ・Sexual siblings with the same mother are similar
・Natural selection within each patch is ineffective
・Environmental correlations reduce the advantage of sex Discussion
References
Captions to table and figures Table
Figures
Chapter 2: Advantages of sexual reproduction resulting from sibling diversity: effects of selection intensity, environmental variance, and reduced genetic diversity
Introduction
Sib-competition model
・Results of the sib-competition model Multiple survivors per patch
・Mathematical arguments Environmental variance
Reduced number of phenotypes by selection Discussion
References
Captions to table and figures Table
Figures
Preface
In many species, including human, offspring has the genome that is a mixture of genomes of two different individuals. This is called "sexual reproduction". In the last several decades, the reason why the sexual reproduction is maintained in evolution has been a big puzzle in evolutionary biology. It still remains an unsolved problem, although a large number of different processes explaining the advantage of sexual reproduction have been proposed and studied.
Some sexual species, such as humans, have separate sexes, namely males and females, which are specialized in producing sperms (pollen) and eggs, respectively.
Other organisms, such as many plants and other sedentary species, are hermaphrodite, in which a single individual produces sperms (or pollen) and eggs in its life.
Hermaphrodites may engage in selfing, forming an offspring from an egg sired by a sperm, both being produced by the same individual. However, in all of these cases, the genome of an offspring differs from that of any of their parents, resulting in genetic mixis.
In contrast, there are species who lost sexual reproduction. Their offspring has the same genome as their mother. The most famous examples are water fleas and aphids.
Their offspring are genetic clones of their mother. Since asexual reproduction can avoid producing males who do not contribute to the production of offspring, the asexual reproduction is more efficient than sexual reproduction. An asexual strain should increase in number at the rate twice as faster than a sexual strain, if their survivorship and fertility are the same. This is called "two-fold cost of sex" (Maynard Smith, 1976, 1978). This indicates that asexual mutants appeared in a sexual population should take over the whole population, giving a very large immediate evolutionary advantage.
Nonetheless sexual reproduction is dominant in many organisms. This suggests that there must be processes that give a very strong advantage to the sexual reproduction.
In the 1930s, Fisher (1930) and Muller (1932) proposed that the advantageous mutations are accumulated in an individual in a short time by genetic recombination of sexual reproduction. Thereafter many fascinating ideas have been proposed. One emphasizing temporal fluctuation of the environment, especially biological environment caused by pathogens, is called the Red Queen Hypothesis promoted by Hamilton (1980).
Another is to emphasize the role of accumulation of deleterious mutations in the
population, such as Muller's Ratchet by Muller (1964) and genetic load (Kondrashov, 1988). Still another is to emphasize the spatial distribution (Peck, 1999).
One hypothesis for the advantage of sexual reproduction focuses on the diversity of offspring born from a single mother. G.C.Williams presented an idea called Lottery hypothesis (Williams and Mitton, 1973; Williams, 1975). The sexual siblings have different genotypes. In contrast, the asexual siblings have the same genotypes.
Provided the environment of the next generation is unpredictable, the sexual parents having diverse offspring will be advantageous. The provability that one of their offspring has the best match with the environment may be higher than that of an asexual mother. Maynard Smith (1976, 1978) formalized this idea as "sib-competition model"
and studied it by computer simulations. He concluded that the diversity of offspring cannot generate a sufficiently large advantage outweighing the two-fold cost of sex.
After that the idea has not been examined intensively, except for Taylor (1979) and Bulmer (1980). Recent review articles by Nick Barton and Sarah Otto concluded that sib-competition does not provide sufficiently strong advantage to the sexual reproduction (Barton et al., 2002; Otto, 2009).
However, the assumptions of strong sib-competition and the diversity of local environment for offspring are both quite plausible. The genetic diversity among offspring of the same mother should have significant effects. I conjecture that there must be some ways to make the hypothesis work strongly.
In this thesis, I examine the sib-competition model with modified conditions, and discuss when the diversity of sexual siblings can be effective in generating a sufficiently strong advantage of sex. In the first chapter, I revise the sib-competition model of Maynard Smith in the direction to which the sexual type has more diversity than in the original version. We report that, by revising the model in two major ways, the diversity of sexual siblings has an advantage outweighing the two-fold cost. This result suggests that the diversity of sexual siblings can play an important role for the maintenance of sexual reproduction. I further examine various processes promoting and limiting the advantage to sex in detail.
In the second chapter, we examine three additional modifications that make the model more realistic. Three factors added to the model are: milder selection pressure, environmental variance, and reduced genetic diversity. They may encourage or discourage the evolution of sex.
In short, these theoretical studies show that there are situations in which the sexual type has the advantage overtaking the two-fold cost. In other words, the effect of the diversity of sexual siblings cannot be neglected in thinking of the evolution of sexual reproduction.
I summarize the contents of two chapters as follows:
Chapter 1: Sibling diversity gives sexual reproduction the advantage in a changing environment.
Background: A process potentially favoring sexual reproduction is intense competition among siblings, because the phenotypic diversity is higher among sexual siblings than asexual siblings. Previous theoretical studies concluded this process ineffective.
Question: What is the condition in which sib-competition may favor sexual reproduction?
Search method: Mathematical and numerical analyses of the model. We identify the mechanisms that reduce the advantage of sex.
Key Assumptions: Habitat consists of many patches, each with different environmental condition. Only the most adapted individual survives in each patch. Sexual reproduction generates phenotypic diversity among siblings, whereas asexual reproduction doubles the reproductive rate.
Conclusions: A greater number of environmental factors and a variation of the fitness achieved by adapted phenotypes favor sexual reproduction. Intense sib-competition is an important process for maintaining sex.
Chapter 2: Advantages of sexual reproduction resulting from sibling diversity:
effects of selection intensity, environmental variance, and reduced genetic diversity.
Background: A twin paper showed that more sibling diversity among sexual offspring may help to maintain sexual reproduction in environments that are spatially heterogeneous and temporally fluctuating and in which sib-competition is very intense.
Question: Can sexual reproduction be maintained in the face of the two-fold cost of sex under milder selection pressure, environmental variance, and reduced genetic diversity?
Methodology: Mathematical and numerical analyses of the sib-competition model with several modifications.
Conclusions: The advantages of sexual reproduction are attenuated by milder selection pressure and environmental variance but enhanced by reduced genetic diversity.
Sib-competition plays an important role in maintaining sex when appropriate conditions are present.
References for the preface:
Barton, N.H., Briggs, D.E.G., Eisen, J.A., Goldstein, D.B., Patel, N.H., 2002. Evolution, New York, Cold Springer Laboratory House.
Bulmer, M.G. 1980. The sib competition model for the maintenance of sex and recombination. J Theor. Biol., 82: 335-345
Fisher, R.A., 1930. The Genetical Theory of Natural Selection. Oxford, Oxford University Press.
Hamilton, W.D., 1980. Sex versus Non-sex versus Parasite. Oikos, 35, 282-290.
Kondrashov, A.S. 1988. Deleterious mutations and the evolution of sexual reproduction.
Nature 336:435-440.
Maynard Smith, J. 1976. A short-term advantage for sex and recombination through sib-competition. J. Theor. Biol., 63: 245-258
Maynard Smith, J. 1978. The Evolution of Sex. Cambridge: Cambridge University Press.
Muller, H.J., 1932. Some Genetic Aspect of Sex. American Naturalist, 66, 118-138.
Muller, H.J., 1964. "The relation of recombination to mutational advance". Mutation Research, 106: 2–9
Otto, S.P., 2009. The Evolutionary Enigma of Sex. The American Naturalist, 174, S1-S14.
Taylor, P.D. 1979. An analytical model for a short-term advantage for sex. J. theor.
Biol., 81: 407-421
Williams, G.C. and Mitton, J.B. 1973. Why reproduce sexually? J. Theor. Biol., 39:
545-554
Williams, G.C. 1975. Sex and Evolution. Princeton, NJ: Princeton University Press.
Acknowledgement
First of all, I would like to show my greatest gratitude to my supervisor, prof. Yoh Iwasa, who has taught me, encouraged me, and developed me for the three years of my study. I cannot thank him enough. I appreciate helpful comments, supports and encouragement given by Prof. Naruo Niko at Open University of Japan during the initial stage of this research. I also thank the following people for their very helpful comments: Koichi Ito, Tomohiko Kamioka, Hideo Kobayashi, Shigeko Kobayashi, Masahiko Morishita, Yasuo Nakasuji, and members in the Theoretical Biology Laboratory in Kyushu University. I also appreciate my wife, Norie Douge who has supported and encouraged me in all the ways to my study.
Chapter 1
Sibling diversity gives sexual reproduction the advantage in a changing environment
The study of this chapter, done in collaboration with Dr. Yoh Iwasa, was published in Evolutionary Ecology Research 18: 459-475 in 2017
Introduction
Nearly forty years ago, John Maynard Smith presented the concept of the two-fold cost of sex (Maynard Smith, 1978). His hypothesis was that sexual reproduction is less effective than asexual reproduction because the number of offspring produced sexually per generation is half the number that can be produced asexually. Nonetheless, sexual reproduction predominates among multicellular organisms. This suggests that sexual reproduction must confer either a group selective advantage (e.g. Mettledorf 2016) or else confer significant short-term advantages that outweigh its two-fold cost. Since then, various possible evolutionary benefits of sexual reproduction have been suggested.
However, as Agrawal (2006) observed in his review article: "We do not even know how sex typically affects the mean and variance in fitness in nature. We know even less about the forces generating variation in sexual processes within species."
Among many plausible models suggesting the advantages of reproducing sexually, the "Red Queen Hypothesis" emphasized the impact of temporal fluctuations on the selective process. In particular, Hamilton (1980) proposed that the host-parasite relationship would favor sexual reproduction due to short-term epistatic fluctuations.
Recent reviews also concluded Red Queen hypothesis as a potentially important process favoring sex (Otto, 2009; Hartfield and Keightley, 2012).
Another model emphasized the role sexual reproduction plays in disrupting linkage disequilibrium created by random genetic drift. Natural selection can generate associations between different loci where one allele has a positive effect, and another a negative effect on fitness. In sexually reproducing species, genetic recombination reduces these negative associations allowing natural selection to work more effectively (Fisher, 1930; Muller, 1932; Barton and Otto, 2005; Barton et al., 2007; Otto, 2009).
A third model notes that sexual reproduction produces diversity, providing an advantage in environments where the direction and intensity of selection change. G. C.
Williams demonstrated that in a changing environment, sexual reproduction is likely to produce the most adapted individual (the Lottery hypothesis) (Williams and Mitton, 1973; Williams, 1975). In addition, Bell (1982) proposed that a greater range of environments is accessible to sexually reproducing individuals allowing each to exploit a slightly different ecological niche (the Tangled Bank hypothesis). Williams and Mitton (Williams and Mitton, 1973; Williams, 1975) explained the advantage of sexual reproduction in terms of enhanced variations in fitness, which increased the number of
very fit offspring. Maynard Smith (1976, 1978) identified competition between siblings as a key to a major advantage of sexual reproduction because this can generate variation within families. He formalized a sib-competition model and demonstrated that sexual reproduction has a strong advantage over parthenogenesis and is able to overcome the two-fold cost of sex. However Maynard Smith concluded that the model was ineffective, because the advantages of sexual reproduction were lost if the different selective features of a patch are correlated, or if several genetic loci are involved in adapting to a single selective feature.
Taylor (1979) analyzed the sib-competition model mathematically. Bulmer (1980) was able to extend the analysis by incorporating quantitative genetics. However, Barton and Post (1986) criticized these developments for not taking environmental correlations into account. In the last thirty years, there was no serious attempt to evaluate the sib-competition as a factor potentially favoring sexual reproduction.
In the present paper, we investigate a sib-competition model with modified assumptions and with a broader parameter range. A large number of environmental factors and the variance of fitness among the most adaptive phenotypes greatly favor the advantage of sexual reproduction. We also identify processes that reduce the advantage of sexual reproduction. We conclude that intense sib-competition is an important process for maintaining sex, given suitable conditions are met.
Sib-competition model
We start with the sib-competition model proposed by Maynard Smith (1976, 1978).
However we here consider species with separate sexes (males and females) rather than the one with hermaphrodites. The model considers the dynamics of sexual and asexual organisms competing within a single Mendelian population, which consists of a number of patches. The environment in each patch varies greatly between patches and between generations.
Population structure and reproduction of sexual and asexual organisms
To illustrate the population structure, in Fig. 1A we show a population consisting only of sexual organisms as an example. We are considering a dioecious species (i.e., with separate sexes) where the sex ratio is 1:1. For simplicity we assume that the genome is haploid. The environment consists of many patches. Multiple individuals live in the
same patch, grow, and compete with each other (such as feeding larvae of insects).
Finally, only a single individual per patch survives. All the survivors from each patch are then combined into a single breeding population and random mating takes place. We assume that each female mates with only one male. As a result, offspring that have the same mother also have the same father. Females lay eggs in a patch and the number of females that can enter a patch (R) is restricted. Each female produces N offspring. This means that RN offspring compete within each patch. As time passes, the number of offspring in a patch decreases until only one remains. This survivor (or ‘winner’) is determined randomly from the individuals that are best adapted to the environment.
Next, we consider a population consisting only of parthenogenetic (i.e., asexual) organisms (Fig. 1B). Survivors from each patch are combined in a single breeding population and randomly enter patches to lay eggs. The number of females that can enter a patch is R, and each female produces N offspring.
Finally, we consider a mixed population consisting of both sexual and asexual organisms (Fig. 1C). In each patch, both sexual females and asexual individuals lay eggs. The eggs hatch, larvae grow, and after intense competition only one individual survives. All the survivors are combined into a single breeding population and sexual females mate randomly with sexual males. Next, sexual females and parthenogenetic individuals randomly enter patches to lay eggs. The number of egg-laying individuals in a patch is R, and each produces N offspring before dying. Taking into account the ratio of sexual to asexual organisms in the breeding population (including the number of males), a sexual individual is only half as likely to become an egg-laying individual as an asexual individual, representing the two-fold cost of sex.
Competition within a patch and adaptation to the local environment
Within each patch, NR individuals (both sexual and asexual) compete and only the individual that is the most adapted to the local environment survives. To determine the fitness of each individual, we define its "score" as follows: There are five environmental factors, each with two states. For example, if the first factor is temperature, the environment may be either hot or cold. If the second factor is humidity, the environment is either wet or dry. Therefore, each of five factors has two possible values and there are
2! = 32 possible overall environmental states. The environmental state of each patch is
determined independently and chosen randomly from the 32 possible overall states.
For each combination of five environmental factors (i.e., the 32 environmental states) there are 32 possible phenotypes, and each of these matches one overall environmental state. For example, if the phenotype of an individual is AbCDe and the environmental state is AbCDe, then the score is five, because all five aspects of the phenotype match the overall environmental state. However, if the environmental state is ABCDE, the score of phenotype AbCDe is three because there are three matches and two mismatches between the five phenotypic aspects and the overall environmental state. In this way, matching the local environment determines the scores of 32 phenotypes. The score may be one of six possible values: from zero to five. If only one individual from the NR offspring has the highest score, it will be the survivor. If more than one individual has the same highest score, one of these is selected randomly to be the winner.
The phenotypes of siblings produced by the same sexual mother are often different, but all siblings from the same asexual (parthenogenetic) mother have exactly the same phenotype. Hence, a sexual mother has a greater chance of producing offspring that achieve the highest score (i.e., are the most adapted to the local environment). Therefore sexually reproducing organisms have an advantage, despite the two-fold cost of sex.
Environmental correlations
Maynard Smith (1976, 1978) also used the model to investigate what would happen if different environmental factors were correlated. He explained this situation by saying
"if hot places are always dry and cold places wet, this is formally equivalent to there being only one feature with two states, 'hot and dry' or 'cold and wet'". These correlations effectively reduce environmental heterogeneity, decreasing the advantage sexual organisms have. Maynard Smith (1978) pointed out that multiple loci controlling the same trait may also reduce the advantage that sexual organisms have: "Alleles A1 and A2, at different loci, adapt the individual to high temperatures, and a1 and a2 to low temperatures. Then genotypes of high fitness will be either A1A2 or a1a2".
The relative advantage of sexual reproduction
The solid line in Figure 2A illustrates how the frequency of sexual organisms in the population changed over the generations. The number of sexual organisms was
originally 50% (i.e., there was an equal proportion of sexual and asexual organisms), but increased as time passed and was 64% by the tenth generation, implying that sexual reproduction conferred a small advantage. The parameters included were: the number of patches (L; which is also the number of individuals in the reproductive population) was 200, the number of mothers laying eggs in a single patch (R) was six, and the number of offspring (siblings) per mother (N) was eight. Therefore, the total number of competitors in a patch (RN) was 48. Numerical analyses using Maynard Smith’s (1976) sib-competition model demonstrated that as the total number of competing individuals within a patch (RN) increased, the advantage of reproducing sexually also increased.
Sexual organisms have an advantage over asexual ones, when the number of competitors in a patch (RN) is greater than 40, as illustrated in the left panel of Figure 3A.
However sexual reproduction lost its advantage if some environmental factors were correlated or if multiple genes control the same trait. The broken line in Figure 2A shows that the proportion of sexual organisms decreased as time passed if two environmental factors were correlated. The parameters were the same as for the solid line (R = 6 and N = 8). Based on this observation, Maynard Smith (1976, 1978) concluded that the mechanism was unlikely to be effective.
By examining simulations of the model, we observed that the following two aspects strongly jeopardize the relative advantage of sexual reproduction:
(1) Some sexual siblings may have the same phenotype
Some sexual siblings had the same phenotypes. For example, six siblings had not six phenotypes but an average of 3.9 (65%) phenotypes and eight siblings had not eight phenotypes but an average of 4.6 (58%) phenotypes (Fig. 4A). The number of sexual sibling phenotypes (solid bars) was significantly smaller than the number of siblings (open bars), suggesting that a fraction of sexual siblings from the same mother had the same phenotypes (note: the striped bars are described in section 3).
(2) Both sexual and asexual organisms may have the highest score in a patch
Asexual (parthenogenetic) reproduction generated many organisms with the same phenotype and the same score. In contrast, the number of sexual offspring with the same score was small. Since the winner in a patch is chosen randomly among those achieving the highest score, when both sexual and asexual organisms had the highest score an asexual organism was likely to be the winner. Figure 4B illustrates the proportion of
patches in which both sexual and asexual organisms had the highest score; it was 23%
when RN = 20, and 28% when RN = 40.
Revised sib-competition model with enhanced advantage of sex
The simplest argument for the superiority of sexual reproduction suggests there is an N-fold advantage. This occurs if the advantage of sexual organisms over asexual ones is equal to the number of phenotypes among offspring of a sexual mother and all the phenotypes are different. However, simulations of the model suggest that the sexual sibling advantage is less than N. Therefore, we revised the model by adjusting the following two assumptions to increase the advantage of sexual organisms over asexual ones:
(1) The score for matching the local environment can vary between factors.
In the original version of the model, the score of a phenotype matching each environmental factor was one. To reduce the chance of different phenotypes having the same total score, we adjusted the score for matching the local environment by varying it stochastically among factors. Therefore, in the revised version of the model, the score assigned for matching a phenotype with a local environmental factor followed a uniform distribution between 0.5 and 1.0, sampled independently among factors, patches, and generations. This modification greatly reduced the probability for different phenotypes to have the same high score.
(2) The number of environmental factors was increased.
We increased the number of environmental factors to more than five. For many organisms, especially during a period of development and growth, fitness is affected by many different environmental factors including abiotic factors (e.g., temperature, humidity, nutrients, and substrate availability) and biotic factors (e.g., the presence or absence of predators, parasites, prey, competitors, and symbionts). Each of these factors has many values. We think that ten environmental factors, each with two states, is worthwhile testing.
The evolutionary advantage of sex enhanced
The revised version of the sib-competition model, including the two changes described above, demonstrated that sexual reproduction has an increased advantage.
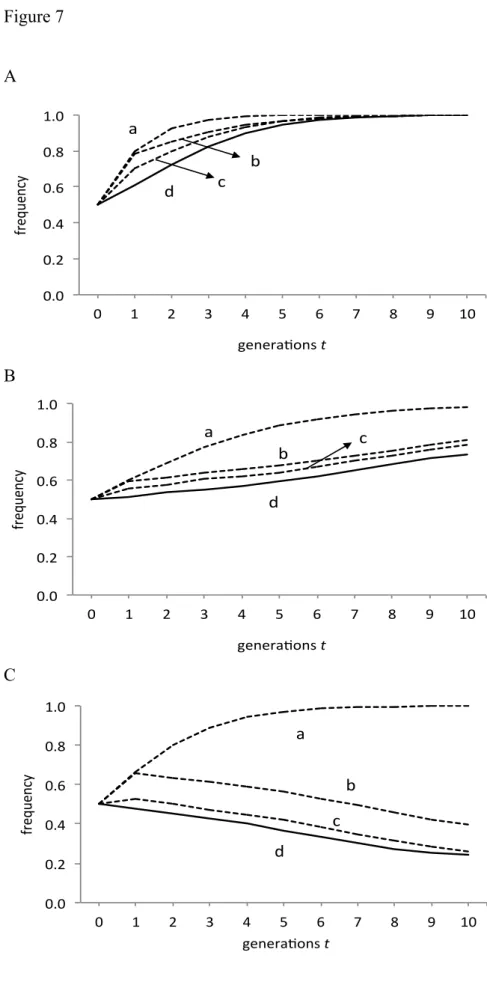
Figures 2B and 2C illustrate this when R = 6 and N = 8, as in the original
study by Maynard Smith (1976).
Figure 2B demonstrates the effect of changing the fixed scoring system to the flexible one. Figure 2C demonstrates the effect of additionally increasing the number of environmental factors from 5 to 10. The advantage of reproducing sexually increased significantly. When both adjustments were made to the model, sexual organisms were at an advantage over asexual ones even if three pairs of environmental factors were correlated.
Figure 3 illustrates the effect of increasing R and N. In the original version of the model, sexual reproduction had an advantage over asexual reproduction when RN was greater than 40 (left panel of Figure 3A), but lost this advantage for all combinations of R (number of mothers) and N (number of siblings) if environmental factors were correlated (right panel of Figure 3A). In contrast, in the revised version of the model that included flexible scoring and ten environmental factors, sexual reproduction has an advantage if the number of competitors is greater than 20 (left panel of Figure 3C), even in correlated environments (right panel of Figure 3C).
The striped bars in Figure 4A demonstrate that the phenotypic diversity of sexual siblings in the revised version of the model is greater than in the original version.
For example, when N = 6, the average number of sexual sibling phenotypes in the original version was 65% of the number of siblings (N = 6), but in the revised version it was 92%. Similarly, when N = 8, the average number of siblings increased from 58% of the number of siblings (N = 8) in the original version to 89% in the revised version.
Here we sought the condition in which almost all sexual individuals have different phenotypes. In the revised version of the model, different phenotypes have different scores. In most cases, sexual siblings differed from one another in their phenotypes and fitness. Therefore, the likelihood of the highest scores appearing in both sexual and asexual offspring became small.
Realized advantage of sexual versus asexual reproduction
The competition between sexual and asexual organisms is represented by changes in their relative frequency. We can measure the realized advantage for the two types of organism by the change in their proportions. Let 𝑥! and 1−𝑥! be the proportions of sexual and asexual organisms, respectively. The next generation would alter the relative fitness of the two types of organism, as follows:
!!!!
!!!!!! = !!!!!
!
!!
!! !, (1)
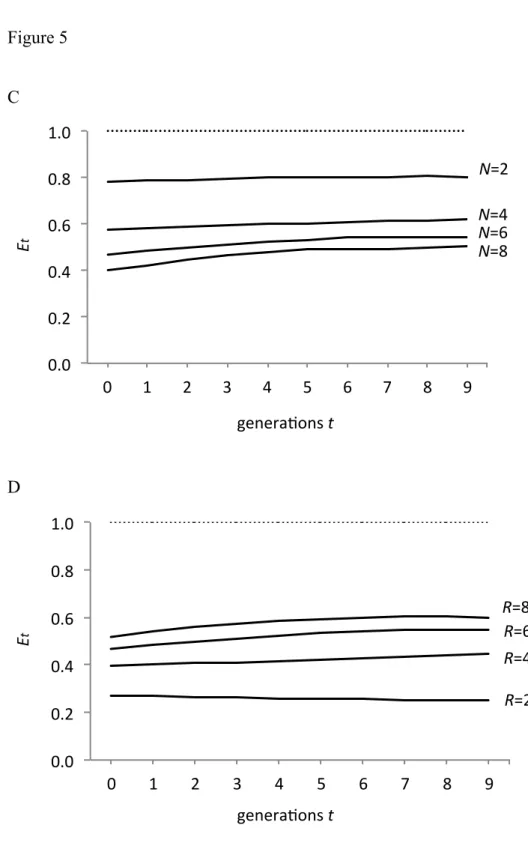
where 𝑊! 𝑊! ! is the relative fitness of sexual organisms over asexual ones. Using the computer simulation, we can calculate the relative fitness by applying the formula shown in Equation (1). Figures 5A and 5B illustrate some of the results. We notice that the value of 𝐸! did not change significantly over time, suggesting that this value may be used as an index for the realized advantage of sexual reproduction produced by the simulation.
We also noticed that the advantage sexual organisms have is clearly less than , the expected value based on the simple argument above. Therefore, we define the ratio of realized fitness to the expected value using N / 2, as follows:
𝐸!= !!!
! !
!
! , (2)
N / 2 is the value expected according to the following argument: suppose that all the offspring produced by a sexual mother (N) differ, and that different sexual mothers produce offspring with different phenotypes. In contrast, asexual individuals produce offspring with the same phenotype. Therefore, the phenotypic diversity of sexual organisms is N per mother, while each asexual individual produces only a single phenotype. However, sexual organisms incur the two-fold cost of sex, producing a factor of N / 2.
Figures 5C and 5D illustrate these results. 𝐸! is clearly smaller than 1. Figure 5C demonstrates that 𝐸! becomes smaller as N increases, but becomes larger as R increases.
Why is sex not as advantageous as expected?
Here we consider several reasons why the advantage of sexual offspring deviated from the prediction of the simple model, i.e., N / 2.
The number of phenotypes among siblings is smaller than N
Sexually produced offspring from the same mother are more likely to have the same phenotypes than random individuals drawn from the entire population because they have the same mother and father. We counted the number of phenotypes among N individuals produced by the same sexual mother. Figure 4A demonstrates that the
N 2
average number of phenotypes was smaller than the number of siblings.
Sexual siblings with the same mother are similar
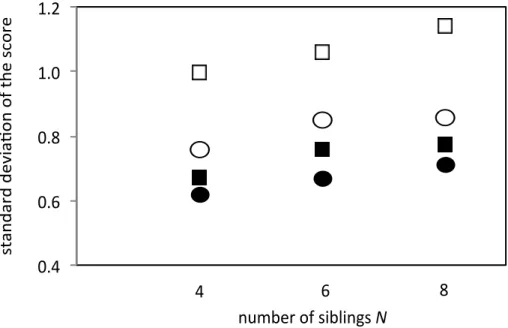
Siblings with different phenotypes may be more similar than non-siblings with different phenotypes. Figure 6 demonstrates that the standard deviation of scores among sexual siblings with different phenotypes is smaller than that of sexual non-siblings randomly selected from the entire population. We examined only those sexual siblings with differing phenotypes. Therefore, the sexual siblings shown in Figure 6 had the same number of phenotypes as the sexual non-siblings. This implies that even if siblings differ in phenotype (i.e., the combination of the five or ten factors), their overall scores may be more similar than is the case for non-siblings. Since only the individual with the highest score wins, a smaller standard deviation from the same mean score is a disadvantage. In Figure 6, the standard deviation in sexual siblings is about 90% of the value in non-siblings for five environmental factors and approximately 75 to 80% of the value for ten environmental factors.
Natural selection within each patch is ineffective
Natural selection operates within each patch because of the competition between sexual and asexual organisms. However the number of individuals in the same patch is finite and often rather small. If this number is very small, the advantage sexual organisms have over asexual ones is weak. For an extreme example, consider the case where R = 1 and each patch receives either a sexual or an asexual individual only. Since there is no competition within patches, sexual organisms have no advantage. In contrast, asexual organisms contribute double the number of egg-laying individuals from the reproductive pool providing them with an advantage over sexual organisms.
For R in general we present the following argument: Let 𝑥! be the fraction of sexual organisms in the reproductive pool. Due to the two-fold advantage asexual organisms have, the fraction of egg-laying individuals in all patches is 𝑥!/(𝑥!+2(1− 𝑥!)). Because the number of sexual mothers within a patch follows a binomial distribution we have
𝑥!!! = 𝑅 𝑘
𝑥! 𝑥!+2(1−𝑥!)
! 2(1−𝑥!) 𝑥!+2(1−𝑥!)
!!! 𝑘𝑊
𝑘𝑊+(𝑅−𝑘)
!
!!!
. (3)
The right hand side of Eq. (3) is a sum of the product of two factors. The first is the probability of each case of the number of sexual mother (R) that follows binomial distribution, and the second is the proportion of the number of sexual phenotype with each case of R. W is the relative fitness of sexual organisms within each patch.
When R is very large, k following binomial distribution would concentrates near 𝑘~𝑥!/(𝑥!+2(1−𝑥!)). Then Eq. (3) becomes
𝑥!!! = 𝑥!𝑊/(𝑥!W+2(1−𝑥!)), which implies that advantage of sex is W/2.
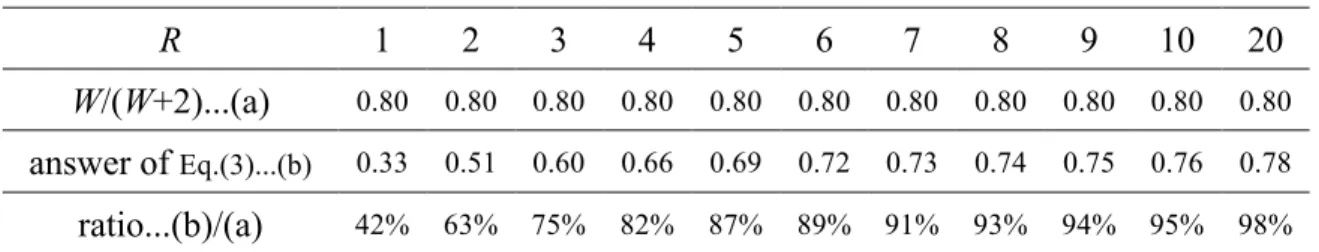
However, especially for small R, Equation (3) shows that the advantage of sexual type is clearly smaller than this case, as shown in Table 1.
Hence we can summarize that the advantage sexual organisms have can be reduced by three mechanisms: [1] reduced number of phenotypes among siblings, [2]
similarity of siblings with different phenotypes, and [3] smallness of local populations.
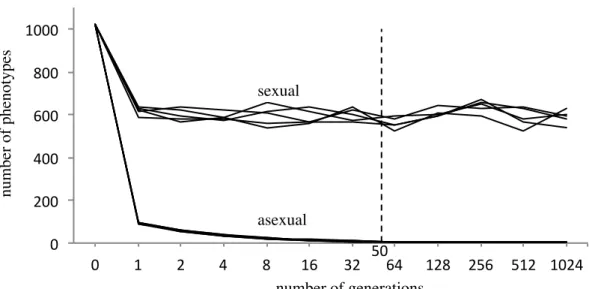
To quantify each of these effects, we ran several simulations incorporating some of these conditions and compared the results with the original model. Figure 7A shows how the proportion of sexual organisms changes over the generations when R = 6 and N
= 8. The line at the bottom is the original model simulation. In contrast, the line at the top is generated by the following simple equation:
𝑥!!! = !!!
!!!!!(!!!!)
(4)
which indicates that the relative fitness of sexual organisms equals N / 2. This overestimated the proportion of sexual organisms, but in both cases the outcome was the same and sexual organisms won.
The second line from the top is produced by the formula shown in Equation (4) where the number of phenotypes was replaced by the average value from the computer simulation. This is the average from different mothers in each generation. It differed between generations and was approximately 7 (i.e., less than N = 8). These curves demonstrate the effect of [1] reduced number of phenotypes among siblings and are more similar to the results observed.
The third line from the top is produced by the formula shown in Equation (3), where N was replaced by the observed number of phenotypes. This figure was the average taken from different sexual mothers and it varied between generations. The analysis tests the effect of stochastic variation in egg-laying individuals following a binomial distribution. It considered both [1] the reduced number of phenotypes among
siblings and [3] the smallness of local populations. The plot (third line from the top) was quite similar to the observed results (the lowest line), but overestimated them a little. This is because it did not take into account [2] the similarity of siblings with different phenotypes, as demonstrated by the lower standard deviation of the sexual sibling scores compared with that of the sexual non-siblings.
Figures 7B and 7C illustrate other examples using different parameters. In both figures the bottom line represents the observed results and the other lines are predictions based on adjusting some of the parameters. These also overestimated the proportion of sexual organisms, but as more parameters were included the predictions became more accurate.
In Figure 7B, the result of competition between sexual and asexual organisms was predicted correctly, although the speed of change was not. In Figure 7C, the top line suggested that sexual organisms would prevail if the fitness value was equal to N / 2, but the curve demonstrated that asexual organisms won. Both modifications correctly predicted the outcome, but the third line from the top proved to be the most accurate, taking both [1] and [3] into account.
Environmental correlations reduce the advantage of sex
When a pair of environment factors was correlated, the advantage of sexual reproduction was considerably reduced. Strong environmental correlation reduces the effective number of environmental factors. For example, if an environment has two factors A/a and B/b that are strongly correlated resulting in the actual states AB and ab but never Ab or aB, then effectively it only has a single factor with two states. In contrast, because phenotypes are coded using two separate loci (A/a and B/b), phenotype AB only fits environment AB and phenotype ab only fits environment ab.
Phenotypes aB and Ab are not as well adapted and are created by recombination from potentially fitter phenotypes (AB and ab) during sexual reproduction. Having phenotypes with lower scores is a disadvantage for sexual organisms compared with asexual ones. This disadvantage, resulting from pairing of environmental factors should be reduced as the total number of loci increases. In addition, in the environment with n aspects including a tightly correlated pair, sexual reproduction would be favored less strongly than in the environment with n-1 aspects. This is because, in the latter, 2n−1 combinations of aspects occur with equal probability, whilst, in the former, some
combinations of aspects occur more frequently than others.
Discussion
In Maynard Smith’s sib-competition model, competition within each patch is intense and only the individual that best matches the local environment survives. The phenotype that fits best is unpredictable and varies between patches and across generations.
Therefore, a mother's reproductive success increases with the phenotypic diversity of her offspring, because the likelihood of one of her offspring achieving the highest score in a patch then increases with the number of her offspring. In contrast, an asexual mother has a low probability of generating the fittest individual because all her offspring have the same phenotype. This suggests that we might be able to estimate the advantage sexual organisms have from the number of offspring produced by a mother.
However, this would overestimate the advantage of sexual reproduction, because some sexual siblings have the same phenotype. In addition, both sexual and asexual organisms can have the highest score in a patch. In this study, we examined a version of the model in which the score for matching the local environment varied stochastically and independently between factors, patches, and generations. This modification greatly reduced the chance of two different phenotypes having the same highest score. In addition, we increased the number of environmental factors in the model to more than five.
However, the advantage of reproducing sexually was not as large as predicted by the simplest model based on the assumption that all sexual offspring differ in phenotype. We identified the following three factors responsible for this: [1] some siblings have the same phenotype; [2] the variance of score among sexual siblings with differing phenotypes is smaller than among non-siblings; and [3] the low number of egg-laying individuals within each patch reduces the effectiveness of natural selection.
We also discussed the effect that environmental correlations have on reducing the advantages of sexual reproduction.
We demonstrated that increasing the variation in scores for matching phenotypes with the local environment enhances the advantage of reproducing sexually because it reduces the likelihood of both sexual and asexual organisms achieving the highest score simultaneously. However, we assumed that individuals in the same patch and with the same phenotype had the same score. Alternatively, there could be
additional variation between individuals with the same phenotype in the same patch.
This would benefit asexual reproduction because asexual organisms are more likely to generate a number of individuals with the same highest score. This effect should be tested by future theoretical studies.
We believe that the assumptions adopted by the sib-competition model are plausible and ecologically sound, although their effects may be difficult to quantify. The sib-competition model suggests that sexual reproduction has a strong advantage if:
sib-competition is significant; the environment is heterogeneous and varies over time;
there are numerous environmental factors; and there is pressure to adapt. The effect of the intensity of the competition should also be tested in future work.
Despite its critics (e.g., Barton et al. 2007), this mechanism still remains one of the most important and promising hypotheses to explain the evolutionary maintenance of sex.
However, further theoretical studies will be needed to establish which of the many hypotheses proposed provides the best answer to this question.
References
Agrawal, A.F., 2006. Evolution of sex: why do organisms shuffle their genotype?
Current Biol, 16, 696-704.
Barton, N.H., Post, R.J., 1986. Sibling competition and the advantage of mixed families.
J. Theor. Biol. 120, 381-387.
Barton, N.H., Otto, S.P., 2005. Evolution of recombination due to random drift.
Genetics 169, 2353-2370
Barton, N.H., Briggs, D.E.G., Eisen, J.A., Goldstein, D.B., Patel, N.H., 2007. Evolution of genetic systems. Cold Springer Harbor Laboratory House, New York.
Bell, G., 1982. The Masterpiece of Nature, University of California Press, Berkeley.
Bulmer, M.G., 1980. The sib competition model for the maintenance of sex and recombination. J. Theor. Biol. 82, 335-345.
Hamilton, W.D., 1980. Sex versus non-sex versus parasite. Oikos 35, 282-290.
Hartfield, N. and R. D. Keightley. 2012. Current hypotheses for the evolution of sex and recombination. Integrative Zoology 7: 192-209.
Fisher, R.A., 1930. The Genetical Theory of Natural Selection. Clarendon Press, Oxford.
Maynard Smith, J., 1976. A short-term advantage for sex and recombination through sib-competition, J. Theor. Biol. 63, 245-258.
Maynard Smith, J., 1978. The Evolution of Sex. Cambridge University Press, Cambridge.
Mittledorf, J., 2016. Aging is a Group-selected Adaptation: Theory, Evidence, and Medical Implications. Boca Raton, FL: CRC Press.
Muller, H.J., 1932. Some genetic aspect of sex. Am. Nat. 66, 118-138.
Otto, S.P. 2009. The evolutionary enigma of Sex. Am. Nat. 174, S1-S14.
Taylor, P.D., 1979. An analytical model for a short-term advantage for sex. J. Theor.
Biol. 81, 407-421.
Williams, G.C., Mitton, J.B., 1973. Why reproduce sexually? J. Theor. Biol. 39, 545-554.
Williams, G.C., 1975. Sex and Evolution. Princeton University Press, Princeton.
Captions to table and figures Table 1
Comparisons of the solution to Equation (3) with W / (W+2) where W = 8, 𝑥! = 0.5, and R = 2–20.
Figure 1
Population models. (A) A population consisting of sexual organisms only. (B) A population consisting of asexual organisms only, where siblings have the same genotype. (C) A population consisting of both sexual and asexual organisms.
Figure 2
The frequency of sexual organisms. (A) Five environmental factors. Original version.
(B) Five environmental factors. Flexible scoring. (C) Ten environmental factors.
Flexible scoring. Parameters are: R = 6 and N = 8. Horizontal axis is for time (number of generations). Labels for lines are: (a) when environmental factors are independent of each other, (b) when one pair of environmental factors (among two factors) are
correlated strongly, but all other factors are independent, (c) when two pairs of
environmental factors (among four factors) are correlated strongly, but all other factors are independent, and (d) when three pairs of environmental factors (among six factors) are correlated strongly, but other factors are independent.
Figure 3
The frequency of sexual organisms for different combinations of R and N. The section surrounded by a line in bold is where sexual organisms are present at a frequency of greater than 50% in the tenth generation. The figure on the left hand side does not include environmental correlations, while the figure on the right hand side does. The numbers in each grid are the frequencies of sexual organisms at the tenth generation.
These notes also apply to Figures 3B and 3C. (A) The original version of the model. (B) The revised version of the model with flexible scoring and 5 environments.
(C) The revised version of the model with flexible scoring and 10 environments.
Figure 4
Two considerations that strongly jeopardize the relative advantage sexual reproduction
has in the original model. (A) The number of phenotypes and sexual siblings in the simulation. Each open bar (a) represents the maximum number of phenotypes, which is the same as the number of siblings. Each closed bar (b) represents the number of phenotypes of sexual siblings in the original simulation. The striped bar (c) shows the same information for the revised simulation. The ratio of the number of phenotypes and number of siblings in the original [(b) / (a)] and revised versions [(c) / (a)] is greater in the revised version. The greater the number of siblings, the smaller the ratio in both versions. (B) Closed circles indicate the number of patches in which both sexual and asexual organisms have the highest score. The total number of patches (L) was 200. The horizontal axis is the product RN.
Figure 5
Realized fitness of sexual organisms compared with asexual ones, and , the ratio of the realized fitness to N / 2. Time (generations) is shown on the horizontal axis. (A) Different curves for different values of N, indicated by numerals. R = 6 for all curves.
(B) Different curves for different values of R, indicated by numerals. N = 6 for all curves. The dotted line indicates N / 2. Realized fitness increases with R, but is always less than N / 2. (C) The value of decreases with N. Parameters are the same as in (A). (D) The value of increases with R. Parameters were the same as in (B).
Figure 6
Standard deviation of the scores of sexual organisms. Flexible scoring was assumed.
Open squares and circles show the standard deviation of the scores of sexual non-siblings (open squares) and sexual siblings (open circles) where there were ten environmental factors. Closed squares and circles show the same information for sexual non-siblings (closed squares) and sexual siblings (closed circles) where there were five environmental factors. The horizontal axis is the number of offspring per mother (N).
Figure 7
The proportion of sexual organisms. Horizontal axis is for time (number of generations).
Parameters were: (A) R = 6 and N = 8. (B) R = 8 and N = 3. (C) R = 3 and N = 4.
In each graph, the line at the top (a) shows the predicted plot where N / 2. The second line from the top (b) shows the effect of factor [1]. The number of phenotypes is the
Et
Et Et
value observed in evolutionary simulations. The third line from the top (c) shows the effects of factors [1] and [3]. The number of phenotype from the simulation is substituted for Eq. (3). The solid line at the bottom (d) shows the result of the model simulation.
Table Table 1
R 1 2 3 4 5 6 7 8 9 10 20
W/(W+2)...(a) 0.80 0.80 0.80 0.80 0.80 0.80 0.80 0.80 0.80 0.80 0.80
answer of Eq.(3)...(b) 0.33 0.51 0.60 0.66 0.69 0.72 0.73 0.74 0.75 0.76 0.78
ratio...(b)/(a) 42% 63% 75% 82% 87% 89% 91% 93% 94% 95% 98%
Figures Figure 1
A
B
C
compe&tors A+single+winner
reproduc&ve+popula&on
sexual asexual
S+sexual+individuals A+asexual+individuals
S/2+sexual+females+
S/2+sexual+males A+asexual+females+
sexual+ sexual+ asexual+ asexual+ asexual+ asexual+
Figure 2
A
B
C
0%#
20%#
40%#
60%#
80%#
100%#
0# 1# 2# 3# 4# 5# 6# 7# 8# 9# 10#
frequency
genera7ons#t a
b
0%#
20%#
40%#
60%#
80%#
100%#
0# 1# 2# 3# 4# 5# 6# 7# 8# 9# 10#
frequency
genera7ons#t
a
b c
0%#
20%#
40%#
60%#
80%#
100%#
0# 1# 2# 3# 4# 5# 6# 7# 8# 9# 10#
frequency
genera7ons#t
a
b d
Figure3
A
B
C
Figure 4
A
B 0"
2"
4"
6"
8"
10"
1" 2" 3" 4" 5" 6" 7" 8" 9" 10"
"number"of"phenotypes
"number"of"siblings"N
0"
50"
100"
150"
200"
number"of"patches(L)
"number"of"compe6tors"RN
"
75 100
"
" 50
" 25
0
Figure 5
A
B
0.0#
0.5#
1.0#
1.5#
2.0#
2.5#
3.0#
0# 1# 2# 3# 4# 5# 6# 7# 8# 9#
rela1ve#fitness
genera1ons#t
N=6 N=4 N=2 N=8
0.0#
0.5#
1.0#
1.5#
2.0#
2.5#
3.0#
3.5#
0# 1# 2# 3# 4# 5# 6# 7# 8# 9#
rela1ve#fitness
genera1ons#t
R=6 R=4 R=2 R=8 N/2
Figure 5
C
D
0.0#
0.2#
0.4#
0.6#
0.8#
1.0#
0# 1# 2# 3# 4# 5# 6# 7# 8# 9#
##Et
genera2ons#t
N=6N=8 N=4 N=2
0.0#
0.2#
0.4#
0.6#
0.8#
1.0#
0# 1# 2# 3# 4# 5# 6# 7# 8# 9#
#Et
genera2ons#t
R=8 R=6 R=2 R=4
Figure 6
0.4$
0.6$
0.8$
1.0$
1.2$
standard$devia2on$of$the$score
number$of$siblings$N 6 8
4
Figure 7
A
B
C
0.0#
0.2#
0.4#
0.6#
0.8#
1.0#
0# 1# 2# 3# 4# 5# 6# 7# 8# 9# 10#
frequency
genera7ons#t a
b d c
0.0#
0.2#
0.4#
0.6#
0.8#
1.0#
0# 1# 2# 3# 4# 5# 6# 7# 8# 9# 10#
frequency
genera7ons#t
a
b c
d
0.0#
0.2#
0.4#
0.6#
0.8#
1.0#
0# 1# 2# 3# 4# 5# 6# 7# 8# 9# 10#
frequency
genera7ons#t
a
b c d
Chapter 2
Advantages of sexual reproduction resulting from sibling diversity:
effects of selection intensity, environmental variance, and reduced genetic diversity
The study of this chapter, done in collaboration with Dr. Yoh Iwasa, was accepted for the publication in Evolutionary Ecology Research
Introduction
About 40 years ago, John Maynard Smith pointed out the two-fold cost of sex and noted that the selective advantage of sexual reproduction is an important and difficult theoretical problem in evolutionary biology (Maynard Smith, 1978). Since then, many hypotheses purporting to explain the advantages of sex have been proposed. For instance, Hamilton (1980) proposed that the presence of pathogens or parasites would encourage sexual reproduction because they would tend to generate strong selection favoring currently rare host genotypes, with the intensity and direction of selection changing over generations (the “Red Queen” hypothesis). Sexual reproduction slows the irreversible accumulation of deleterious mutations (Muller, 1964), reduces the genetic load of deleterious mutations compared with asexual reproduction (Kondrashov, 1988), and disrupts linkage disequilibrium created by random genetic drift (Fisher, 1939;
Muller, 1932; Barton and Otto, 2005; Barton et al., 2007; Otto, 2009).
G.C. Williams proposed that the diversity of offspring might be the main reason for the maintenance of sexual reproduction (Lottery Hypothesis: Williams and Mitton, 1973; Williams, 1975). Maynard Smith (1976; 1978) formalized this idea as the
“sib-competition model”. However, Maynard Smith concluded that the sib-competition model was unable to maintain sex in the face of the two-fold cost of sex when different aspects of the environments (e.g., temperature and humidity) are strongly correlated.
Since then, only a few theoretical studies have further investigated the sib-competition model (Taylor, 1979; Bulmer, 1980; Barton and Post, 1986). The general consensus within the theoretical biology community is that sibling diversity is unlikely to play an important role in the maintenance of sex. In a twin paper (Douge and Iwasa, 2017), we explored the conditions under which sib-competition works more effectively than observed in previous studies. We found that if the number of environmental aspect were larger and if the fitness of different phenotypes differed between patches, sexual reproduction would enjoy a significant advantage over asexual reproduction and could be maintained even in correlated environments.
In the sib-competition model (Maynard Smith, 1976; 1978), an organism’s habitat is composed of a large number of small patches in which sexual and asexual mothers oviposit a number of offspring. Larvae compete with one another, and only a single individual can survive. The fitness of an individual is strongly determined by the match between its phenotype and the local environment in a patch. As the closest match
is achieved by a single phenotype, sexual mothers have a strong advantage over asexual mothers: the offspring of sexual mothers are more likely to be diverse, whereas asexual mothers have many offspring of the same phenotype. Hence, the likelihood of a sexual mother bearing an offspring achieving the closest match between the phenotype and the local environment is much higher than the likelihood of an average asexual mother doing so. However, this advantage would be suppressed if the closest match were achieved by different phenotypes, as many individuals would have an equal chance of survival under such conditions; this provides an advantage to asexual mothers bearing many offspring of the same phenotype. This outcome often occurs in Maynard Smith's simulations (Douge and Iwasa, 2017). In the modified version studied in a twin paper (Douge and Iwasa 2017), the matching score differed among patches, and there was a larger number of environmental aspects. As a result, the likelihood of different phenotypes achieving the closest match with the environment was greatly reduced, and sexual reproduction could be maintained in the face of the two-fold cost of sex.
In the current paper, following Douge and Iwasa (2017), we further study several different ways of modifying the sib-competition model such that the evolution of sex may be encouraged or discouraged.
First, in our previous sib-competition models, only the single individual with the best matching score could survive per patch. However, the advantage of the sexual type could be reduced if selection were to become milder (e.g., if multiple individuals per patch could survive). Consider the case in which the 10 individuals with the highest matching scores can survive. The sexual type would have the advantage of generating the individual with the best score. Perhaps it could also achieve the second-best score.
However, if the third-highest score were achieved by an asexual type, then the fourth, fifth, and other remaining survivors (seven in total) would also be asexual, because all offspring of the asexual type would have equal fitness. Hence, increasing the number of survivors per patch would reduce the advantage of sex.
Second, in Douge and Iwasa (2017), the scores of individuals with the same phenotype in the same patch were assumed to be the same, but the scores of different phenotypes were different. Under this assumption, when the closest match between the phenotype and the environment is achieved by two different phenotypes (one sexual and one asexual), the larger number of the asexual type does not contribute to its success.
However, individuals growing in the same patch may differ in fitness owing to
developmental differences. This environmental source of variance should favor asexual mothers who have many offspring with the same phenotype. If this variance were sufficiently large, the larger number of individuals of the asexual type might contribute to the success of the latter, reducing the advantage of the sexual type. Based on the quantitative genetics argument, Bulmer (1980) concluded that the advantage of sex should disappear if the environmental variance were as large as the additive genetic variance. However, we must know how much smaller the environmental variance needs to be for the advantage of sex through sib-competition to persist.
Third, in the evolutionary simulations in Douge and Iwasa (2017), as well as in many previous theoretical papers focusing on sib-competition models, the simulations started from an initial population in which all phenotypes were available. This may be acceptable when the number of patches is infinitely large and when each phenotype finds some patches in which it achieves the best match with the local environment.
However, the diversity of environments realized in a particular generation might be limited. For example, if there were 10 aspects of the environment, each having two states, there would be 1024 possible combinations of environmental states. In a twin paper, these 1024 different environments would exist in some patches every generation.
A more realistic assumption is that only, say, 20 of 1024 different environmental combinations exist in a particular generation. Under such conditions, the loss of genetic diversity would occur very quickly, especially for the asexual type. In contrast, the sexual type can recover a phenotype that does not exist in one generation by the genetic recombination of two types that exist in that generation. Hence, the loss of genetic diversity should be much slower for the sexual type than for the asexual type.
In the following sections, we consider the effects of these modifications and examine their impacts on the importance of sib-competition in the maintenance of sex.
Sib-competition model
The sib-competition model explaining the evolution of sex was first formalized by Maynard Smith (1976; 1978) based on the arguments developed by Williams and Mitton (1973) and Williams (1975). In a twin paper, we developed the model with a few additional modifications that strengthen the evolutionary advantage of sexual reproduction (Douge and Iwasa, 2017). Here, we explain the model briefly (see Douge and Iwasa, 2017 for more details).
We consider insect-like organisms. The population includes two types of individuals, sexual and asexual. The entire habitat consists of a large number of patches for larvae. In the adult stage, the organisms join a single pool in which females and males of sexual species mate randomly. Then each patch receives R adults (sexual females and asexual individuals), each of which oviposits N offspring. They compete with each other fiercely, and only a single winner survives per patch. These winners from different patches join a single adult pool. Half of all sexual adults are males who do not lay eggs, whereas all asexual individuals lay eggs. This represents the two-fold cost of sex, favoring the asexual type over the sexual type.
The competition among the larvae within a patch depends on the local environment. The environment within a patch is characterized by the alternative states of the five aspects discussed in Maynard Smith (1976; 1978). There are 25 = 32 different combinations of states that exist at equal frequency in the entire population.
Let A and a be alternative environmental states of the first aspect, B and b be alternative states of the second aspect, and so on. Thus, there are five environmental aspects (A/a.
B/b, C/c, D/d, and E/e), and their combinations are ABcdE, aBCde, and so on.
Individuals are diploid with 5 loci, each segregating two alleles (A/a, B/b, C/c, D/d, and E/e), which correspond to the five environmental aspects. Because complete dominance is assumed, there are 25 = 32 phenotypes. The fitness of a particular phenotype depends on the score, defined as the number of aspects that match its phenotype (say A and A, a and a, B and B, etc.). For example, genotype AABbccDdee has phenotype ABcDe, which has three matches with environment aBcde. The winner of larval competition is the one that achieves the highest score among all larvae in the patch. If there were multiple individuals achieving the best score, each of them would be chosen to be the winner with equal probability. Each sexual mother produces genetically diverse offspring, whereas asexual mothers produce N offspring with the same phenotype. Hence, sexual mothers have an advantage concerning the likelihood of one of her N offspring achieving the best score.
The initial population contains both alleles at all five loci. For each locus, the gene frequency of the dominant allele (say A) is chosen to be 1− 2 2≈0.2929 (the recessive allele has frequency 2 2≈0.7071), which leads two phenotypes to appear with equal frequency because of complete dominance.