九州大学学術情報リポジトリ
Kyushu University Institutional Repository
インピーダンス測定による高温酸化物融体の構造評 価
原田, 祐亮
http://hdl.handle.net/2324/2236200
出版情報:九州大学, 2018, 博士(工学), 課程博士 バージョン:
権利関係:
σ
1 1
1-1 1
1-1-1 1
1-1-2 6
1-2 11 13
2 SiO2-R2O R=Li, Na, or K 15
2-1 15 2-2
2-2-1 15
2-2-2 17
2-3 2-3-1
K2O 19 2-3-2
27
2-4 32
33
3 SiO2-RO-R’O (R, R’=Na, K, or Ca) 35
3-1 35
3-2
3-2-1 29Si MAS-NMR 36
3-2-2 37
3-3
3-3-1 29Si MAS-NMR 38
3-3-2
42
3-4 53
54
4 ° 56
4-1 56
4-2
4-2-1 57
4-2-2 ° 58
4-2-3 58
4-3
4-3-1 60
4-3-2 67
4-3-3 73
4-4 79
80
Appendix 81
5 Quasichemical model 90
5-1 90
5-2
5-2-1 Quasichemical model 90
5-2-2 92
5-3
5-3-1 92
5-3-2 100
5-4 110
111
Appendix 112
6 115
1
1-1 1-1-1
1-1, 1-2)
( Network Fomer) (
Network Modifier)
Ii 1-3)
!! = 2!!
(!! +1.4)! (1−1)
Zi i ri i
2 1.4
[Å] Fig.1-1 (1-1)
Ii ρ Al2O3
Fe2O3 4 6 1-4, 1-5) Al2O3
(IV) Al2O3 (VI) Fe2O3(IV) Fe2O3(VI)
Shannon 1-6) Ii
Fig.1-1 SiO2 B2O3 P2O5
!"#!+ 2!!! →!"!!!! (1−2)
Ii Fig.1-1
!"# → !"!!+!!! (1−3)
Ii Al2O3 Fe2O3
ρ
Al2O3 6 (AlO6)
Network modifier
4 (AlO4) Network former
1-7)
Si Ionic radius, ri / Å
Cation-oxygen attraction force, Ii
SiO2
B2O3 P2O5
Fe2O3(IV) Fe2O3(VI) Al2O3(VI) Al2O3(IV)
MgO FeO
Li2O Na2O K2O
CaO SrO BaO
Acidic Oxide
Basic Oxide
Amphoteric Oxide
Fig.1-1 The relationship between cation-oxygen attraction force and ionic radius for various oxides.
4 SiO44-
Fig.1-2 ρ
Fig.1-2 ρ (1)2 Si
(Bridging Oxygen, BO) (2)1 Si
(Non Bridging Oxygen, NBO) (3)Si
(Free Oxygen) (
SiO2 )
1-8)
1-9, 1-10) (Nuclear Magnetic
Resonance, NMR)1-11, 1-12)
° ω NMR
29Si 29Si NMR
29Si NMR SiO44- 1
NMR ( )
1-13) 29Si 1
24 ° NMR
°
1-14) °
1-15)
°
°
° ξ
ρ
1-16)
1-17 1-19) 1-20)
Fig.1-3 1500 50SiO2-50CaO (mol%) (C/S=1)
10mol% ρ Fig.1-3
Fig.1-2 Schematic of the network structure of alkali silicate melt.
C/S=1
Li2O Na2O
K2O CaF2
ρ
1-21,
1-22) θ
Capacitance, C / nF
C/S=1 Li
2O Na
2O K
2O CaF
2@ 1500 °C
Fig.1-3 Comparison of the electrical capacitance values for 50SiO2-50CaO (C/S=1) (mol%) based melts with 10 mol%
additives at 1500 °C.
1-1-2
Z V (1-4) I
(1-5)
! = !!exp (!"#) (1−4) ! = !!exp (!"#+ !) (1−5)
! =!
! (1−6)
°
Cole-Cole Fig.1-4
ρ Z’
Z’’
!! = ! !"#$ (1−7) !!! = ! !"#$ (1−8)
1-23)
Fig.1-4
Fig.1-5 Fig.1-9 ρ
Fig.1-4 Fig.1-9
Fig.1-4 A typical example of nyquist plot and its equivalent circuit.
Fig.1-5 A nyquist plot for the equivalent circuit of a capacitance.
Fig.1-6 A nyquist plot for the equivalent
Fig.1-7 A nyquist plot for the equivalent circuit of a resistance and capacitance in series.
Fig.1-8 A nyquist plot for the equivalent circuit of a resistance and capacitance in parallel.
1-24)
1-25) α 1-26)
Li2O-B2O3-SiO2 1-27)
CaO-MgO-SiO2-Al2O3-MO(MO = FeO, or NiO) 1-28)
Fig.1-4
Fig.1-9 Fig.1-4 Fig.1-9
Fig.1-9 A nyquist plot for the equivalent circuit which consists of a resistance, capacitance and inductance.
ξ
°
1-2
29Si NMR 24
NMR
°
SiO2-R2O (R=Li, Na, or K)
SiO2-Na2O-K2O, SiO2-Na2O-CaO SiO2-K2O-CaO NMR
θ
SiO2-Al2O3-CaO SiO2-Al2O3-MgO
°
ρ 6 1
°
2
3 SiO2-RO-R’O (R, R’=Na, K, or Ca) 2
NMR 4
° ° θ °
°
NMR
5 °
° Quasichemial model θ Quasichemical model
°
ρ 6
References
1-1 R.Yamanaka, K.Ogawa, H.Iritani, and S.Koyama, ISIJ Int. 32 (1992) 136.
1-2 E.Andersson, and D.Sichen, Steel Res. Int., 80 (2009), 544.
1-3 飯田孝道,喜多善史,上田満,森克己,中島邦彦,溶融スラグ・ガラ スの粘性,アグネ技術センター,東京,(2003).
1-4 D.E. Day, and G.E. Rindone, J. Am. Ceram. Soc., 45 (1962), 489.
1-5 K. Nagata, and M. Hayashi, J. Non-Cryst. Solids, 282 (2001), 1.
1-6 R.D. Shannon, Acta Cryst., A32(1976), 751.
1-7 佐々木康,石井邦宜,鉄と鋼,88 (2002), 419.
1-8 J.H. Park, D.J. Min, and H.S. Song, ISIJ Int., 42 (2002), 344.
1-9 D.R. Neuville, Chem. Geol. 229 (2006) 28.
1-10 B. Hehlen, and D.R. Neuville, J. Phys. Chem. B 119 (2015) 4093.
1-11 H. Maekawa, T. Maekawa, K. Kawamura, and T. Yokokawa, J. Phys. Chem.
95 (1991) 6822.
1-12 S. Sukenaga, K. Kanehashi, H. Shibata, N. Saito, and K. Nakashima, Metall.
Mater. Trans. B 47B (2016) 2177.
1-13 T. Watanabe, H. Shimizu, A. Masuda, and H. Saito, Chem. Lett., (1983), 1293.
1-14 T. Yokokawa, and K. Niwa, Trans. JIM, 10 (1969), 3.
1-15 T. Hidayat, D. Shishin, S.A. Decterov, and E. Jak, CALPHAD, 56 (2017), 58.
1-16 Y. Ohta, M. Kitayama, K. Kaneko, S. Toh, F. Shimizu, and K. Morinaga, J.
Am. Ceram. Soc. 88 (2005) 1634.
1-17 N. Saito, K. Kusada, S. Sukenaga, Y. Ohta, and K. Nakashima, ISIJ Int. 52 (2012) 2123.
1-18 Y. Harada, K. Kusada, S. Sukenaga, H. Yamamura, Y. Ueshima, T.
Mizoguchi, N. Saito, and K. Nakashima, ISIJ Int. 54 (2014) 2071.
1-19 Y. Harada, S. Sakaguchi, T. Mizoguchi, N. Saito, and K. Nakashima, ISIJ Int.
57 (2017) 1313.
1-20 Y. Harada, N. Saito, and K. Nakashima, ISIJ Int. 57 (2017) 23.
1-21 I.M. Hodge, M.D. Ingram, and A.R. West, J. Electroanal. Chem. 74 (1976) 125.
1-22 J.T.S. Irvine, D.C. Sinclair, and A.R. West, Adv. Mat. 2 (1990) 132.
1-23 板垣昌幸,電気化学インピーダンス法 第二版,丸善出版,東京,(2011).
1-24 T. Matsuda, K. Ando, M. Myojin, and D. Imamura, JARI Research Journal, (2016), 1.
1-25 上野茂昭,食品と容器,58 (2017), 658.
1-26 朝倉悠太,サプコタアチュタ,丸山修,小阪亮,山根隆志,武居昌宏,
可視化情報学会論文集,33 (2013), 17.
1-27 L.F. Maia, and A.C.M. Rodrigues, Solid State Ionics, 168 (2004), 87.
1-28 S. Chang-yu, and G. Xing-min, Trans. Nonferrous Met. Soc. China, 21 (2011), 1648.
2 SiO2-R2O (R=Li, Na, or K)
2-1
2-1 2-12)
1
° ω
NMR SiO2-R2O(R=Li, Na, or K)
2-2 2-2-1
Table2-1 ρ
29Si MAS-NMR 2-13) SiO2
Li2CO3 Na2CO3 K2CO3(Sigma-Aldrich, Japan) Pt
1540K 30min
No. SiO2 Li2O Na2O K2O
1 50.0 50.0
2 66.7 33.3
3 80.0 20.0
4 66.7 33.3
5 66.7 33.3
Table2-1 The initial compositions (mol%) of the melts employed in this study.
2-2-2
Fig.2-1 ρ
U MoSi2β Al2O3 6
1873K 6mm
B-type(Pt-6Rh/Pt-30Rh) η
HIOKI, IM3500, IMPEDANCE ANALYZER
Thermocouple Pt-20Rh rod
MoSi2
heating element Pt-20Rh crucible Crucible supporter
Impedance analyzer Pt wire
Measuring terminal Guard terminal Cu wire
Fig.2-1 Schematic diagram of the furnace of impedance measurement.
1540K 180
ξ 10mm
Pt-20mass%Rh Pt
Pt
1.0V 50Hz 150kHz
-
Z’=|Z|cos
-Z’’=|Z|sin Z
Cole-Cole
1 ρ Fig.1-4
( )
Rsol
φ Rct
φ φ
Cdl Zw
EIS Spectrum Analyzer2-14, 2-15)
(2-1)
! =!!"# + 1
!"!!" +1 (!!" +!!) (2−1)
2-3
2-3-1 K2O
Fig.2-2 Fig.2-4 1540K 50.0SiO2-50.0K2O 66.7SiO2-33.3K2O 80.0SiO2-20.0K2O (mol%)
ρ
EIS Spectrum analyzer Fig.2-5 ρ
Table2-2
29Si MAS-NMR
NBO/T ρ NBO/T SiO44-
1
2-16) Table2-2 K2O NBO/T
Fig.2-3 66.7SiO2-33.3K2O (mol%)
4.4 R1
R1 Rsol
Fig.2-3 R2
R2 φ Rct C
Cdl Zw
50.0SiO2-50.0K2O 80.0SiO2-20.0K2O (mol%)
φ
φ
θ Fig.2-6 Fig.2-8
NBO/T ρ
Imaginary Impedance, -Z''/ Ω
Real Impedance, Z'/ Ω at 1540K
Fig.2-2 Nyquist plot for 50.0SiO2-50.0K2O (mol%) at 1540K.
Imaginary Impedance, -Z''/ Ω
Real Impedance, Z'/ Ω at 1540K
Fig.2-3 Nyquist plot for 66.7SiO2-33.3K2O (mol%) at 1540K.
Imaginary Impedance, -Z''/ Ω
Real Impedance, Z'/ Ω at 1540K
Fig.2-4 Nyquist plot for 80.0SiO2-20.0K2O (mol%) at 1540K.
No. Rsol (R1) [Ω] Rct (R2) [Ω] Cdl (C) [μF] Zw [Ω] NBO/T
1 (50.0K2O) 4.29 1.52 2.17 12.4 1.98
2 (33.3K2O) 4.37 5.19 0.993 28.7 1.00
3 (20.0K2O) 5.47 6.52 0.226 144 0.51
Table2-2 The values of equivalent circuit components and NBO/T of the melts with changing amount of K2O.
Fig.2-5 Equivalent circuit estimated by fitting method.
NBO/T °
Fig.2-6
NBO/T NBO/T K2O
K+ φ
φ NBO/T Fig.2-9(a)
ρ Fig.2-9(a) K+
NaCl
XPS 2-17) NaCl
Gouy-Chapman–Stern °
2-18)
-
K+ φ
φ NBO/T Fig.2-9(b)
ρ Network Modifier
Fig.2-9 (b) ρ SiO4
SiO4 φ
2-19) SiO4 φ
2-20) NBO/T
K+ K+
2-21)
NBO/T
Solution resistance, Rsol / Ω
at 1540K
Fig.2-6 Relationship between solution resistance and NBO/T for SiO2-K2O system at 1540K.
NBO/T
Charge transfer resistance, Rct / Ω
at 1540K
Fig.2-7 Relationship between charge transfer resistance and NBO/T for SiO2-K2O system at 1540K.
NBO/T Double layer capacitance, Cdl / μF at 1540K
Fig.2-8 Relationship double layer capacitance and NBO/T for SiO2-K2O system at 1540K.
Addition of alkaline oxide
Addition of alkaline oxide
(a)
(b)
Fig.2-9 Schematic illustrations of the effects of the addition of alkaline oxide on (a) double layer thickness and (b) network structure of the silicate melt.
2-3-2
Fig.2-10 Fig.2-11 66.7SiO2-33.3Li2O 66.7SiO2-33.3Na2O mol ρ Fig.2-10 ρ 66.7SiO2-33.3Li2O
ρ Fig.2-3 Fig.2-10 Fig.2-11
Li2O Na2O K2O
Fig.2-5 ρ Table2-3
NBO/T ρ 2-3-1
φ θ
Fig.2-12(a) NBO/T ρ
NBO/T
2-3-1 NBO/T
Fig.2-12(b) ρ Fig.2-12(b)
2-22, 2-23) 60SiO2-40R2O (mol%) (R=Li, Na or K)
1473K Li, Na, K
ρ φ Li+ Na+, K+
2-24) Li
Na K NBO/T
Fig.2-13 Fig.2-14 φ
ρ Fig.2-13 φ
Fig.2-15(a) Li+
K+
ρ Fig.2-15(a) ρ K+ Li+
2-25)
φ 2-26)
K2O φ
Fig.2-14
φ Li+, Na+, K+
SiO2
Li2O K2O Fig.2-15(b)
ρ Fig.2-15(b) K+
Li+ φ
φ Li+ Na+, K+
Li+ K+
2-3-1 K2O
φ
No. Rsol [Ω] Rct [Ω] Cdl [μF] Zw [Ω] NBO/T
4 (Li2O) 4.10 0.437 16.4 18.8 0.93
5 (Na2O) 4.35 2.88 1.69 16.8 0.99
2 (K2O) 4.73 5.19 0.993 28.7 1.00
Table2-3 The values of equivalent circuit components and NBO/T of the melts with changing alkali oxides.
Imaginary Impedance, -Z''/ Ω
Real Impedance, Z'/ Ω at 1540K
Fig.2-10 Nyquist plot for 66.7SiO2-33.3Li2O (mol%), and the enlarged nyquist plot (inset) at 1540K.
Imaginary Impedance, -Z''/ Ω
Real Impedance, Z'/ Ω at 1540K
Fig.2-11 Nyquist plot for 66.7SiO2-33.3Na2O (mol%) at 1540K.
Fig.2-12 Relationship between the solution resistance and (a) NBO/T and (b) ionic radius of alkali ions at 1540K.
NBO/T Ionic radius, ri / Å
(a) (b)
Solution resistance, Rsol / Ω Solution resistance, Rsol / Ω
at 1540K at 1540K
Fig.2-13 Relationship between the charge transfer resistance and ionic radius of alkali ions at 1540K.
Charge transfer resistance, Rct / Ω
Ionic radius, ri / Å
at 1540K
Double layer capacitance, Cdl / μF
Ionic radius, ri / Å
at 1540K
Fig.2-14 Relationship between double layer capacitance and ionic radius of alkali ions at 1540K.
(a)
(b)
Fig.2-15 Schematic illustrations of the effects of the kind of alkaline oxide addition on (a) the double layer thickness and (b) interfacial polarization.
2-4
SiO2-R2O (R=Li, Na, or K)
φ
φ θ
φ
φ
References
2-1 D. Elwell, P. Capper and C.M. Lawrence, J. Crys. Growth 24/25 (1974) 651.
2-2 H.Y. Chang, T.F. Lee and T. Ejima, Trans. ISIJ 27 (1987) 797.
2-3 K.C. Mills, ISIJ Int. 33 (1993) 148.
2-4 L.W. Coughanour, L. Shartsis and H.F. Shermer, J. Am. Ceram. Soc. 41 (1958) 324.
2-5 S. Hara and K. Ogino, Can. Metall. Quart. 20 (1981) 113.
2-6 H. Kania, K. Nowacki and T. Lis, Metalurgija 52 (2013) 204.
2-7 M. Askari and A.M. Cameron, Can. Metall. Quart. 30 (1991) 207.
2-8 P. Vadasz, M. Havlik and V. Danek, Can. Metall. Quart. 39 (2000) 143.
2-9 E.J. Jung and D.J. Min, Steel Res. Int. 83 (2012) 705.
2-10 A. Nagashima, Int. J. Theor. Phys. 11 (1990) 417.
2-11 M. Hayashi, H. Ishii, M. Susa, H. Fukuyama and K. Nagata, Phys. Chem.
Glass. 42 (2001) 6.
2-12 Y. Kang, J. Lee and K. Morita, Metall. Mater. Trans. B 44B (2013) 1321.
2-13 H. Maekawa, T. Maekawa, K. Kawamura, and T. Yokokawa, J. Non-Cryst.
Solids, 127 (1991), 53.
2-14 B.C. Riggs, G.E. Plopper, J.L. Paluh, T.B. Phamduy, D.T. Corr and D.B.
Chrisey, Proc. of SPIE, 8371 (2012) 83711F.
2-15 A.P. Sandoval, J.M. Feliu, R.M. Torresi and M.F.S. Herrera, RSC Adv., 4 (2014) 3383.
2-16 B.O. Mysen, D. Virgo, and F.A. Seifert, American Mineralogist, 70 (1985), 88.
2-17 M.A. Brown, A. Goel, and Z. Abbas, Angew. Chem. Int. Ed., 55 (2016), 3790.
2-18 G.G. Garcia, E.G. Tovar, M.C. Paez, J. Ktos, and S. Lamperski, Phys. Chem.
Chem. Phys., 20 (2018), 262.
2-19 K. Aoki, Review of Polarography, 61 (2015), 33.
2-20 K. Shimoda, Physics Education Society of Japan, 88 (2005), 1634.
2-21 (2001).
2-22 M. Ashizuka and M. Ohtani, J. Japan Inst. Metall. Mater. 33 (1969) 498.
2-23 M. Ashizuka, J. Ceram. Soc. Jpn. 97 (1989) 489.
2-24 F.M. Richter, A.M. Davis, D.J. DePaolo and E.B. Watson, Geochim.
Cosmochim. Ac. 67 (2003) 3905.
2-25 A.P. Chernyshev, and N.F. Uvarov, Mater. Chem. Phys., 182 (2016), 1.
2-26 W. Zhang, J. Ma, P. Wang, Z. Wang, F. Shi, and H. Liu, J. Membrane Sci., 502 (2016), 37.
3 SiO2-RO-R’O (R, R’= Na, K, or Ca)
3-1
(Mixed Alkaline Effect, MAE)3-1 3-3)
( )
3-4) 3-5, 3-6)
Mazurin 3-7)
27 40mol%
-
1 1 ρ
3-8, 3-9)
ξ
29Si MAS-NMR
3-2
3-2-1 29Si MAS-NMR
Table3-1 ρ Table3-1
66.7SiO2-26.64RO-6.66R’O 66.7SiO2-16.65RO-16.65R’O 66.7SiO2-6.66RO-26.64R’O (R, R’=Na, K, or Ca) (mol%)
4R1R’ 1R1R’ 1R4R’
NMR θ
29Si MAS-NMR
Table3-1 ρ SiO2 Na2CO3 K2CO3
CaCO3 (Sigma Aldrich, Japan)
SiO2 Na2O K2O CaO
4Na1K 66.7 26.64 6.66
1Na1K 66.7 16.65 16.65
1Na4K 66.7 6.66 26.64
4Na1Ca 66.7 26.64 6.66
1Na1Ca 66.7 16.65 16.65
1Na4Ca 66.7 6.66 26.64
4K1Ca 66.7 26.64 6.66
1K1Ca 66.7 16.65 16.65
1K4Ca 66.7 6.66 26.64
Table3-1 The initial compositions (mol%) of the melts employed in this study.
Pt 1540K 30min
(1Na4Ca 1K4Ca 1540K 1650K
30min 1540K )
29Si MAS-NMR 0.1wt% Fe2O3
NMR
( ) 29Si
3-10)
3-11)
Fe2O3 0.1wt% NMR
JNM-ECA400( 9.39 T 79.4 MHz)
ZrO2 4.0 mm MAS 15 kHz Single
45 8192 10 s
ξ 29Si TMS(tetramethylsilane, Si(CH3)4)
Qn (n=4, 3, or 2) n SiO44-
ω Qn
3-2-2
3-2-1 29Si
0.1wt%Fe2O3
CaO/(R2O+CaO) = 1.0 (R=Na or K) 66.7SiO2-33.3CaO 1873K
1Na4Ca 2
( 1540K Air 180 min
1.0 V, 50 Hz 150 kHz)
1Na4Ca
( ) ( )
1690K 180min
25K 15min 1440K
1Na4Ca
3-3
3-3-1 29Si MAS-NMR
Fig.3-1 Table3-1 ρ 29Si MAS
NMR ρ
Q3 -80 -100ppm -90 -110ppm
Q4 -70 -80ppm Q2 3-12, 3-13)
29Si MAS NMR Q4 Q3 Q2
ω Qn
Qn (- [ppm]) (fwhm [ppm]) ω
(I [%]) Table3-2 ρ
Fig.3-1 Fitting results of the 29Si MAS-NMR spectra for all samples shown in Table 3-1.
29 -140 -130 -120 -110 -100 -90 -80 -70 -60 -50 -40 -30 -20 -10 0
4Na1K
-140 -130 -120 -110 -100 -90 -80 -70 -60 -50 -40 -30 -20 -10 0
1Na1K
-140 -130 -120 -110 -100 -90 -80 -70 -60 -50 -40 -30 -20 -10 0
1Na4K
-140 -130 -120 -110 -100 -90 -80 -70 -60 -50 -40 -30 -20 -10 0
4Na1Ca
-140 -130 -120 -110 -100 -90 -80 -70 -60 -50 -40 -30 -20 -10 0
1Na1Ca
-140 -130 -120 -110 -100 -90 -80 -70 -60 -50 -40 -30 -20 -10 0
1Na4Ca
-140 -130 -120 -110 -100 -90 -80 -70 -60 -50 -40 -30 -20 -10 0
4K1Ca
-140 -130 -120 -110 -100 -90 -80 -70 -60 -50 -40 -30 -20 -10 0
1K1Ca
-140 -130 -120 -110 -100 -90 -80 -70 -60 -50 -40 -30 -20 -10 0
1K4Ca Q3
Q4
Q2
Q3
Q4
Q2
Q3
Q4
Q2
Q3
Q4
Q2
Q3
Q4
Q2
Q3
Q4
Q2
Q3
Q4
Q2
Q3
Q4
Q2
Q3
Q4
Q2
Experimental Fitting results
Chemical shift, σ / ppm Chemical shift, σ / ppm Chemical shift, σ / ppm
Chemical shift, σ / ppm
Chemical shift, σ / ppm Chemical shift, σ / ppm Chemical shift, σ / ppm Chemical shift, σ / ppm Chemical shift, σ / ppm
Table3-2 Observed chemical shifts (σ [ppm]), full width at half maximum (fwhm [ppm]) and Qn distributions (I [%]) for binary alkali silicate and mixed alkali silicate glasses.
Q4 Q3 Q2
-σ fwhm I -σ fwhm I -σ fwhm I NBO/T
Na2O 99.99 13.83 11.04 88.48 9.58 79.06 77.96 8.75 9.90 0.99 4Na1K 96.59 11.46 9.42 87.84 9.52 80.94 76.94 7.22 9.64 1.00 1Na1K 96.47 13.93 7.82 87.93 10.09 83.19 77.44 6.27 8.99 1.01 1Na4K 96.57 13.89 7.48 87.70 11.33 85.07 76.78 7.21 7.45 1.00 K2O 97.96 17.56 6.90 87.34 12.32 86.07 76.25 8.05 7.03 1.00 4Na1Ca 100.11 12.39 11.34 88.59 10.41 77.41 79.06 9.22 11.25 0.999 1Na1Ca 101.31 12.96 14.24 89.75 11.79 71.57 81.39 10.43 14.19 1.00 1Na4Ca 103.34 13.55 15.03 90.87 14.22 69.87 81.96 10.92 15.11 1.00 4K1Ca 96.02 11.95 9.15 88.31 11.74 81.60 78.82 8.35 9.26 1.00 1K1Ca 101.56 11.62 11.05 91.13 11.90 77.88 83.23 10.42 11.07 1.00 1K4Ca 103.40 10.92 14.65 91.34 13.17 70.66 81.59 10.95 14.69 1.00
Table3-2 66.7SiO2-33.3Na2O(Na2O )
66.7SiO2-33.3K2O(K2O ) ρ Table3-2
NBO/T 1 SiO44-
Y X
ρ
3-14)
! = 8 − 2!
(3−1)! = 4 − !
(3−2)R R = no / nSi
ρ no nSi
Si (3-1) (3-2)
66.7 mol% SiO2 R 2.5 Y=3
X=1 SiO44- 1
NBO/T=1 NBO/T NMR
NBO/T
NBO/T 1 Qn
2 Na2O K2O Q4 Q2
Q3
Na2O K2O CaO Na2O K2O
Q4 Q2 Q3
Z/r (Z r )
SiO44-
ρ 3-15)
2!
!= !
!+ !
! (3−3)3-10) Stebbins
3-16) 29Si MAS-NMR ξ
3-3-2
Fig.3-2 Table3-1 ρ ρ
Fig.3-2
2 EIS Spectrum
analyzer Fig.2-5 ρ
Table3-3
SiO2-R2O(R=Na or K)2 ρ Fig.3-3
Na2O-K2O Na2O-K2O (K2O/(Na2O+K2O))
29Si MAS-NMR Qn
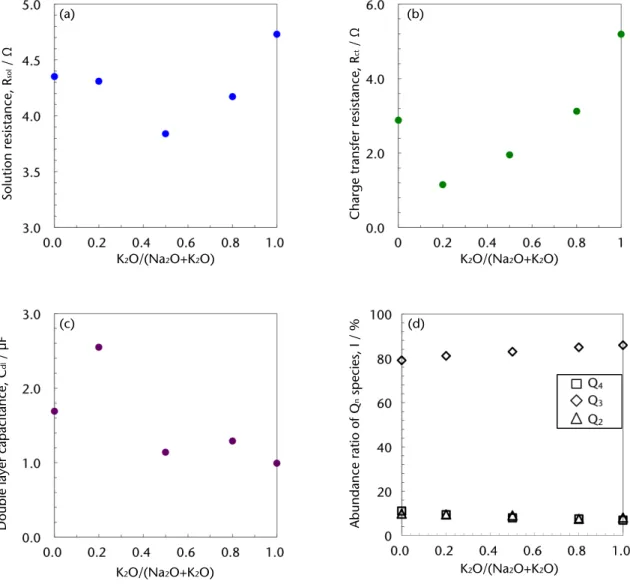
ρ Fig.3-3(a) (c) K2O/(Na2O+K2O)
φ
Fig.3-3(d) Qn
Na2O-K2O Qn
( φ )
3-7, 3-8, 3-17)
3-8)
( )
(pre-exponential
factor) 0 3-18, 3-19)
! = !
!× exp
!!!"
(3 − 4)
E R T
0 φ
ξ
φ
(φ ) 2
3-20) φ
Fig.3-2 The nyquist plots of mixed alkali (alkaline) silicate melts shown in Table 3-1 at 1540K.
1Na4K 4Na1K
1Na1K
4Na1Ca
1Na1Ca
1Na4Ca
4K1Ca
1K1Ca
1K4Ca
Imaginary Impedance, -Z''/ Ω
Real Impedance, Z'/ Ω
Imaginary Impedance, -Z''/ ΩImaginary Impedance, -Z''/ Ω
Real Impedance, Z'/ Ω Real Impedance, Z'/ Ω
Rsol [Ω] Rct [Ω] Cdl [μF] Zw [Ω]
Na2O 4.35 2.88 1.69 16.8
4Na1K 4.31 1.15 2.55 38.3
1Na1K 3.84 1.95 1.14 84.5
1Na4K 4.17 2.13 1.29 35.9
K2O 4.73 5.19 0.993 28.7
4Na1Ca 3.87 4.13 0.806 86.4
1Na1Ca 4.96 4.36 0.622 77.4
1Na4Ca 20.4 49.6 0.0573 187
4K1Ca 4.21 11.8 0.483 169
1K1Ca 6.79 7.31 0.291 91.7
1K4Ca 93.7 293 0.0106 482
Table3-3 The equivalent circuit components of the melts of employed compositions melts.
Fig. 3-3 The relationship between K2O/(Na2O+K2O) ratio and (a) solution resistance, (b) charge transfer resistance, (c) double layer capacitance, and (d) abundance ratio of Qn species at 1540K.
K2O/(Na2O+K2O)
Solution resistance, Rsol / Ω Charge transfer resistance, Rct / Ω
Double layer capacitance, Cdl / μF
K2O/(Na2O+K2O)
(a) (b)
(c)
K2O/(Na2O+K2O) K2O/(Na2O+K2O)
Abundance ratio of Qn species, I / %
K2O/(Na2O+K2O)
(d)
Fig.3-4 Fig.3-5 R2O-CaO CaO/(R2O+CaO)
Qn R=Na R=K
ρ Fig.3-4 Fig.3-5 φ
CaO/(R2O+CaO) CaO/(R2O+CaO)=0.8
CaO/(R2O+CaO) CaO/(R2O+CaO)=0.8
Fig.3-4(d) Fig.3-5(d) R2O-CaO
Qn R2O-CaO
Na2O-K2O 0
CaO/(R2O+CaO) = 0.8 2 1Na4Ca 1K4Ca
φ
2
1540K (1Na4Ca 1620K 1K4Ca
1630K)
1540K NMR
ξ
ρ 1K4Ca
1Na4Ca φ
ρ
Fig. 3-4 The relationship between CaO/(Na2O+CaO) ratio and (a) solution resistance, (b) charge transfer resistance, (c) double layer capacitance and (d) abundance ratio of Qn species at 1540K.
Solution resistance, Rsol / Ω Charge transfer resistance, Rct / Ω
Double layer capacitance, Cdl / μF
(a) (b)
(c)
CaO/(Na2O+CaO)
CaO/(Na2O+CaO) CaO/(Na2O+CaO)
Abundance ratio of Qn species, I / %
(d)
CaO/(Na2O+CaO)
Solution resistance, Rsol / Ω Charge transfer resistance, Rct / Ω
Double layer capacitance, Cdl / μF
(a) (b)
(c)
CaO/(K2O+CaO)
CaO/(K2O+CaO) CaO/(K2O+CaO)
Abundance ratio of Qn species, I / %
(d)
CaO/(K2O+CaO)
Fig. 3-5 The relationship between CaO/(K2O+CaO) ratio and (a) solution resistance, (b) charge transfer resistance, (c) double layer capacitance and (d) abundance ratio of Qn species at 1540K.
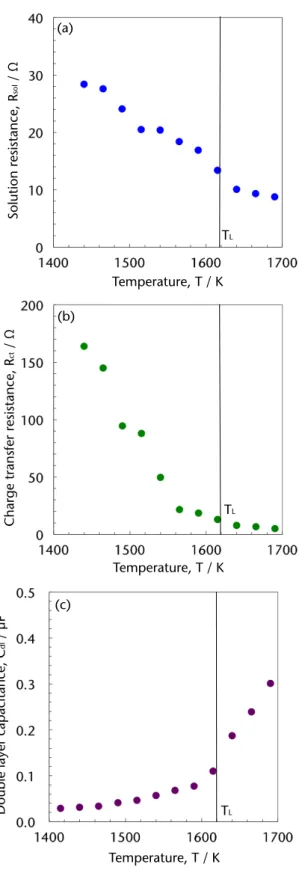
Fig.3-6 1Na4Ca φ
TL ρ Fig.3-6
φ TL
3-21) Greenwood 3-22)
φ
φ
( )
φ φ
Rsol-1
3-23)
!
!"#!!= !
!× exp (
!!!!"
)
(3−5)1Na4Ca log(1/Rsol) 1/T Fig.3-7
TL ρ Fig.3-7
Fig.3-7 -0.796
-0.941
66.2kJ/mol 78.3kJ/mol
18
R’=Li, Na, K, Rb, or Cs) (mol%) φ 600
60 95kJ/mol 3-24)
( )
13 15
18
φ φ
φ
1K4Ca
φ φ
Fig.3-3 Fig.3-4 Fig.3-5
1Na4Ca 1K4Ca
ρ
φ
ρ NMR
Fig. 3-6 The relationship between temperature and (a) solution resistance, (b) charge transfer resistance and (c) double layer capacitance for
Solution resistance, Rsol / ΩCharge transfer resistance, Rct / ΩDouble layer capacitance, Cdl / μF
(a)
(b)
(c)
Temperature, T / K TL
TL
TL
Temperature, T / K
Temperature, T / K
Fig.3-7 The relationship between inverse of solution resistance and temperature, and linear approximations of uniform melt and super-cooling state for 66.7SiO2-6.66Na2O-26.64CaO (1Na4Ca) system.
Temperature, T-1/ 10-4K-1
log (Rsol ) / Ω-1-1
TL
y = -0.796x + 2.54
y = -0.941x + 3.14
Super-cooling Uniform melt
3-4
Na2O-K2O, Na2O-CaO K2O-CaO ( )
ρ
φ
ρ
29Si MAS-NMR NBO/T
ξ Qn
ρ
(pre-exponential factor) 0
φ
ρ
1540K 1Na4Ca 1K4Ca
References
3-1 N. Soga, H. Yamanaka, C. Hisamoto, and M. Kunugi, J. Non-Cryst. Solids, 22 (1976), 67.
3-2 R.A. Lange, and I.S.E. Carmichael, Geochimica et Cosmochimica Acta, 51 (1987), 2931.
3-3 A. Angelopoulou, V. Montouillout, D. Massiot, and G. Kordas, J. Non-Cryst.
Solids, 356 (2010), 187.
3-4 J.P. Poole, J. Am. Ceram. Soc. 32 (1949), 230.
3-5 B. Roling, and M.D. Ingram, J. Non-Cryst. Solids, 265 (2000), 113.
3-6 G.H. Zhang, W.W. Zheng, S. Jiao, and K.C. Chou, ISIJ Int., 57 (2017), 2091.
3-7 O.V. Mazurin, and E.S. Borisovskii, Sov. Phys. – Tech. Phys., 2 (1957), 243.
3-8 D.E. Day, J. Non-Cryst. Solids, 21 (1976), 343.
3-9 A. Bunde, M.D. Ingram, and P. Maass, J. Non-Cryst. Solids, 172-174 (1994), 1222.
3-10 H. Maekawa, T. Maekawa, K. Kawamura, and T. Yokokawa, J. Non-Cryst.
Solids, 127 (1991) 53.
3-11 T. Watanabe, H. Shimizu, A. Masuda, and H. Saito, Chem. Lett., (1983), 1293.
3-12 H. Maekawa, T. Maekawa, K. Kawamura, and T. Yokokawa, J. Phys. Chem., (95) 1991, 6822.
3-13 S. Sukenaga, N. Saito, K. Kawakami, and K. Nakashima, ISIJ Int., 46 (2006), 352.
3-14 Y. Sasaki, and K. Ishii, Tetsu-to-Hagane, 88 (2002), 419.
3-15 M.C. Davis, D.C. Kaseman, S.M.Parvani, K.J. Sanders, P.J. Grandinetti, D.
Massiot, and P. Florian, J. Phys. Chem. A, 114 (2010), 5503.
3-16 J.F. Stebbins, J. Non-Cryst. Solids, 106 (1988), 359.
3-17 J.R. Hendrickson, and P. J. Bray, Phys. Chem. Glasses, 13 (1972), 102.
3-18 J.C. Lapp, and J.E. Shelby, J. Non-Cryst. Solids, 95 &96 (1987), 889.
3-19 S. Mishina, J. Kawamura, and M. Shimoji, Solid State Ionics, 23 (1987), 323.
3-20 M.A. Brown, A. Goel, and Z. Abbas, Angew. Chem. Int. Ed., 55 (2016), 3790.
3-21 T. Ishiguro, and J. Kozatani, Yakugaku Zasshi, 75 (1955), 1346.
3-22 N.N. Greenwood, and R.L. Martin, Proc. Roy. Soc., 215A (1952), 46.
3-23 D. ° R. J.
[3] (2007).
3-24 H. Wakabayasi, R. Terai, and H. Watanabe, , 94 (1986), 677.
4 °
4-1
NMR
°
°
° ° 4-1)
4-2) SiO2-Al2O3-CaO °
(BO/NBO ) NMR
BO/NBO 4-3)
Ca-CaO-CaX2 (X=F, or Cl) °
Ca
°
°
°
°
4-2 4-2-1
Table4-1 ρ
NMR 4-2, 4-4)
SiO2, Al2O3 MgO CaCO3 Sigma Aldrich, Japan
Pt 1873K
1873K 120
10mm
1.0V 50Hz
150kHz
No. SiO2 Al2O3 CaO MgO
1 55.0 15.0 30.0
2 51.0 12.5 36.5
3 36.0 9.9 54.1
4 39.5 9.5 51.0
5 60.1 9.8 30.1
6 51.0 12.5 36.5
7 50.0 10.0 40.0
8 50.0 15.0 35.0
9 50.0 25.0 25.0
10 55.0 6.0 39.0
Table4-1 The initial compositions (mol%) of the melts employed in this study.
4-2-2 °
° Kapoor Frohberg ° 4-5)
2
Gaye Welfringer 4-6)
4-7) °
2
W E
Mi Mj
!
! !! −!− !! + !! !! −!− !! = !! −!− !! (4−1)
W
E SiO2, Al2O3, CaO, MgO, FeO, Fe2O3 MnO
4-2-3
2 3
4 φ
3
φ Rct Cdl 2
SiO2-Al2O3-RO(R=Mg or Ca)3 °
W E
3 2
WSi-Al, WSi-R, WAl-R, ESi-Al, ESi-R, EAl-R 6 6
2 °
Network Former(NWF)
Network Modifier(NWM) 2
NWF NWM
1 ° W E
SiO2-Al2O3-RO 3 NWF -NWM
2 °
GM(ternary) GM(binary) °
P NWF -NWM
2 W
E
!! !"#$%#& = !! !"#$%& (4−2)
! = !!"#!!"#
(!!"#!!"# ∙!!"#!!"#)! ! (4−3) ! = exp !"− !" (4−4)
Ri-j i j
(4-2) GM(ternary) SiO2-Al2O3-RO 3
°
GM(binary) W E 1
(4-4) P W E
(4-2) (4-4) W E
NWF -NWM 2 W E
Appendix
Table4-1 ρ
4-3 4-3-1
Fig.4-1 Fig.4-10 Table4-1 ρ
ρ Table4-2
ρ
Table4-1 51.0SiO2-12.5Al2O3-36.5RO(R= Mg or Ca) θ
2
(Fig.2-12 (b))
φ
Fig.4-1 Nyquist plot for 55.0SiO2-15.0Al2O3-30.0CaO (mol%) melts at 1873K.
Imaginary Impedance, -Z''/ Ω
Real Impedance, Z'/ Ω at 1873K
Fig.4-2 Nyquist plot for 51.0SiO2-12.5Al2O3-36.5CaO (mol%) melts at 1873K.
Imaginary Impedance, -Z''/ Ω
Real Impedance, Z'/ Ω at 1873K
Imaginary Impedance, -Z''/ Ω
Real Impedance, Z'/ Ω at 1873K
Fig.4-3 Nyquist plot for 36.0SiO2-9.9Al2O3-54.1CaO (mol%) melts at 1873K.
Imaginary Impedance, -Z''/ Ω
Real Impedance, Z'/ Ω at 1873K
Fig.4-4 Nyquist plot for 39.5SiO2-9.5Al2O3-51.0CaO (mol%) melts at 1873K.
Imaginary Impedance, -Z''/ Ω
Real Impedance, Z'/ Ω at 1873K
Fig.4-5 Nyquist plot for 60.1SiO2-9.8Al2O3-30.1CaO (mol%) melts at 1873K.
Imaginary Impedance, -Z''/ Ω
Real Impedance, Z'/ Ω at 1873K
Fig.4-6 Nyquist plot for 51.0SiO2-12.5Al2O3-36.5MgO
Imaginary Impedance, -Z''/ Ω
Real Impedance, Z'/ Ω at 1873K
Fig.4-7 Nyquist plot for 50.0SiO2-10.0Al2O3-40.0MgO (mol%) melts at 1873K.
Imaginary Impedance, -Z''/ Ω
Real Impedance, Z'/ Ω at 1873K
Fig.4-8 Nyquist plot for 50.0SiO2-15.0Al2O3-35.0MgO (mol%) melts at 1873K.
Imaginary Impedance, -Z''/ Ω
Real Impedance, Z'/ Ω at 1873K
Fig.4-9 Nyquist plot for 50.0SiO2-25.0Al2O3-25.0MgO (mol%) melts at 1873K.
Imaginary Impedance, -Z''/ Ω
Real Impedance, Z'/ Ω at 1873K
Fig.4-10 Nyquist plot for 55.0SiO2-6.0Al2O3-39.0MgO
SiO2-Al2O3-RO Table4-2 CaO
(No. 2) MgO (No. 6)
Al2O3 Al2O3
Al2O3 RO
Al2O3 Network Former AlO4
4-8) AlO4 Al3+
1 +3/4 SiO4 Si4+ 1
+4/4
AlO4 +1/4 4-9)
Cationic Field Strength(CFS)4-10)
4-11) CFS -1 NBO
CFS Mg2+
No. Rsol [Ω] Rct [Ω] Cdl [μF] Zw [Ω]
1 10.5 198 0.0991 1052
2 7.07 60.7 0.177 352
3 5.97 2.28 0.834 69.4
4 5.54 11.1 0.376 136
5 46.2 158 0.0195 1152
6 7.89 4.90 0.209 129
7 6.77 8.76 0.236 250
8 9.27 1.97 0.457 47.0
9 10.9 1.60 0.753 50.0
10 10.3 17.8 0.112 389
Table4-2 The equivalent circuit components of the melts containing Al2O3.
Ca2+ CFS 3.86 2.00
!"# =
!!! (4−5)
Z r Mg2+ Ca2+
Ca2+ CFS Ca2+
NWM
4-12)
NWM -1 NBO
-0.25 AlO4
φ
Mg2+ Ca2+
Ca2+ Mg2+
CaO φ
ρ
4-3-2
°
W E
Fig.4-11
R2( ) ρ 4-13) 2
2
-1 1 2
= 1( ) 2 = -1( )
!
= 1− 6!(!2 −1) (!! −!!)2
!
!=1
(4−6)
n ° Xi Yi 2
2 R2
( )
0 R2 1 1
!
! = { !!=1(!! −!)(!! −!)}2 (!! −!)2 ⋅!!=1 !!=1(!! −!)2 (4−7)
n ° xi yi ! ! ° xi yi
Fig.4-11 0.8
ρ
φ CaO MgO
1.0
Fig.4-11(b) R2 0.9
φ
2 2
(Non Bridging
Oxygen: NBO) φ (Fig.2-7)
NWF NWM 2
NWM
NBO
NBO φ NBO
Fig.4-11 Relationship between energy of cells formation and (a) solution resistance, (b) charge transfer resistance and (c) double layer capacitance at 1873K.
Solution resistance, Rsol / Ω
Charge transfer resistance, Rct / Ω
Double layer capacitance, Cdl / μF
Cells formation energy, W / cal
(a)
(b)
(c)
Cells formation energy, W / calCells formation energy, W / cal
Fig.4-12
R2 ρ Fig.4-12
0.9
ρ Fig.4-12(b) (c) φ
0.9 1.0
Gaye
4-14)
Fig.4-12(c)
Fig.4-11(b) Fig.4-12(c) SiO2-Al2O3-CaO SiO2-Al2O3-MgO
φ
Fig.4-12 Relationship between energy of cells interaction and (a) solution resistance, (b) charge transfer resistance and (c) double layer capacitance at 1873K.
Solution resistance, Rsol / Ω
Charge transfer resistance, Rct / Ω
Double layer capacitance, Cdl / μF
(a)
(b)
(c)
Cells interaction energy, E / calCells interaction energy, E / calCells interaction energy, E / cal
4-3-3
φ Rct φ
Cs 4-15)
!
!"= ! ∙
!!! (4−8)
(4-8) φ
aRO4-16) φ
φ ρ
!
!"!= !
!"∙ !
!" (4−9)Fig.4-13 φ
ρ Fig.4-13 ρ SiO2-Al2O3-CaO SiO2-Al2O3-MgO
(
) φ φ
4-3-1
CFS φ
CFS
(Mg Ca) CFS
!
!"!= !
!"∙
!"# (!)!"# (!"#.) (4−10)
Cells formation energy, W / cal
Modified charge transfer resistance, R'ct
Fig.4-13 Relationship between energy of cells formation and modified charge transfer resistance at 1873K.
CFS(R) CFS CFS(ave.) Mg Ca CFS
2.93 Fig.4-14
ρ Fig.4-14 SiO2-Al2O3-CaO SiO2-Al2O3-MgO
Fig.4-13 Fig.4-14
°
Table2-1 Table3-1 Table4-1 ρ Fig.4-13 Fig.4-14
Table2-1
Table3-1 °
Fig.4-15
Cells interaction energy, E / cal
Modified double layer capacitance, C'dl
Fig.4-14 Relationship between energy of cells interaction and modified double layer capacitance at 1873K.
ρ NMR
NBO/T ρ Fig.4-15
Fig.4-15
ρ Table2-1 Table4-1 ρ
Table3-1 3 NMR
Fig.4-15
Fig.4-15 Relationship between NBO/T by cell model calculation and NBO/T by 29Si MAS-NMR.
° [%]
4-17) °
∆ =
!!
∙
!!!!|!
!|
(4−11)!
!=
(!"#/!)!"# –(!"#/!)!"#(!"#/!)!"# × 100 (4−12)
N (NBO/T)est (NBO/T)mea NBO/T
Fig.4-15 °
42.2% °
SiO2-Al2O3-CaO SiO2-Al2O3-MgO SiO2-CaO-MgO NMR
4-2, 4-4, 4-18) ρ Fig.4-16 ρ Fig.4-16
ρ NMR
NBO/T Fig.4-15 ρ
Fig.4-16
° 131
89%
40%
ρ
°
Fig.4-16 Relationship between NBO/T by cell model calculation and NBO/T by 29Si MAS NMR.
4-4
°
ρ φ
φ
φ
°
References
4-1 C.H.P. Lupis, H. Gaye, and G. Bernard, Scripta Metallurgica, 4 (1970), 497.
4-2 T. Matsumiya, K. Shimoda, K. Saito, K. Kanehashi, and W. Yamada, ISIJ Int., 47 (2007), 802.
4-3 J. Yamazaki, T. Ito, H. Shoji, and F. Tsukihashi, J. Japan Inst. Metals, 63 (1999), 702
4-4 C.I. Merzbacher, B.L. Sherriff, J.S. Hartman, and W.B. White, J. Non-Cryst.
Solids, 124 (1990), 194.
4-5 M.L. Kapoor and M.G. Frohberg, Chemical Metallurgy of Iron and Steel, The Iron and Steel Institute, London, (1973), 17.
4-6 H. Gaye and J. Welfringer, Proc. 2nd Int. Symp. On Metallurgical Slags and Fluxes, ed. by H.A. Fine and D.R. Gaskel, TMS-AIME, Warrendale, PA, (1984), 357.
4-7 H. Gaye, J. Lehmann, T. Matsumiya, and W. Yamada, 4th International Conference on Molten Slags and Fluxes, Sendai, (1992), 103.
4-8 H. Doweidar, Phys. Chem. Glasses, 42 (2001), 42.
4-9 Y. Sasaki, and K. Ishii, Tetsu-to-Hagane, 88 (2002), 419.
4-10 F.Shimizu, H. Tokunaga, N. Saito, and K. Nakashima, ISIJ Int., 46 (2006), 388.
4-11 K. Kanehashi, Solid State Nuclear Magnetic Resonance, 84 (2017), 158.
4-12 S. Amma, M.T. Lanagan, S.H. Kim, and C.G. Pantano, J. Am. Ceram. Soc., 99 (2016), 1239.
4-13 S.H. Downs, and N. Black, J. Epidemiol. Community Health, 52 (1998), 377.
4-14 K. Aoki, Review of Polarography, 61 (2015), 33.
4-15 W. Zhang, J. Ma, P. Wang, Z. Wang, F. Shi, and H. Liu, J. Membrane Sci., 502 (2016), 37.
4-16 C.W. Bale, E. Belisle, P. Chartrand, S.A. Decterov, G. Eriksson, A.E. Gheribi, K.
Hack, I.-H. Jung, Y.-B. Kang, J. Melancon, A.D. Pelton, S. Petersen, C.
Robelin, J. Sangster, P. Spencer, and M.-A. Van Ende, CALPHAD: Computer Coupling of Phase Diagrams and Thermochemistry, 54 (2016), 35.
4-17 飯田孝道,喜多善史,上田満,森克己,中島邦彦,溶融スラグ・ガラ
スの粘性,アグネ技術センター,東京,(2003).
4-18 J.H. Park, J. Non-Cryst. Solids, 358 (2012), 3096.
Appendix (A)
° i j
!
! !−!− ! + !! ! −!− ! = !−!− ! (! −1)
m yi (Rii)1/2
(A-2) (A-3) 2 Rij
!!
∙
!!"!
!=1
∙!! = !!!! (!=1,2,…,!) !−2
!!" = !!" ∙!! ∙ !! (!,! = 1,2,…,!) !−3
vi (Mi)uiOvi SiO2
vi =2 Na2O CaO vi =1 Xi
!!" =exp !! +!! −!!"
!" ! ≠! !−4
!! = ( !!!!
!!
!
!!!
∙!!"
!" ) ! −5
!! = 𝑣!!!
!
!!!
!−6
Wij ( i - O - j ) Eij ( i - O - j ) ( i
- O - i )
(A-2) m yi (A-3)
Rij
(A-2) z = T/
!! ∙ (!!")!
!
!!!
∙!! = !!!! (! = 1,2,…,!) !−7
(A-7) 1 2
! ∙ !! = (!!) ! −8
! ∙ !!! = (!!!) !−9
!!" = !!" ! ∙!! (! ≠!) !−10
!!" = !! + !!" !∙!!
!
!!!
(! =!) !−11
!!! = − !! ∙ [ !!" !∙ln !!" ∙!!]
!
!!!
!−12
!!!! = − !!" ![2!!!!!! +2(!!!!𝑗+!!!!!)∙ln !!" +!!!!{(ln !!" )!
!
!!!
+1
!ln !!" }] !−13
(!) =
𝑎!! !!" … !!!
!!" ⋱ ⋮
⋮ ⋱ ⋮
!!! … … !!"
! −14
!! =
!!
!!
⋮
!!
!! =
!!!
!!!
⋮
!!!
!!! =
!!!!
!!!!
⋮
!!!!
!−15
(A-8) (A-9) (A) (A)-1 (B’) (B’’)
(y’) (y’’)
(y’) (y’’) z=0 ( ) z=1 ( =T)