Annual Report of Hydrogen Isotope Research Center, Organization for Promotion of Research,
University of Toyama, JAPAN VOL 36 2016
富山大学研究推進機構水素同位体科学研究センタ
ー研 究 報 告
第36巻
2016
富山大学研究推進機構水素同位体科学研究センタ ー
HYDROGEN ISOTOPE RESEARCH CENTER,
ORGANIZATION FOR PROMOTION OF RESEARCH, UNIVERSITY OF TOY AMA
織鵬
不均一系光触媒反応における光生成電荷の 分離機構
● 文
光電子増倍管の印加電圧を制御する改良積分法の 液体シンチレーション計測への応用
Pd
—
Ag-Rh三元系合金における磁化率と水素吸収 量の相関多角バレルスパッタリング法を用いて調製した Ru-Ni/Ti切触媒のCO2メタン化反応特性ヽ
ノート
a·AbOs担持Ptナノ粒子触媒の
co
酸化活性と着火現象
.................. 萩原 英久
. . . ・ ・ ・
...
·-...
. . ・ ・ ・ ・ 彎 ● ● . . . ・ ・ ・ ・ ・ ・
原 正憲 坂口 春菜 中山 将人 阿蘇 司 庄司 美樹 古澤 孝良 加藤 結花 吉村 共之
赤丸 悟士 原 正憲
井上 光浩 島 明日香 宮崎かほり 専光寺 旭洋 オマーJv }ンドーサ 魯 保旺 曽根 理嗣 阿部 孝之
田 口 明
ー
... 21
... 31
... 39
... ... 45 尾崎 智弘
Review
H.HAGIWARA
Separation Mechanism for Photogenerated Charge Carriers
in Heterogeneous Photocatalysts · · · · 1
O由土叫
M. HARA, H. SAKAGUCHI, M. NAKAYAMA, T. ASO, M. SHOJI, T. FURUSAWA, Y. KATO, T. YOSHIMURA
Modified integral counting method by controlling high voltage of photomultipliers
for liquid scintillation counting ··· 21
S. AKAMARU, M. HARA
Relation between the magnetic susceptibility and the amount of absorbed hydrogen for
the Pd—Ag—Rh ternary alloy · · · · 31
M. INOUE, A. SHIMA, K. MIYAZAKI, T. SENKOJI, 0. MENDPZA, B. LU, Y. SONE, T. ABE
CむMethanation Performance of a Ru—Ni/Ti02 Catalyst Prepared by the Polygonal
Barrel-Sputtering Method · · · · 39
Not.e
A. TAGUCHI, T. OZAKI
Ignition-extinction phenomena in CO oxidation reaction over "dry''impregnated
platinum nanoparticles on a-Al心3 • . • • • . • . . • • . • • • . • • • • • • . • • • . • • • • • • •• • • . • • • • • • . • • • • • • • • • • • • • • • • • • • • • • • • • • . • • • • • • 45
総 説
不均一系光触媒反応における光生成電荷の分離機構
萩原 英久
富山大学 研究推進機構 水素同位体科学研究センター
〒930-8555 富山市五福
3190
Separation Mechanism for Photogenerated Charge Carriers in Heterogeneous Photocatalysts
Hidehisa Hagiwara
Hydrogen Isotope Research Center, Organization for Promotion of Research, University of Toyama, Gofuku 3190, Toyama, 930-8555, Japan
(Received June 30, 2017; accepted July 31, 2017) Abstract
In heterogeneous photocatalysts, it is very important to move photoexcited charges in the semiconductor to the reaction site on the surface without recombination. In this review, we describe the process of the photocatalytic reaction from photoexcitation of semiconductor photocatalyst to surface redox reaction, and summarized various researches on the charge separation of photogenerated electrons and holes in semiconductors reported up to the present.
1. Introduction
Heterogeneous photocatalysts have been widely used for various applications such as
antibacterial coating,
1,2deodorizing,
3antifogging treatment,
4,5and water purification,
6,7and
become more important in the future. Furthermore, a photocatalytic solar energy conversion,
so-called artificial photosynthesis, has actively studied to solve global energy problems.
8,9To improve the activity and the functionality of photocatalysts, it is necessary to understand a series of photocatalytic processes in detail. Figure 1 shows elementary reactions of TiO
2photocatalyst with corresponding timescales. Under light irradiation with a higher energy than the bandgap energy of the semiconductor photocatalyst, electrons in the valence band (VB) make transition to the conduction band (CB) with leaving holes in the valence band. While the photogenerated electrons transfer to the bottom of the CB, the holes transfer to the top of the VB, via vibrational relaxation process. These charge generation and relaxation processes occur in the order of
Fig. 1 Elementary reactions in TiO2 photocatalysis with corresponding timescales.
femtoseconds. The photogenerated electrons and holes diffuse in the CB and the VB, respectively, and part of them are trapped at the energy level formed by atomic vacancy, impurity, or functional groups on the photocatalyst surface. In the charge recombination process, the photogenerated charge carriers annihilate each other releasing the energy as a photon or phonons. These trapping and recombination processes take place in the order of nanoseconds or microseconds. On the other hand, the photogenerated electrons and holes without recombination react with adsorbed chemical species, or transfer to metal or metal oxides on the photocatalyst surface. The redox reactions on the photocatalyst surface occur in the order of the microseconds or milliseconds, thus it is considered that the photocatalytic activity is improved by suppressing the charge recombination at trap site or photocatalyst surface. Therefore, this review covered up the several approaches of the photogenerated carrier separation in heterogeneous photocatalysts, for development of the highly active photocatalysts.
2. Charge separation in semiconductor photocatalysts
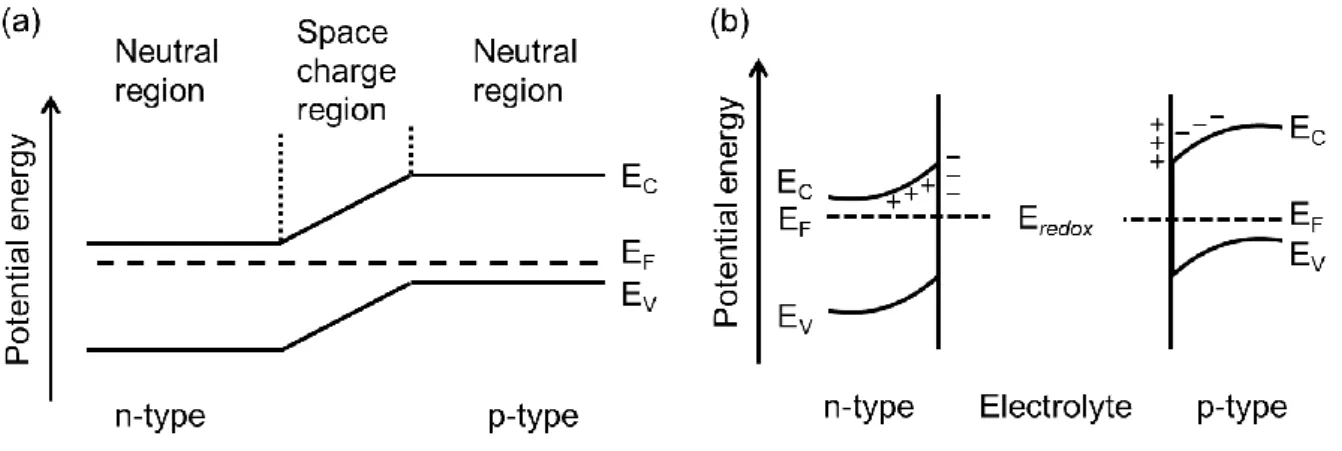
Photogenerated electrons and holes in optical semiconductors diffuse in conduction and valence bands along electric fields. In silicon type solar cells, the charge separation takes place at the interface between p-type semiconductors (e.g. boron-doped silicon) and n-type
Fig. 2 Energy band diagrams of (a) p-n junction and (b) semiconductor-electrolyte interface.
semiconductors (e.g. phosphorus-doped silicon), so-called p-n junction, because of a potential gradient in a space charge region (Fig. 2a). The formation of space charge region in semiconductor photoelectrodes of photoelectrochemical cells are explained by a band-bending model, which is based on an interdiffusion of electrons and holes between semiconductors and redox species in electrolyte (Fig. 2b). In the case of semiconductor photocatalyst powders, the space charge region forms in a similar manner to that of the photoelectrodes. The length of the space charge region depends on the carrier density of the semiconductor photocatalysts, and it is estimated within 20-100 nm.
4,10Therefore, the reduced effect of the band bending is one of the reasons for increasing charge recombination in photocatalyst particles with size within 100 nm. Although the space charge properties are determined by surface/interface electronic states, the photogenerated charges can also be controlled by electric fields induced dielectric structures or difference in the surface electronic band structures of crystal facets, as described below.
2.1. Ferroelectric materials
Barium titanate (BaTiO
3), which is one of the most popular ferroelectric materials, has been investigated to reveal the charge separation effect of internal electric fields.
11-17BaTiO
3shows the spontaneous polarization between 278 K and 393 K, because Ti and Ba atoms shifted to
<100> direction and O atoms shifted negatively from cubic perovskite structure, as shown in Fig.3.
18To confirm the effect of the spontaneous polarization on the charge separation and the photocatalytic reactivity, Ag
+, Pb
2+, and Mn
2+ions were employed as reaction marker.
These ions were deposited on the photocatalyst surface as Ag, PbO
2, and MnO
2by photocatalytic reduction or
oxidation reactions, and the migration behavior of
Fig. 3 Crystal structure of BaTiO3.photogenerated carriers in semiconductor crystals was determined by surface observation.
Figure 4 shows SEM images of BaTiO
3crystals prepared after the photoirradiation in AgNO
3aqueous solution.
17In this study, BaTiO
3crystals were prepared by KCl flux method, and the deposition of Ag particles was observed on (001) plane of BaTiO
3crystals. This result suggests that Ag is reduced by photogenerated electrons migrated along the direction of ferroelectric polarization. In addition to the research on BaTiO
3, various ferroelectric materials, such as Pb(Zr, Ti)O
3,
19-26BiFeO
3,
27LiNbO
3,
28and Sr
2Nb
2O
7,
17have been reported as active photocatalysts for water splitting, hydrogen production, and water purification.
The photocatalytic properties of pyroelectric materials have been also studied for understanding the efficient charge separation. Huang et al. reported that bismuth-based compounds, BiOIO
3,
29Bi
2O
2[BO
2(OH)],
30and Bi
4V
2O
1131showed high photocatalytic activity for organic compound oxidation or oxygen formation from AgNO
3aqueous solution. As shown in Fig. 5, BiOIO
3is composed of central Bi
2O
4layer shares O corners with IO
3units, thus the direction of the pyroelectric polarization is along c-axis. The DFT calculations of BiOIO
3revealed that Bi 6p and I 5p contributes to the CB while O 2p strongly contributes to the VB.
Therefore, the photoexcited electrons in the CV migrate to Bi
2O
4layer along c-axis, and the
Fig. 4 SEM images of faceted BaTiO3 crystals after reaction in AgNO3 aqueous solution Reproduced with permission from Ref. 17, copyright Springer Science+Business Media, LLC 2008.
photogenerated holes located at the O 2p. This charge separation process is important for the photocatalytic property of bismuth-based photocatalysts. Related study of the pyroelectric polarization effect on the photogenerated charge separation in bismuth-based oxyhalides, such as carbon-doped Bi
3O
4Cl,
32Bi
12O
17Cl
2,
33and BiO
X(X=Cl, Br, I),
34-36have been also reported from different research groups. Furthermore, Huang et al., also reported silver silicates, Ag
6Si
2O
7,
37Ag
9(SiO
4)
2NO
3,
38Ag
10Si
4O
13,
39,40as the pyroelectric photocatalysts. As described above, the internal polar electric fields in semiconductor photocatalyst enhance the charge separation of the photogenerated carriers and improve the photocatalytic activity.
2.2. Crystal facets
The surface electronic band structures depend on surface facets because of the surface atomic arrangements and adsorption species. Redox abilities of photogenerated charge carriers tuned by the surface electronic band structures of different facets, and accumulations of photogenerated electrons or holes on different facets.
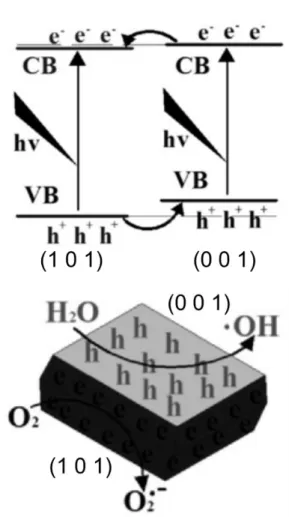
41Ye et al. reported the photoinduced
Fig. 5 A perspective view of the BiOIO3 slab. Reproduced with permission from Ref. 29, copyright (2013) Wiley-VCH Verlag GmbH & Co. KGaA, Weinheim.
charge transfer properties of anatase TiO
2crystal between (101) facets and (001) facets.
42They prepared TiO
2crystals by using a hydrothermal synthesis method with ammonium hexafluorotitanate ((NH
4)
2TiF
6), tetrabutyl titanate, and hydrochloric acid (HCl), and controlled the ratio of different facets by changing the hydrothermal temperature and the volume ratio of HCl and water. As shown in Fig.
6, the photogenerated electrons and holes efficiently separated to (101) facet and (001) facet, and thus reduction and oxidation reactions took place on each facet. The spatial charge separation between different facets of TiO
2crystal, containing other crystal structure, brookite
43and rutile,
44has been reported by several research groups.
45-51To date, the effect
of spatial charge separation between different facets on the photocatalytic reactivity have been studied by using various photocatalytic semiconductors, such as metal oxides (CeO
252and Cu
2O
53-55), complex oxides (BiVO
4,
41,56-58SrTiO
3,
59,60La
2Ti
2O
7,
61and BaLa
4Ti
4O
1562,63), metal oxyhalides,
64-66and metal sulfides.
67,683. Charge trapping
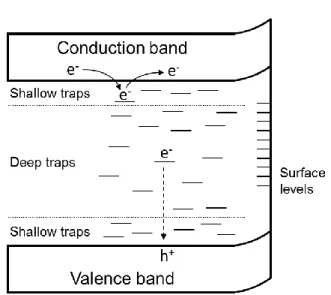
Diffusion and trapping of the photogenerated carriers after the charge separation is also important factor for the activity of photocatalyst materials. In addition to the conduction and
Fig. 6 Electronic band structures and charge distribution of (101)-(001) facets. Reproduced with permission from Ref. 42, copyright (2013) Elsevier.
valence band levels, there are several energy levels in semiconductors, as shown in Fig. 7. The depth of the charge trap levels depends on how the defects stabilize the trapped charges through polaron formation.
69-71To understand the relationship between the trap sites and the photocatalytic activity, time- resolved photoabsorption spectroscopy is generally employed for the lifetime
measurement of the photogenerated electrons and holes.
72-75Yamakata et al. reported that the photocatalytic activity of SrTiO
3was improved by SrCl
2flux treatment because of the prolongation of photogenerated charge lifetime with decreasing the number of deep trap sites.
76They also investigated the relationship between the surface defects and the photocatalytic activity by using single- and poly- crystals of SrTiO
3.
77Although the free and shallow trapped electrons were dominant in single crystal SrTiO
3, they recombined within 50 ns. On the other hand, defect-rich polycrystalline SrTiO
3showed the long-time charge separation longer than 1 ms and the higher photocatalytic activity for hydrogen production from methanol aqueous solution. This positive effect of surface defects on the photocatalytic activity have been reported by using other semiconductor materials. Hoch et al. reported that the activity of photocatalytic CO
2reduction on In
2O
3-x(OH)
ystrongly enhanced by introducing surface defects as oxygen vacancies and hydroxyl groups.
78Furthermore, the positive effect of surface vacancy has been reported on the photodecomposition activity of BiOCl for organic compounds.
79Whereas the deep trap sites in semiconductors work as recombination center of photogenerated charges, the surface defects prolonged charge separation lifetime and enhanced the photocatalytic activity.
Fig. 7 Schematic image of electronic band structure of a semiconductor with various energy levels.
These results are important for the design of highly active photocatalysts.
4. Interfacial charge transfer
In multi-component photocatalysts, junctions are formed through the combination of a semiconductor with other materials to enhance charge separation. In this section, the topics of semiconductor-semiconductor, semiconductor-metal complex, and semiconductor-metal (or metal oxide) co-catalyst photocatalysts are introduced.
4.1. Semiconductor-semiconductor heterojunction
Until now, various photocatalysts with semiconductor junction have been developed, and mainly used TiO
2-based composites (e.g. Fe
2O
3,
80-85Cu
2O,
86-89ZnO,
90,91WO
3,
92,93Ag
3PO
4,
94,95In
2O
3,
96-99CeO
2.
100-102Furthermore, semiconductor composites with different crystal phase were investigated, especially anatase-rutile TiO
2composites.
103-105Wang et al. reported the composite effect of -Ga
2O
3and -Ga
2O
3on the photocatalytic water splitting activity.
106The
Fig. 8 (a) HR-TEM image of Ga2O3 calcined at 863 K. (b)Illustration of charge transfer cross the a–b phase junction. Reproduced with permission from Ref. 106, copyright (2012) Wiley-VCH Verlag GmbH & Co. KGaA, Weinheim.
composite of -Ga
2O
3and -Ga
2O
3was prepared by adjusting calcination temperature, and effective charge separation was achieved at well-developed phase junction (Fig. 8). A similar effect was observed in the composite of α-Bi
2O
3and β-Bi
2O
3.
107In this system, the photogenerated electrons moved to the CB of β-Bi
2O
3and holes moved to the VB of α-Bi
2O
3. The photocatalytic activity for organic dye decomposition was improved by the formation of heterojunction. In recent years, composite photocatalysts of inorganic semiconductors and metal sulfides,
108-113metal halides
114-116and organic semiconductors
117,118have also been reported in addition to metal oxides. The formation of heterojunction at semiconductor interface is one of the effective way to separate photogenerated charges in photocatalysts.
4.2. Semiconductor-metal complex heterojunction The effects of surface modification with metal complexes for semiconductor materials were investigated in the research area of photoelectrochemical cells, and dye- sensitized solar cells are one of the typical research. In the dye-sensitized system, photo- excited electrons in dyes inject to the CB of metal oxide semiconductors along the potential gradient formed by band-bending, and the photogenerated charges are
effectively separated spatially between metal oxides and dye molecules (Fig. 9). Most of dye- sensitized photocatalyst systems have been fabricated using TiO
2and metal complexes, such as ruthenium complexes
119-121and porphyrins.
122-125Hirano et al. studied the ligand effects of Ru- complexes on the photocatalytic activity of dye-sensitized Pt/TiO
2for hydrogen production
Fig. 9 Schematic image of charge transfer mechanism of dye-sensitized photocatalysts.
from EDTA aqueous solution.
120They used Ru(bpy)
32+, Ru (dcbpy)
34-, and Ru(bpym)
32+as sensitization dye, and Ru(bpym)
32+-Pt/TiO
2showed the highest photocatalytic activity.
Ru(bpym)
32+contains more nitrogen in the molecular structure, which showed higher affinity with the TiO
2surface than other Ru-complexes, resulted in enhanced electron transfer to TiO
2. The same tendency was reported in various Ru-complexes,
126-128thus the strong affinity between metal oxides and dyes are important for the charge separation and the photocatalytic activity of the dye-sensitized photocatalysts.
On the other hand, the electron injection from the CB of semiconductor to metal complex molecules also reported for the dye-semiconductor composite photocatalysts. We developed chromium tetraphenylporphyrin chloride/Zr-doped KTaO
3(Cr-TPPCl/KTa(Zr)O
3) composite photocatalysts for water splitting reaction.
129-131In this system, the water splitting takes place with two-step excitation process in both semiconductors and dyes, as shown in Fig. 10. This charge transfer mechanism is similar to that of light-dependent reaction of photosynthesis, so- called Z-scheme. The half-life of the charge separation lifetime of KTa(Zr)O
3was prolonged
Fig. 10 Schematic image of charge transfer mechanism of Cr-TPPCl /KTa(Zr)O3 composite photocatalyst.
from 11.5 s to 100 s by Cr-TPPCl modification, and thus the photocatalytic activity was improved.
129Sekizawa et al. also reported Ag/TaON-Ru binuclear complex as Z-scheme type photocatalyst for photocatalytic CO
2fixation.
132Although the Z-scheme photocatalysts need two photons for the photocatalytic reaction, efficient charge separation can be achieved.
4.3. Semiconductor-metal (metal oxide) co-catalysts
The co-catalysts act as acceptors of the photogenerated carriers for separating the electrons and the holes from the CB and the VB of the semiconductor, and as more efficient active sites for the photocatalytic reaction. The most commonly used metals for co-catalysts are platinum (Pt), rhodium (Rh), or palladium (Pd) nanoparticles due to their noble and catalytic properties.
133–135Besides noble metal nanoparticle, metal oxide (NiO, RuO
2), metal sulfides,
Fig. 11 Decay of transient absorption of CoOx-loaded LaTiO2N photocatalysts in a vacuum. The transient absorption was measured at 2000 cm−1. The sample was excited by 355 nm UV laser pulses (6 ns duration, 0.5 mJ cm−2, 1 Hz). The inset shows the decay in the second region (pump pulse repetition rate at 0.01 Hz). Reproduced with permission from Ref. 143, copyright (2014) American Chemical Society.
and CoPi have been investigated as co-catalysts.
136-142Yamakata et al. investigated the loading effect of Pt and CoO
Xco-catalysts on LaTiO
2N by using time-resolved absorption spectroscopy.
143In the case of LaTiO
2N, photogenerated holes in the VB of LaTiO
2were captured rapidly by CoO
Xin a few picoseconds, and the lifetime of electrons were prolonged to the second region (Fig. 11). Loading co-catalysts enhance the charge separation of semiconductor photocatalysts and decrease the activation energy of surface reaction. Therefore, co-catalysts are important especially for hydrogen, oxygen, or carbon monoxide formation in water splitting or CO
2fixation as artificial photosynthesis.
5. Summary
In this paper, various researches of the charge separation in heterogeneous photocatalysts have been reviewed. In order to develop a highly active photocatalyst, it is necessary to efficiently separate photogenerated charges and suppress the annihilation due to the charge recombination. The charge separation is promoted along the electric field in the crystal for dielectrics and pyroelectric materials with polarized electric fields inside the crystal. To suppress the charge recombination, it is also effective to expose a well-developed crystal facets.
Since the electronic states of the semiconductor surface varies depending on the atomic
arrangements and the adsorption properties of the crystal planes, the photogenerated charges
are separated between different crystal facets. Furthermore, the formation of heterojunction is
an effective method for promoting charge separation. Although charge recombination at the
interface should be carefully avoided, the junction of semiconductor-semiconductor or metal
complex contributes to improved charge separation efficiency. Co-catalyst loading is a powerful
technique for improving photocatalytic activity. Co-catalysts are widely used especially in
artificial photosynthesis type photocatalysts, because it works as a catalyst for surface chemical
reaction as well as an acceptor for photogenerated electrons and holes.
Heterogeneous photocatalysts have been widely used for various applications and become more important in the future. Especially in the research field of light energy conversion, highly active photocatalysts are intensively studied for solar energy conversion and storage. To solve the global energy issue, it is expected that a new highly efficient photocatalyst will be developed by combining the charge separation technics introduced in this review.
References
(1) K. Page, R. G. Palgrave, I. P. Parkin, M. Wilson, S. L. P. Savin, and A. V. Chadwick, J.
Mater. Chem., 17 (2007) 95.
(2) H. A. Foster, I. B. Ditta, S. Varghese, A. Steele, and G. Bellanger, Appl. Microbiol.
Biotechnol., 90 (2011) 1847.
(3) H. Zhang, C. Ge, C. Zhu, Y. Li, W. Tian1, D. Cheng, and Z. Pan, Phys. Proc., 25 (2012) 240.
(4) A. Fujishima, T. N. Rao, D. A. Tryk, J. Photochem. Photobio. C 1 (2000) 1.
(5) T. Kamegawa, Y. Shimizu, and H. Yamashita, Adv. Mater. 24 (2012) 3697.
(6) A. Fernández, G. Lassaletta, V. M. Jiménez, A. Justo, A. R. González-Elipe, J.-M. Herrmann, H. Tahiri, and Y. Ait-Ichou, Appl. Catal. B, 7 (1995) 49.
(7) M. N. Chong, B. Jin, C. W. K. Chow, and C. Saint, Water Res. 44 (2010) 2997.
(8) I. McConnell, G. Li, G. W. Brudvig, Chem. Biol., 17 (2010) 434.
(9) Y. Tachibana, L. Vayssieres, and J. R. Durrant, Nat. Photonics, 6 (2012) 511.
(10) Z. Zhang and J. T. Yates, Chem. Rev., 112 (2012) 5520.
(11) A. M. Glass, D. von der Linde and T. J. Negran, Appl. Phys. Lett., 25 (1974) 233.
(12) O. Ambacher, J. Smart, J. R. Shealy, N. G. Weimann, K. Chu, M. Murphy, W. J. Schaff, L.
F. Eastman, R. Dimitrov, L. Wittmer, M. Stutzmann, W. Rieger and J. Hilsenbeck, J. Appl.
Phys., 85 (1999) 3222.
(13) N. V. Burbure, P. A. Salvador and G. S. Rohrer, J. Am. Ceram. Soc., 89 (2006) 2943.
(14) J. L. Giocondi and G. S. Rohrer, J. Phys. Chem. B, 105 (2001) 8275.
(15) J. L. Giocondi and G. S. Rohrer, Chem. Mater., 13 (2001) 241.
(16) A. Bhardwaj, N. V. Burbure, A. Gamalski and G. S. Rohrer, Chem. Mater., 22 (2010) 3527.
(17) J. L. Giocondi and G. S. Rohrer, Top. Catal., 49 (2008) 18.
(18) K. M. Rabe, C. H. Ahn and J.-M. Triscone, Physics of Ferroelectrics: A Modern Perspective, Springer, 2007.
(19) Y. Inoue, K. Sato, K. Sato and H. Miyama, J. Phys. Chem., 90 (1986) 2809.
(20) P. M. Jones, D. E. Gallardo and S. Dunn, Chem. Mater., 20 (2008) 5901.
(21) S. Dunn, P. M. Jones and D. E. Gallardo, J. Am. Chem. Soc., 129 (2007) 8724.
(22) P. M. Jones and S. Dunn, Nanotechnology, 18 (2007) 185702.
(23) S. Dunn, S. Sharp and S. Burgess, Nanotechnology, 20 (2009) 115604.
(24) P. M. Jones and S. Dunn, J. Phys. D: Appl. Phys., 42 (2009) 065408.
(25) S. V. Kalinin, D. A. Bonnell, T. Alvarez, X. Lei, Z. Hu, J. H. Ferris, Q. Zhang and S. Dunn, Nano Lett., 2 (2002) 589.
(26) J. Chen, H. Lu, H.-J. Liu, Y.-H. Chu, S. Dunn, A. Gruverman and N. Valanoor, Appl. Phys.
Lett., 102 (2013) 182904.
(27) A. M. Schultz, Y. Zhang, P. A. Salvador and G. S. Rohrer, ACS Appl. Mater. Interfaces, 3 (2012) 1562.
(28) X. Liu, K. Kitamura, K. Terabe, H. Hatano and N. Ohashi, Appl. Phys. Lett., 91 (2007) 044101.
(29) W. J. Wang, B. B. Huang, X. C. Ma, Z. Y. Wang, X. Y. Qin, X. Y. Zhang, Y. Dai, and M.
H. Whangbo, Chem. Eur. J. 19 (2013) 14777.
(30) R. Zhang, Y. Dai, Z. Z. Lou, Z. J. Li, Z. Y. Wang, Y. M. Yang, X. Y. Qin, X. Y. Zhang, and B. B. Huang, CrystEngComm 16 (2014) 4931.
(31) Z. Y. Jiang, Y. Y. Liu, M. M. Li, T. Jing, B. B. Huang, X. Y. Zhang, X. Y. Qin, and Y. Dai, Sci. Rep. 6 (2016) 22727.
(32) J. Li, L. J. Cai, J. Shang, Y. Yu, and L. Z. Zhang, Adv. Mater. 28 (2016) 4059.
(33) J. Li, G. M. Zhan, Y. Yu, and L. Z. Zhang, Nat. Commun. 7 (2016) 11480.
(34) J. Zhang, F. J. Shi, J. Lin, D. F. Chen, J. M. Gao, Z. X. Huang, X. X. Ding, and C. C. Tang, Chem. Mater. 20 (2008) 2937.
(35) M. L. Guan, C. Xiao, J. Zhang, S. J. Fan, R. An, Q. M. Cheng, J. F. Xie, M. Zhou, B. J. Ye, and Y. Xie, J. Am. Chem. Soc. 135 (2013) 10411.
(36) X. F. Chang, J. Huang, C. Cheng, Q. Sui, W. Sha, G. B. Ji, S. B. Deng, and G. Yu, Catal.
Commun. 11 (2010) 460.
(37) Z. Z. Lou, B. B. Huang, Z. Y. Wang, X. C. Ma, R. Zhang, X. Y. Zhang, X. Y. Qin, Y. Dai, and M. H. Whangbo, Chem. Mater. 26 (2014) 3873.
(38) X. L. Zhu, Z. Y. Wang, B. B. Huang, W. Wei, Y. Dai, X. Y. Zhang, and X. Y. Qin, APL Mater. 3 (2015) 104413.
(39) A. Al-keisy, L. Ren, D. D. Cui, Z. F. Xu, X. Xu, X. D. Su, W. C. Hao, S. X. Dou, Y. and Du, J. Mater. Chem. A 4 (2016) 10992.
(40) X. L. Zhu, P. Wang, B. B. Huang, X. C. Ma, X. Y. Qin, X. Y. Zhang, and Y. Dai, Appl.
Catal. B 199 (2016) 315. (19) W. J. Wang, B. B. Huang, X. C. Ma, Z. Y. Wang, X. Y. Qin, X. Y. Zhang, Y. Dai, and M. H. Whangbo, Chem. Eur. J. 19 (2013) 14777.
(41) R. Li, F. Zhang, D. Wang, J. Yang, M. Li, J. Zhu, X. Zhou, H. Fan, and C. Li, Nat. Commun.
4 (2013) 1432.
(42) L. Ye, J. Liu, L. Tian, T. Peng, and L. Zan, Appl. Catal. B 134–135 (2013) 60.
(43) H. Lin, L. Li, M. Zhao, X. Huang, X. Chen, G. Li, and R. Yu, J. Am. Chem. Soc. 134 (2012) 8328.
(44) T. Ohno, K. Sarukawa, and M. Matsumura, New J. Chem. 26 (2002) 1167.
(45) C. Liu, X. Han, S. Xie, Q. Kuang, X. Wang, M. Jin, Z. Xie, and L. Zheng, Chem. Asian J.
8 (2013) 282.
(46) J. Yu, J. Low, W. Xiao, P. Zhou, and M. Jaroniec, J. Am. Chem. Soc. 136 (2014) 8839.
(47) N. Murakami, Y. Kurihara, T. Tsubota, and T. Ohno, J. Phys. Chem. C 113 (2009) 3062.
(48) P. Zhang, T. Tachikawa, Z. Bian, and Z. Majima, Appl. Catal. B 176–177 (2015) 678.
(49) X. Wang, R. Li, Q. Xu, H. Han, and C. Li, Acta Phys. -Chim. Sin. 29 (2013) 1566.
(50) Z. Zheng, B. Huang, J. Lu, X. Qin, X. Zhang, and Y. Dai, Chem. Eur. J. 17 (2011) 15032.
(51) T. Tachikawa, S. Yamashita, and T. Majima, J. Am. Chem. Soc. 133 (2011) 7197.
(52) P. Li, Y. Zhou, Z. Zhao, Q. Xu, X. Wang, M. Xiao, and Z. Zou, J. Am. Chem. Soc. 137 (2015) 9547.
(53) L. Wang, J. Ge, A. Wang, M. Deng, X. Wang, S. Bai, R. Li, J. Jiang, Q. Zhang, Y. Luo, and Y. Xiong, Angew. Chem. Int. Ed. 53 (2014) 5107.
(54) G. Li, X. Tao, R. Chen, F. Fan, and C. Li, Chem. Eur. J. 21 (2015) 14337.
(55) L. Zhang, J. Shi, M. Liu, D. Jing, and L. Guo, Chem. Commun. 50 (2014) 192.
(56) R. Li, H. Han, F. Zhang, D. Wang, and C. Li, Energy Envion. Sci. 7 (2014) 1369.
(57) T. Liu, X. Zhou, M. Dupuisc, and C. Li, Phys. Chem. Chem. Phys. 17 (2015) 23503.
(58) J. Zhu, F. Fan, R. Chen, H. An, Z. Feng, and C. Li, Angew. Chem. Int. Ed. 54 (2015) 9111.
(59) B. Wang, S. Chen, and L. Guo, Appl. Catal. B 166-167 (2015) 320.
(60) B. Wang, S. Chen, and L. Guo, ChemCatChem 8 (2016) 798.
(61) X. Cai, L. Mao, J. Zhang, M. Zhu, M. Fujitsuka, and T. Majima, J. Mat. Chem. A 5 (2017) 10442.
(62) K. Iizuka, T. Wato, Y. Miseki, K. Saito, and A. Kudo, J. Am. Chem. Soc. 133 (2011) 20863.
(63) Y. Miseki, H. Kato, and A. Kudo, Energy Environ. Sci. 2 (2009) 306.
(64) S. Bai, X. Li, Q. Kong, R. Long, C. Wang, J. Jiang, and Y. Xiong, Adv. Mater. 27 (2015) 3444.
(65) L. Zhang, W. Wang, S. Sun, D. Jiang, and E. Gao, Appl. Catal. B 162 (2015) 470.
(66) Z. Haider, J.-Y. Zheng, and Y.-S. Kang, Phys. Chem. Chem. Phys., 18 (2016) 19595.
(67) B. Wang, M. Liu, Z. H. Zhou, and L. Guo, Adv. Sci. 2 (2015) 1500153.
(68) N. Li, M. Liu, Z. Zhou, J. Zhou, Y. Sun, and L. Guo, Nanoscale 6 (2014) 9695.
(69) S. Na-Phattalung, M. F. Smith, K. Kim, M. H. Du, S. H. Wei, S. B. Zhang, and S.
Limpijumnong, Phys. Rev. B: Condens. Matter Mater. Phys. 73 (2006) 125205.
(70) G. Mattioli, F. Filippone, P. Alippi, A. A. Bonapasta, Phys. Rev. B: Condens. Matter Mater.
Phys. 78 (2008) 241201.
(71) C. Spreafico and J. VandeVondele, Phys. Chem. Chem. Phys. 16 (2014) 26144.
(72) N. Aiga, Q. Jia, K. Watanabe, A. Kudo, T. Sugimoto, and Y. Matsumoto, J. Phys. Chem. C 117 (2013) 9881.
(73) A. Litke, J. M. Hensen, and J. P. Hofmann, J. Phys. Chem. C 121 (2017) 10153.
(74) J. J. M. Vequizo, H. Matsunaga, T. Ishiku, S. Kamimura, T. Ohno, and A. Yamakata, ACS Catal. 7 (2017) 2644.
(75) A. Yamakata, J. J. M. Vequizo, and H. Matsunaga, J. Phys. Chem. C 119 (2015) 24538.
(76) A. Yamakata, H. Yeilin, M. Kawaguchi, T. Hisatomi, J. Kubota, Y. Sakata, and K. Domen, J. Photochem. Photobio. A 313 (2015) 168.
(77) A. Yamakata, J. J. M. Vequizo, and M. Kawaguchi, J. Phys. Chem. C 119 (2015) 1880.
(78) L. B. Hoch, P. Szymanski, K. K. Ghuman, L. He, K. Libao, Q. Qiao, L. M. Reyes, Y. Zhu, M. A. El-Sayed, C. V. Singh, and G. A. Ozin, Proc. Nat. Acad. Sci., 113 (2016) E8011.
(79) J. Xu, Y. Teng, and F. Teng, Sci. Rep. 6 (2016) 32457.
(80) T. H. Jeon, W. Choi, and H. Park, J. Phys. Chem. C 115 (2011) 7134.
(81) K. E. deKrafft, C. Wang, and W. Lin, Adv. Mater. 24 (2012) 2014.
(82) A. J. Cowan, C. J. Barnett, S. R. Pendlebury, M. Barroso, K. Sivula, M. Grätzel, J. R.
Durrant, and D. R. Klug, J. Am. Chem. Soc. 133 (2011) 10134.
(83) F. Mou, L. Xu, H. Ma, J. Guan, D. Chen, and S. Wang, Nanoscale 4 (2012) 4650.
(84) S. Rtimi, R. Sanjines, J. Kiwi, C. Pulgarin, M. Bensimon, I. Khmel, and V. Nadtochenko, RSC Adv., 5 (2015) 101751.
(85) S. Rtimi, C. Pulgarin, V. Nadtochenko, F. E. Gostev, I. V. Shelaev, and J. Kiwi, Sci. Rep. 6 (2016) 30113.
(86) Y. Bessekhouad, D. Rober, and J.-V. Weber, Catal. Today 101 (2005) 315.
(87) J. Zhang, H. Zhu, S. Zheng, F. Pan, T. Wang, ACS Appl. Mater. Interfaces 1 (2009) 2111.
(88) L. Yang, S. Luo, Y. Li, Y. Xiao, Q. Kang, and Q. Cai, Environ. Sci. Technol. 44 (2010) 7641.
(89) Y. Wang, Y. Zhang, G. Zhao, H. Tian, H. Shi, and T. Zhou, ACS Appl. Mater. Interfaces 4 (2012) 3965.
(90) M. Law, L. E. Greene, A. Radenovic, T. Kuykendall, J. Liphardt, and P. Yang, J. Phys.
Chem. B 110 (2006) 22652.
(91) L. Wu, J. Xing, Y. Hou, F. Y. Xiao, Z. Li, and H. G. Yang, Chem. Eur. J. 19 (2013) 8393.
(92) K. Y. Song, M. K. Park, Y. T. Kwon, H. W. Lee, W. J. Chung, and W. I. Lee, Chem. Mater.
13 (2001) 2349.
(93) F. Ribonia, L. G. Bettini, D. W. Bahnemann, and E. Selli, Catal. Today 209 (2013) 28.
(94) W. Yao, B. Zhang, C. Huang, C. Ma, X. Song, and Q. Xu, J. Mater. Chem. 22 (2012) 4050.
(95) W. Teng, X. Li, Q. Zhao, and G. Chen, J. Mater. Chem. A 1 (2013) 9060.
(96) S. K. Poznyak, D. V. Talapin, and A. I. Kulak, J. Phys. Chem. B 105 (2001) 4816.
(97) D. Shchukin, S. Poznyak, A. Kulak, and P. Pichat, J. Photochem. Photobiol. A 162 (2004)
423.
(98) V. Rodríguez-González, A. Moreno-Rodríguez, M. May, F. Tzompantzi, and R. Gómez, J.
Photochem. Photobiol. A 193 (2008) 266.
(99) J. Mu, B. Chen, M. Zhang, Z. Guo, P. Zhang, Z. Zhang, Y. Sun, C. Shao, and Y. Liu, ACS Appl. Mater. Interfaces 4 (2012) 424.
(100) S. Pavasupree, Y. Suzuki, S. Pivsa-Art, and S. Yoshikawa, J. Solid State Chem. 178 (2005) 128.
(101) I. Alessandri, M. Zucca, M. Ferroni, E. Bontempi, and L. E. Depero, Small 5 (2009) 336.
(102) J. Tian, Y. Sang, Z. Zhao, W. Zhou, D. Wang, X. Kang, H. Liu, J. Wang, S. Chen, H. Cai, and H. Huang, Small 9 (2013) 3864.
(103) Y. Ide, N. Inami, H. Hattori, K. Saito, M. Sohmiya, N. Tsunoji, K. Komaguchi, T. Sano, Y. Bando, D. Golberg, and Y. Sugahara, Angew. Chem. Int. Ed. 55 (2016) 3600.
(104) T. Miyagi, M. Kamei, T. Mitsuhashi, T. Ishigaki, and A. Yamazaki, Chem. Phys. Lett. 390 (2004) 399.
(105) S. Shen, X. Wang, T. Chen, Z. Feng, and C. Li, J. Phys. Chem. C 118 (2014) 12661.
(106) X. Wang, Q. Xu, M. Li, S. Shen, X. Wang, Y. Wang, Z. Feng, J. Shi, H. Han, and C. Li, Angew. Chem. Int. Ed. 51 (2012) 13089.
(107) J. Hou, C. Yang, Z. Wang, W. Zhou, S. Jiao, and H. Zhu, Appl. Catal. B 142-143 (2013) 504.
(108) S. Khanchandani, P. K. Srivastava, S. Kumar, S. Ghosh, and A. K. Ganguli, Inorg. Chem.
53 (2014) 8902.
(109) X.-L. Yin, G.-Y. He, B. Sun, W.-J. Jiang, D.-J. Xue, A.-D. Xia, L.-J. Wan, and J.-S. Hu, Nano Energy 28 (2016) 319.
(110) C. Gao, J. Li, Z. Shan, F. Huang, and H. Shen, Mater. Chem. Phys. 122 (2012) 183.
(111) S. K. Sarkar, J. Y. Kim, D. N. Goldstein, N. R. Neale, K. Zhu, C. M. Elliott, A. J. Frank, S. M. George, J. Phys. Chem. C 114 (2010) 8032.
(112) B. Chai, T. Peng, P. Zeng, and J. Mao, J. Mater. Chem. 21 (2011) 14587.
(113) J. Wang, X. Li, X. Li, J. Zhu, and H. Li, Nanoscale 5 (2013) 1876.
(114) G. Tian, Y. Chen, H.-L. Bao, X. Meng, K. Pan, W. Zhou, C. Tian, J.-Q. Wang, and H. Fu, J. Mater. Chem. 22 (2012) 2081.
(115) X. Wang, Y. Tang, Z. Chen, and T.-T. Lim, J. Mater. Chem. 22 (2012) 23149.
(116) Y. Hou, X. Li, Q. Zhao, X. Quan, and G. Chen, J. Mater. Chem. 21 (2011) 18067.
(117) K. K. Nanda, S. Swain, B. Satpati, L. Besra, B. Mishra, and Y. S. Chaudhary, ACS Appl.
Mater. Interfaces 7 (2015) 7970.
(118) Z. Zhang, W. Wang, and E. Gao, J. Mater. Sci. 49 (2014) 7325.
(119) E. Borgarello, J. Kiwi, E. Pelizzetti, M. Visca, and M. Grätzel, Nature 289 (1981) 158.
(120) K. Hirano, E. Suzuki, A. Ishikawa, T. Moroi, H. Shiroishi, and M. Kaneko, J. Photochem.
Photobiol. A 136 (2000) 157.
(121) K. Vinodgopal, X. Hua, R. L. Dahlgren, A. G. Lappin, L. K. Patterson, and P. V. Kamat, J. Phys. Chem., 99 (1995)10883.
(122) Y. Saito, W. Kubo, T. Kitamura, Y. Wada, and S. Yanagida, J. Photochem. Photobiol. A 90 (1995) 153.
(123) W. Kim, T. Tachikawa, T. Majima, C. Li, H.-J. Kim and W. Choi, Energy Environ. Sci., 3 (2010) 1789.
(124) M. Zhu, Y. Lu, Y. Du, J. Li, X. Wang, and P. Yang, Int. J. Hydro. Energy 36 (2011) 4298.
(125) T. Hasobe, H. Sakai, K. Mase, K. Ohkubo, and S. Fukuzumi, J. Phys. Chem. C 117 (2013) 4441.
(126) E. Bae, W. Choi, J. Park, H. S. Shin, S. B. Kim, and J. S. Lee, J. Phys. Chem. B 108 (2004) 14093.
(127) E. Bae, and W. Choi, J. Phys. Chem. B 110 (2006) 14792.
(128) K. E. Lee, M. A. Gomez, S. Elouatik, and G. P. Demopoulos, Langmuir 26 (2010) 9575.
(129) H. Hagiwara, N. Ono, T. Inoue, H. Matsumoto, and T. Ishihara, Angew. Chem. Int. Ed.
45 (2006) 1420.
(130) H. Hagiwara, T. Inoue, K. Kaneko, and T. Ishihara, Chem. Eur. J. 15 (2009) 12862.
(131) H. Hagiwara, T. Inoue, S. Ida, and T. Ishihara, Phys. Chem. Chem. Phys., 13 (2011) 18031.
(132) K. Sekizawa, K. Maeda, K. Domen, K. Koike, and O. Ishitani, J. Am. Chem. Soc. 135 (2013) 4596.
(133) S. Sakthivel, M. V. Shankar, M. Palanichamy, B. Arabindoo, D. W. Bahnemann, and V.
Murugesan, Water Res. 38 (2004) 3001.
(134) A. A. Ismail, S. A. Al-Sayari, and D. W. Bahnemann, Catal. Today 209 (2013) 2.
(135) O. Merka, D. W. Bahnemann, and M. Wark, ChemCatChem 4 (2012) 1819.
(136) X. Zong, H. Yan, G. Wu, G. Ma, F. Wen, L. Wang, and C. Li, J. Am. Chem. Soc. 130 (2008) 7176.
(137) K. Maeda, D. Lu, K. Teramuraxa, and K. Domen, J. Mater. Chem. 18 (2008) 3539.
(138) K. Maeda, T. Ohno, and K. Domen, Chem. Sci. 2 (2011) 1362.
(139) D. Wang, R. Li, J. Zhu, J. Shi, J. Han, X. Zong, and C. Li, J. Phys. Chem. C 116 (2012) 5082.
(140) M. W. Kanan, and D. G. Nocera, Science 321 (2008) 1072.
(141) C. Ding, J. Shi, D. Wang, Z. Wang, N. Wang, G. Liu, F. Xiong, and C. Li, Phys. Chem.
Chem. Phys. 15 (2013) 4589.
(142) Y. P. Xie, G. Liu, G. Q. Lu, H.-M. Cheng, Nanoscale 4 (2012) 1267.
(143) A. Yamakata, M. Kawaguchi, N. Nishimura, T. Minegishi, J. Kubota, and K. Domen, J.
Phys. Chem. C 118 (2014) 23897.
論 文
光電子増倍管の印加電圧を制御する改良積分法の 液体シンチレーション計測への応用
原 正憲a,坂口 春菜a,中山 将人a,阿蘇 司b,庄司 美樹c, 古澤 孝良d,加藤 結花d,吉村 共之d
a 富山大学 研究推進機構 水素同位体科学研究センター
〒930-8555 富山県富山市五福3190
b 富山高等専門学校 電子情報子工学科
〒939-0293 射水市海老江練合 1-2
c 富山大学 研究推進機構 研究推進総合支援センター 生命科学先端研究支援ユニット
〒930-0194 富山市杉谷2630
d 日立製作所
〒181-8622 東京都三鷹市牟礼 6-22-1
Modified integral counting method by controlling high voltage of photomultipliers for liquid scintillation counting
Masanori Hara
a, Haruna Sakaguchi
a, Masato Nakayama
a, Tsukasa Aso
b, Miki Shoji
c, Takayoshi Furusawa
d, Yuka Kato
d, Tomoyuki Yoshimura
da
Hydrogen Isotope Research Renter, Organization for Promotion of Research, University of Toyama, Gofuku 3190,
Toyama 930-8555, Japan
b
Electronics and Computer Engineering, Toyama National College of Technology, Ebie-neriya 1-2, Imizu city, Toyama 933-0293, Japan
c
Life Science Research Center, Organization for Promotion of Research, University of Toyama, Sugitani 2630, Toyama 930-0194, Japan
d
Hitachi, Ltd.,
6-22-1 Mure, Mitaka city, Tokyo 181-8622, Japan
(Received January 27, 2017; accepted July 24, 2017)
Abstract
The modified integral counting method by control of the high voltage of photomultipliers (MICM-HV) was investigated to show its applicability for radioactivity analysis. In the MICM-HV, pulse height spectra of the sample are measured at various high voltages of photomultipliers in the liquid scintillation counter.
The spectra are converted to integral spectra, which are extrapolated to give the convergence point. The counting rate at the convergence point corresponds to the disintegration rate of the sample. The MICM-HV determines the disintegration rate with one cocktail sample and the method requires no unquenched standard sample.
Keywords: Modified integral counting method, high voltage, photomultiplier, scintillator
1. Introduction
Liquid scintillation counting (LSC) is widely used for the radioactivity analysis of beta emitters, whereas LSC requires a quenching correction to determine a counting efficiency. Several quenching correction methods have been proposed. The quenching correction is usually carried out using a quench correction curve which is made by a quenched standard set [1]. Quenched standard sets for both
3H and
14C can be purchased from some suppliers, whereas standards sets for other nuclides need to be prepared by oneself. On the other hand, no quenched standard is required in direct methods [1] such as the integral counting method [2] and the efficiency tracing method [3]. Homma et al.
have proposed the modified integral counting method (MICM) [4, 5]. The MICM has been used routine works of moderate precision, because no complicated procedure is necessary. In this method, the disintegration rate is obtained from the integral count rate of the sample at the zero detection threshold (ZDT). However,
3H unquenched standard sample which the activity of
3H is known is required to determine the ZDT. The pulse height spectrum of
3H unquenched sample is measured, and the spectrum obtained is transformed to the integral spectrum,
max
( ) ( )
Ch
Ch Chi
IC Chi C Ch
(1)
where IC(Chi) is the integral counts from a given integral channel (Chi) to the maximum channel (Ch
max) and C(Ch) is the count rate at a given channel number, respectively. The integral spectrum is extrapolated to the disintegration rate of the standard sample and the ZDT is found. Subsequently, the pulse height spectrum of an unknown sample is measured and it is converted to the integral spectrum by Eq. (1).
The integral spectrum of the sample is extrapolated to the ZDT, the disintegration rate of unknown sample is determined the count rate at the ZDT. To know the disintegration rate of unknown sample the MICM requires an unquenched standard of
3H. The MICM with various quenched samples (MICM-VQ) requires several quenched samples having same amount of radioactive material[6]. In the MICM-VQ these spectra are converted to integral spectra by Eq. (1) and these integral spectra are extrapolated to find the convergence point which corresponds to the ZDT, because the integral counts at the ZDT does not depends on the quenching of the sample. The integral count rate at the ZDT corresponds to the disintegration rate of sample. However, this technique can not be applied for one sample.
In this study, the determination method of the disintegration rate of one sample cocktail without an unquenched standard was developed. Several integral spectra of one sample were obtained by the control of the high voltage of photomultipliers (PMTs).
These spectra were extrapolated to find the ZDT like as the MICM-VQ. The disintegration rate of the sample was obtained from the integral counts at the ZDT. The method developed was named as the modified integral counting method by the control of high voltage of PMTs (MICM-HV). The disintegration rates obtained by the MICM-HV were compared with those by the MICM-VQ.
2. Experimental
The quenched standard set of
14C of toluene based scintillator (denoted as TL set) and that of Ultima Gold (denoted as UG set) were purchased as sample cocktails.
The quenched standard sets were composed of 10 samples which contained same
amount of radioactive material. The disintegration rate of TL set and of UG set were
determined to be 128700 dpm and 122200 dpm by suppliers, respectively. The
uncertainty of both sets was ±1.3% in 99% confidence level. The five samples of TL set are named from TL A to TL E with increasing quenching, and the samples of UG set are from UG 1 to UG 5.
The pulse height spectra from scintillation cocktails were measured by the liquid scintillation counter, Aloka LSC-LB5. This scintillation counter has three of PMTs for the scintillation counting with the coincidence unit to reduce the background counts. This system is equipped the 4000 channel multichannel analyzer to register the pulse height spectrum of scintillation cocktail. The channel range for measuring the
14C spectrum was adjusted from 0 to 200 keV. The pulse height spectra of samples were registered for 10 min when the high voltage of PMTs was controlled in the range from 1500 V to 1540 V.
3. Results and discussion
3.1. MICM with various quenched samples
Nakayama et al. reports MICM-VQ can be applied for various liquid scintillators such as toluene and Ultima Gold [7]. The disintegration rates of TL and UG sets were determined by the MICM-VQ. Fig. 1 shows the pulse height spectra of UG set at 1533 V for PMTs. The abscissa
and the ordinate are the channel number and the counting rate, respectively. The pulse height of UG 1 with the lowest quenching level is extended to 2500 channel.
However, the pulse height of quenched samples decreased with increasing the quenching. On the other hand, the peak positions of pulse height spectra were kept.
These spectra were converted to the integral spectra with using
Figure 1. Pulse height spectra of UG set. These spectra were obtained under 1533V of the high voltage of photomultipliers in LSC-LB 5.
Eq. (1). They are shown in Fig. 2.
The value of IC decreased with increasing Chi. The fitting function was obtained from the integral spectrum where a second order function was applied. The fitting was done for the higher channel above the peak around 150 channel when the high channel was set to be satisfied
2
0.9997
R
.The convergence point was found at -13 channel and the disintegration rate of samples was evaluated to be 123.8 ±0.2 kdpm. Since low
energy beta particles can generate insufficient number of photons to detect, a channel number of a convergence point has a negative value. The uncertainty of obtained value is the standard deviation of fitting functions at the convergence point. The counting rate at the convergence point agreed with the assayed value of UG set. The evaluations of the disintegration rate of both TL and UG sets at other values of high voltage of PMTs were listed in Table 1 and 2, respectively. The disintegration rate evaluated agreed with the assayed value by the supplier. Within the measurement range the high voltage of PMTs does not influence on the evaluation of the disintegration rate by the MICM-VQ.
Table 1. Obtained value of Toluene quenched set (TL) with MICM-VQ.
High voltage (V) Convergence point (Chi)
Disintegration rate (kdpm)
[obtained]/[assayed]
1500 -1 128.4±0.3 1.00
1510 -2 128.4±0.4 1.00
1520 -1 128.2±0.4 1.00
1533 -3 128.1±0.3 1.00
1540 1 127.3±0.2 0.99
Figure 2. The integral spectra of UG set. The integral spectra were obtained from the pulse height spectra with using Eq. (1). The high voltage of PMTs was adjusted at 1533 V. The bold and thin lines indicate the obtained spectra and the fitting curves, respectively.
3.2. MICM by control of high voltage of PMTs
The MICM-VQ requires several samples, which contain same amount of radioactive material, to determine the ZDT. If the several spectra are obtained from one sample, the disintegration rate of its sample will be determined by using the MICM. By controlling the high voltage of PMTs, the pulse height from PMTs can be regulated. The control of high voltages works like an addition of quencher. Therefore, several pulse height spectra can be obtained from one sample by the control of the high voltages. To confirm the applicability of the MICM by the control of the high voltage of PMTs (MICM-HV), the pulse height spectra of both TL and UG sets were obtained under several different values of high voltage.
Fig. 3 shows the dependence of pulse height spectra on the high voltages of PMTs. These spectra were
obtained from UG1 which was a less quenched sample in UG set. The pulse height spectra were stretched to the higher pulse height side with increasing high voltage of the PMTs. However, the peak position of the pulse height spectra was maintained around 150
Table 2. Obtained value of Ultima Gold quenched set (UG) with MICM-VQ.
High voltage (V) Convergence point (Chi)
Disintegration rate (kdpm)
[obtained]/[assayed]
1500 -15 124.2±0.3 1.02
1510 -13 123.9±0.2 1.01
1520 -13 123.9±0.1 1.01
1533 -13 123.8±0.2 1.01
1540 -12 123.4±0.2 1.01
Figure 3. Pulse height spectra of UG 1 at various high voltages of PMTs in LSC-LB5.
channel. This change in the spectra with the variation of high voltages was similar to the effect of the quenching as shown in Fig. 1. In other words, the control of the high voltage of PMTs can provide a set of spectra like a set of quenched samples. These spectra obtained were converted to the integral spectra with using Eq. (1) as shown in Fig. 4. All
integral spectra monotonically decreases. These spectra were fitted by a second order function. The fitting curves from the integral spectra obviously show the convergence point at 7 channel. The counting rate at the convergence point was found to be 121.2
Table 4. Obtained value of Ultima Gold quenched set with MICM-HV.
Sample Convergence point (ch.)
Disintegration rate (kdpm)
[obtained]/[assayed]
UG 1 7 121.2±0.1 0.99
UG 2 -23 125.3±0.2 1.03
UG 3 6 120.3±0.2 0.98
UG 4 -9 123.0±0.2 1.01
UG 5 -15 124.3±0.2 1.02
Table 3. Obtained value of Toluene quenched set with MICM-HV.
Sample Convergence point (ch.)
Disintegration rate (kdpm)
[obtained]/[assayed]
TL A 35 124.6±0.1 0.97
TL B 35 124.2±0.2 0.97
TL C 30 124.0±0.3 0.96
TL D 21 124.3±0.2 0.97
TL E 9 125.4±0.2 0.97
Figure 4. The integral spectra of UG 1 at various high voltages of PMTs. The bold and thin lines indicate the obtained spectra and the fitting curves, respectively.
kcpm. The integral spectra of both TL and UG sets were obtained, and the disintegration rates were evaluated from the convergence point. These results of TL and UG were listed in Tables 3 and 4, respectively. In TL set, the disintegration rates evaluated were 3 % less than the assayed value. The values evaluated for UG set slightly deviated from the assayed value within ±3 %. These results indicate that the MICM-HV can be used for the radioactivity measurement of moderate precision. It is also worth to mention that the MICM-HV is able to determine the disintegration rate from only one sample and it was applicable for various scintillators
.4. Conclusions
A new method based on the MICM, MICM-HV, was developed for the measurement of disintegration rate of a single sample without unquenched standard.
The pulse height spectra of a sample were measured under various high voltages of PMTs in the commercial liquid scintillation counter. The pulse height spectra obtained were converted to the integral spectra to find the convergence point, and the disintegration rate was determined from the integral counts at the convergence point.
The disintegration rate evaluated by the MICM-HV agreed with the assayed value within 3 % of deviation. It indicates that the MICM-HV has a potential for the radioactivity analysis from one sample with moderate precision.
Acknowledgement
This work was supported by JSPS KAKENHI Grant Number 26610065.
References
[1] M.F. L'Annunziata, M. J. Kessler, Liquid scintillation analysis: principles and practice, Chpt. 5, M. F. L'Annunziata (Eds.), Handbook of Radioactivity Analysis.
Academic press, California, (2003).
[2] G. Goldstein, Absolute liquid-scintillation counting of beta emitters., Nucleonics
23(1965) 67-69.
[3] M. Takiue, H. Ishikawa, Thermal neutron reaction cross section measurements for fourteen nuclides with a liquid scintillation spectrometer. Nucl. Instrum. Methods., 148(1978) 157-161.
[4] Y. Homma, Y. Murase, K. Hanada, The zero detection threshold of a liquid scintillation spectrometer and its application to liquid scintillation counting, Appl.
Radiat. Isot., 45(1994) 341-344.
[5] Y. Homma, Y. Murase, K. Hanada, Absolute liquid scintillation counting of 35S and 45Ca using a modified integral counting method, J. Radioanal. Nucl. Chem., 187(1994) 367-374.
[6] M. Hara, M. Nakayama, K. Hirokami, T. Aso, Appropriate quenching level in modified integral counting method by liquid scintillation counting, J. Radioanal. Nucl.
Chem., 310(2016)857-863.
[7] M. Nakayama, M. Hara, M. Matsuyama, K. Hirokami, Modified counting method
with various quenched samples for different scintillators, Radio. Safety Manage.,
16(2017)1-7.
論 文
Pd–Ag–Rh 三元系合金における磁化率と水素吸収量の相関
赤丸 悟士,原 正憲
富山大学研究推進機構水素同位体科学研究センター
〒930-8555 富山市五福
3190
Relation between the magnetic susceptibility and the amount of absorbed hydrogen for the Pd–Ag–Rh ternary alloy
Satoshi Akamaru, Masanori Hara
Hydrogen Isotope Research Center, Organization for Promotion of Research, University of Toyama
Gofuku 3190, Toyama 930-8555, Japan
(Received January 31, 2017; accepted July 14, 2017)
Abstract
The magnetic susceptibility and equilibrium pressure of a Pd
–
Ag–
Rh ternary alloy and hydrogen system were simultaneously measured, and the relationship between the magnetic susceptibility and the amount of absorbed hydrogen was investigated. The magnetic susceptibility linearly decreased to a value approaching zero with increasing hydrogen content. A high hydrogen content with a magnetic susceptibility close to zero is consistent with a hydride phase. This behavior is similar to that of Pd–
Ag or Pd–
Rh binary alloys and hydrogen systems, suggesting that the amount of hydrogen absorbed by the Pd–
Ag–
Rh ternary alloy is correlated with its electronic band structure, as in the case of the Pd-binary alloys.1. Introduction
Palladium metal is well-known as a hydrogen storage material, and various
applications related to hydrogen usage have been developed including hydrogen sensing and hydrogen purification systems. Pd-based binary alloys that contain a second transition metal have been designed to adjust the hydrogen absorption properties, and systematic studies on Pd-based binary alloys and hydrogen systems have been performed to obtain the relation between the properties and the alloying elements [1].
The amount of hydrogen absorption in metallic Pd depends on its electronic structure; the number of unoccupied d-states is correlated with the amount of absorbed hydrogen [2]. Each absorbed hydrogen atom provides an electron to Pd, thereby occupying the unoccupied d-states of Pd. When the unoccupied d-states of Pd are completely filled with electrons by the absorption of hydrogen, Pd hydride is formed, which cannot undergo further hydrogen absorption.
Alloying Pd with a transition metal is an effective way to control the number of
unoccupied d-states in Pd; the amount of absorbed hydrogen is reduced with the supply of
electrons from the transition metal to Pd. To determine the relation between the amount of
absorbed hydrogen and the unoccupied d-states in a Pd alloy, Pd – Ag, and Pd – Rh were
systematically investigated [3]. Because alloying Pd with Ag or Rh corresponds to addition or
removal of electrons from Pd, respectively, the number of unoccupied d-states of Pd can be
controlled without deformation of the electronic band structure of Pd. Magnetic susceptibility
measurements of a Pd alloy with various hydrogen contents can be used to study its
electronic structure. The magnetic susceptibility of a Pauli paramagnet is proportional to the
density of states at the Fermi level [4]. If the electronic band structure of a Pd alloy is
regarded as the same as that of Pd metal, the change in the unoccupied d-states via alloying
and the degree of filling of these d-states by hydrogen absorption can be estimated from
magnetic susceptibility measurements. We previously investigated the magnetic susceptibility
of Pd – Ag and Pd – Rh binary alloys with various hydrogen contents and found that the
amount of absorbed hydrogen was correlated with the amount of doping electron by alloying, namely the amount of substituting elements [3].
The hydrogen absorption properties of Pd-based ternary alloys have not been extensively studied; therefore a lack of the information about the effect of a third element on the hydrogen absorption properties still exists. In the present study, we measured the magnetic susceptibility and the hydrogen absorption isotherm of a Pd – Ag – Rh alloy with various hydrogen contents to verify that the model applied to Pd-based binary alloys can be extended to analyze Pd-based ternary alloys.
2. Experimental
The Pd
0.92Ag
0.06Rh
0.02ternary alloy was used as prepared in previous study [5].
Predetermined amounts of Pd, Ag, and Rh metals were weighed out; then, the mixture was melted in an arc melting furnace [5]. The obtained ingot was grounded into powder using a file, and a part of the powder was subjected to X-ray diffraction (XRD) analysis. Then 1 g of powder was introduced into a quartz cell connected to the pressure–composition isotherm measurement system. The quartz cell was evacuated down to 1.0 × 10
−4Pa; future, the powder alloy was heated at 523 K
for 2 h. The magnetic susceptibility of the Pd
0.92Ag
0.06Rh
0.02powder was measured via the induced method, which was described in detail in previous papers [3,6].
3. Results
Figure 1 shows the XRD
0 800 1600
30 40 50 60 70 80 90
Pd
0.92Ag
0.06Rh
0.02Intensit y, I / cps
Diffraction angle, 2 / deg
111 200 220 311 222
Figure 1 Powder X-ray diffraction pattern
of Pd
0.92Ag
0.06Rh
0.02ternary alloy.
pattern of the Pd
0.92Ag
0.06Rh
0.02alloy. The XRD data was indexed using a face-centered cubic structure and no unknown diffraction lines were observed. The lattice constant of the Pd
0.92Ag
0.06Rh
0.02alloy was calculated to be 0.3900 nm. If the Pd
0.92Ag
0.06Rh
0.02ternary alloy was regarded as a binary alloy of Pd
0.92Ag
0.08and Pd
0.92Rh
0.08, the lattice constant of Pd
0.92Ag
0.06Rh
0.02expected from Vegard’s law would have been 0.3898 nm, which was consistent with the measured value. These results indicated that a homogeneous Pd
0.92Ag
0.06Rh
0.02ternary alloy with a face-centered cubic structure was obtained.
Figure 2 shows the dependence of both the magnetic susceptibility and equilibrium pressure on the hydrogen content of Pd
0.92Ag
0.06Rh
0.02(denoted as [H]/[Pd–Ag–Rh]). The equilibrium pressure sharply increased with increasing [H]/[Pd–Ag–Rh] from zero to 0.04.
This range corresponded to that of the dissolved hydrogen region. The equilibrium pressure
0 10 20 30 40 50 60 70
10
010
110
20 0.1 0.2 0.3 0.4 0.5 0.6 0.7 Pd
0.92Ag
0.06Rh
0.02powder
Magneti c suscepti bility, ' / 10
-9m
3kg
-1Equil ibrium p ress ur e, P
e/ kPa
Hydrogen content, [H]/[Pd-Ag-Rh] / -
T = 302 K