博士学位論文
Revitalization of an Old Shopping Street Based on Analysis of Citizen's Behavior
市民の行動分析に基づく商店街活性化
Gaowa (高娃)
Analysis of Citizen's Behavior
市民の行動分析に基づく商店街活性化
by Gaowa
A dissertation submitted to
Graduate School of Engineering, Gunma University for the Degree of
Doctor of Engineering
Department of Chemical and Environmental Engineering Graduate School of Engineering
Gunma University
2013
Professor Yoichi Seki, Chair
Graduate School of Science and Technology, Gunma University, Japan Professor Keizo Ugai, Vice-Chair
Graduate School of Science and Technology, Gunma University, Japan Professor Koichi Yamazaki, Vice-Chair
Graduate School of Science and Technology, Gunma University, Japan Professor Kenji Amagai, Vice-Chair
Graduate School of Science and Technology, Gunma University, Japan Professor Takayuki Takarada, Vice-Chair
Graduate School of Science and Technology, Gunma University, Japan
ii
These days the downtowns in most local cities in Japan have lost their bustle. This social phenomenon has impaired the regional economy and becomes a problem for sustainable society. In this study, I picked up a shopping street of a local city, and suggested measures for this problem based on data analysis and an experiment on a Word- Of-Mouth (WOM) network.
First, citizen's attitude and behavior are clarified by analyzing the data obtained from two large-scale questionnaires on them. In addition, effectiveness of WOM as a way to transmit information, which is one of the measures to revitalize the old shopping street are verified. In this experiment, the spreading of specific shop information is evaluated by analyzing the structure of the WOM network from the viewpoint of graph theory. The analysis of WOM, an example of social networks, is the feature of this study, although there are many researches about the social network constructed on the Internet such as SNS.
The research described here is conducted as part of a project named “Construction of the Town of Kiryu for the Future with Anti-Global-Warming through Regional Power”
supported by the Japan Science and Technology Agency.
In Chapter 1, I organize the factors related to the revitalization of the old shopping street and the city as a background of this study, and describe the objective of this study.
In Chapter 2, the problems are analyzed from the perspective of the storekeepers of shops in the old shopping street based on a questionnaire survey on them. The questions are not only about basic attributes of shops, storekeepers, target customers, and the old shopping street but also what the storekeeper thought about the current condition, such as the problem of shopping street etc. Analyzing the results of the questionnaire survey, I
iii
aging of the storekeepers and deterioration in the financial condition, and the problem thought by storekeepers, such as the inconvenience of parking and insufficient goods’
variation.
In Chapter 3, the problems are analyzed from the citizen's attitude and behavior based on a large-scale questionnaire survey of 10000 citizens in Kiryu city as consumers. Basic characteristics of respondents, where and how to do shopping, points to choose or not to choose a store etc. were asked in the survey. Citizen's behavior of shopping and their evaluation on the old shopping streets are clarified in each region of the city by comparing with competitive Supermarket and Mall neighboring. Two problems: there is inconvenience of moving among the shops in the old shopping street, and the charm of the old shopping street is not known by those who seldom visit it, are grasped by analyzing the data obtained. Moreover, two measures, taking advantage of using EV bus to tour the shopping street and using WOM to transmit the charm of the shopping street, are suggested to deal with the two problems above in consideration of the current condition of the shopping street that is mentioned in Chapter 2.
In Chapter 4, an experiment about information transmission on a WOM network is described. It is found from the questionnaire survey that the charm of the old shopping street is not known by those who seldom visit it. Therefore, it is necessary to find an effective way to make the charm of the old shopping street be known by those who seldom visit it. To verify that WOM is an effective way in this case, members’ conversational relations on the topic of eating-out destinations is investigated for two times on two communities of students in a university. To understand the structure of WOM networks, some indexes, such as n-density, effective edge rate of word-of-mouth, etc. is proposed. In addition, the spreading of specific shop information during the questionnaire surveys of
iv
effectiveness is verified.
In Chapter 5, the conclusion of this research is described.
As described above, I suggested two measures to deal with the two problems that are grasped by data analyzing in consideration of the current condition of the shopping street.
Moreover, WOM network, which is one of the measures mentioned above, is verified as an effective way to transmit information by the experiment. As future works, further analysis, such as taking into the citizens individual attributes on the data obtained, should be done to grasp more problems and find more measures are left.
v
Table of Contents
Chapter 1. Introduction ... 1
1.1. Background of This Study ... 1
1.1.1. The JST Project ... 1
1.1.2. Objectives of This study ... 3
1.2. Related Research ... 6
1.3. Comparison of the conventional researches and this study ... 6
1.4. Definition used in This Study ... 7
1.5. Outline of This Study ... 9
Chapter 2. Questionnaire Survey of Storekeepers in Old Shopping Street ... 11
2.1. Introduction ... 11
2.2. Method ... 11
2.3. Results ... 12
2.3.1. Summary of Shops Condition ... 12
2.3.2. The Financial Condition of Shops ... 16
2.3.3. Problems of Old Shopping Street ... 18
2.4. Discussion ... 19
Chapter 3. Questionnaire Survey on Citizens of Kiryu City ... 20
3.1. Introduction ... 20
3.2. Method ... 20
3.3. Results ... 21
vi
3.3.1. Statistics on Characteristics of Respondents ... 21
3.3.2. Statistics about Shopping Behavior ... 23
3.3.3. Statistics about Shop Evaluation ... 28
3.4. Discussion ... 35
Chapter 4. Experiment on a WOM network ... 38
4.1. Introduction ... 38
4.1.1. Related Research ... 39
4.1.2. The Meaning of WOM Network in This Study ... 40
4.1.3. The Hypothesis to Be Examined ... 40
4.2. Method ... 41
4.2.1. The Questionnaire Survey ... 41
4.2.2. The Definition of the Graph Structure of a WOM Network ... 43
4.3. Results ... 44
4.3.1. The Result of WOM Network ... 44
4.3.2. Relationship between WOM Network and Behavioral Tendency ... 51
4.3.3. Change in Recognition by Spreading of Specific Information ... 55
4.4. Discussion ... 59
Chapter 5. Conclusions and Future Works ... 61
5.1. Conclusions ... 61
5.2. Future works ... 61
Reference ... 62
Acknowledgements ... 64
vii
List of Publications ... 66 List of Presentations ... 67 Appendixes ... 68
1
Chapter 1. Introduction
1.1. Background of This Study
This study is conducted as part of project named “Construction of the Town of Kiryu for the Future with Anti-Global-Warming through Regional Power” supported by the Japan Science and Technology Agency (the JST Project, for short). So at the beginning, the JST Project will be introduced here. Then the objectives of this study will be described.
1.1.1. The JST Project
Among the various problems of modern society, global warming has become one of the most important issues. Analysis, observation, new energy etc. the development of leading- edge technology has been stressed to deal with it. However, how to make use of technology in our lives, include reconsidering of society system, has not been carried out.
In such a situation, as shown in Figure 1-1, the JST Project taking advantage of the characteristics of Kiryu City, Gunma Prefecture of Japan, proposed future city models that developing harmony with nature and reducing CO2 emissions significantly by the cooperation of enterprise, university, government and citizens. There are five Working Groups (WG, for short), that is to say, Bicycle Rental + Eco-point Introduction WG, Regional Resource Utilization WG, Green Tourism WG, Revitalization of Shopping Street WG and Public Transport using Promote WG, in this project team. A Low-carbon City that is compact and less-energy consumption due to introduction of green transportation system, that is to say, the transportation system of low CO2 emission type linked public transportation (such as rail and bus), walk and bicycle effectively, is aimed as a goal by the cooperation of the five WGs.
2
Figure 1-1. Concept of the JST Project [1]
3
1.1.2. Objectives of This Study
As shown in Figure 1-2, there are many factors relevant to developing compact city Kiryu. One of them, revitalization of the old shopping street, which impaired the regional economy greatly, is thought to be a necessary way. In addition, a functional shopping street in downtown can lead the local resident to shop easily by bicycle or on foot and make the dependence rate to the suburbs shopping mall decrease. That is to say, revitalization of shopping street contributes to not only developing a compact city easy to live, but also reducing CO2 emissions significantly.
In order to revitalize the old shopping streets, I am trying to get to know the current condition of it and find effective methods to deal with the problems. Therefore, I conducted two big scale questionnaire surveys of citizens of Kiryu city as consumers and the storekeepers in the old shopping street as sellers and verified two hypotheses, which are problems need to deal with of the old shopping street (Figure 1-3).
Moreover, an experiment about information transmission was done to verify WOM as a way to deal with one of the problems above.
I would be very much delighted if this study could be helpful to develop Low-Carbon compact city Kiryu.
4
Figure 1-2. Relevant Factors for Compact City Kiryu [1]
5
Figure 1-3. Action of Shopping Street WG [1]
6
1.2. Related Research
Factors, such as increasing spending capacity of consumers, growing car ownership, combined with modern shopping habits as buying in large amounts, made the customers changed their shopping place. Cees etc. [2] conducted a survey questionnaire on 150 visitors and buyers to a mall to identify the motives of them for large-scale shopping malls. Further analysis was done based on 130 suitable returned forms and it was found that about half of them visited the shopping mall for pleasure. Also about half of them responded that they would have bought their goods in the central city had the peripheral mall not existed.
Moreover, the shopping mall is more attractive for consumers living a longer distance from the mall.
Cilin etc. [3] investigated the shopping linkages between a closely integrated new shopping precinct, incorporating an edge-of-center superstore, in the small town center of Llanelli in South Wales. The questionnaire survey was taken at seven places in the center during the trading peak hours and 642 copies about the respondent's specific information and the distance to the stores were obtained. Whether going to go other six places was asked and the customers' movement was paid attention to. It is evident that the principal shopping attractions ‘anchor’ the nodes of shopping activity and largely determine the major patterns of pedestrian flows throughout a center.
1.3. Comparison of the Conventional Researches and This Study
Cees investigated the visitors of a large-scale mall only and evaluated the absorption of the shop and the distance, but the quantity and the character of the target are restricted.
Colin paid attention on the relation among the shops and examined the visitors’ shopping pattern, but the object was restricted to the visitors in the fixed time zone. Both the objects are in their shopping time so the accuracy of the answer is doubted for the time
7
convenience. In addition, since both investigations were in the limited time, the representation of the visitors would be under the influence of the weather or the events, etc.
on the day.
On the other hand, in order to understand purchasing behavior of citizens, I conducted large-scale investigation to the whole resident of Kiryu city, and since the investigation period is not one day but one month, the data reflects a usual shopping situation was obtained. Next, there are questions not only about buyer activity but also about the evaluation point to various kinds of shops. That is to say, not only the action step, the last step of AIDA (Attention, Interest, Desire, Action) [4], but also other steps, which show the reason of the action, can also been grasped. Then, since this questionnaire survey was answered in the time of a respondent's sufficient convenience, the data from many viewpoints were obtained. Lastly, since questionnaire survey for both the storekeeper in the old shopping street and citizens of Kiryu city were conducted, comparison from many viewpoints can be done and the present condition of the old shopping street has been grasped more correctly.
1.4. Definition used in This Study
Present Kiryu city is based on old Yamada Gun and consists of several mergers. In this paper, I divided Kiryu city into four areas by geographical location, represented as Old Town, New town, Across river and Detached area as shown in Figure 1-4.
By the way, ● is the person received the questionnaire survey form and ▲ is the person answered it. The detail of the questionnaire survey will be described in Chapter 3.
8
Figure 1-4. Area Divided in Kiryu City [5]
There are 63,576 females and 59,217 male, total 122,793 people living in Kiryu city.
As shown in Figure 1-5, the aging of citizens is very serious in Kiryu city. In this paper, the young, Middle age and the old means the people aged 0 to 39, 40 to 59, 60 or older, respectively.
9
Figure 1-5. Population Pyramid of Kiryu City [5]
Moreover, the store in Kiryu city is classified into following three types. First, the shops located in the Old town, which serves as a problem and a candidate to be improved, and being the target of storekeepers’ survey, named as “Shops in old shopping street”.
Second, 41 representative large-scale retailer stores been selected located in Kiryu city named as “Supermarket”. Finally, the five large-scaled shopping malls, which located in a suburb near Kiryu city, named as “Mall”.
1.5. Outline of This Study
Chapter 2 describes a questionnaire survey of the storekeepers in the old shopping street and clarifies the current business condition of shops in the old shopping streets and the problem thought by storekeepers.
Chapter 3 describes a big scale questionnaire survey of citizens of Kiryu city as consumers and clarifies citizen's behavior of shopping and their evaluation on the old shopping streets.
10
Chapter 4 reports an experiment about information transmission on a WOM network and proves that WOM is an effective way to make the charm of the old shopping street to be known.
Chapter 5 describes the conclusion of this dissertation and direction for future works.
11
Chapter 2. Questionnaire Survey of Storekeepers in Old Shopping Street
2.1. Introduction
Grasping the condition and the problem needed to deal with of the old shopping street is very important for developing the compact city Kiryu. Therefore, several questionnaire surveys include the one on storekeepers in the old shopping street were administered as a part of the JST Project in order to grasp the condition of the shopping streets correctly.
2.2. Method
As shown in Table 2-1, the questionnaire survey of storekeepers in the old shopping street was conducted from February 16 to 28, 2009 with the cooperation of Kiryu city hall, Kiryu Chamber of Commerce and Industry and the storekeepers in the shopping street. The questionnaire sheet was given to 504 storekeepers in 11 shop unions and resulted in 208 valid responses with a 41% recovery percentage. It gathered data about basic condition of each shop, its customers, the shopping street, the management situation, and other conditions. The sheet is attached in Appendixes at the end of this paper.
12
Table 2-1. Distribution and recovery status
Distribution destination
February 16 to 28, 2009 Distribution
number
The number of recovery
Recovery rate
Recovery process
1 Hon-cho 1 30 6 20% Mailing
2 Hon-cho 2 33 16 48%
Mailing and Collect by person
3 Hon-cho 3 55 26 47%
Mailing and Collect by person
4 Hon-cho 4 34 15 44% Mailing
5 Tyuou 33 12 36% Mailing
6 Suehiro-cho 78 15 19% Collect by person
7 Hon-cho 6 77 43 56% Collect by person
8 Nishik-cho 61 31 51% Collect by person
9 Aioi 30 12 40% Mailing
10 Itoya 30 1 3% Mailing
11 Nagasakiya 43 31 72% Collect by person
Total 504 208 41%
2.3. Results
2.3.1. Summary of Shops Condition
There are 94 (45%) private-manage-shop, 110 (53%) corporate-manage-shop and 4
13
(2%) unknown shops in the total 208 shops that responded to the questionnaire survey.
Moreover, about half of them use a part of home as the shop and all the employees are families.
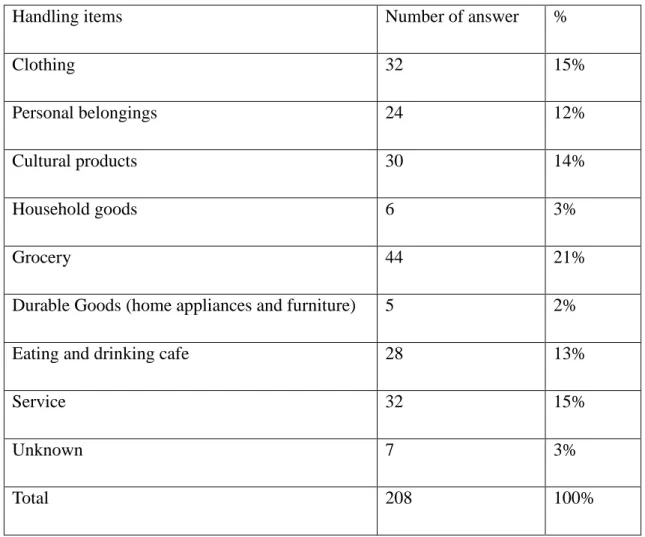
For the handling items, as shown in Table 2-2, handling items of shops in old shopping street is diverse. Grocery is most numerous and Clothing and Service are the next most.
Table 2-2. Handling items of shops in the old shopping street
Handling items Number of answer %
Clothing 32 15%
Personal belongings 24 12%
Cultural products 30 14%
Household goods 6 3%
Grocery 44 21%
Durable Goods (home appliances and furniture) 5 2%
Eating and drinking cafe 28 13%
Service 32 15%
Unknown 7 3%
Total 208 100%
14
Table 2-3. Business years of shops in the old shopping street
For the area of each shop, as shown in Table 2-4, 76% shops are smaller than 98 m2. In addition, 51% shops are using the building together with home.
Table 2-4. Area of shops in the old shopping street
Shop area Number of answer %
32 m2 50 24%
33~65 m2 73 35%
66~98 m2 35 17%
99~131 m2 6 3%
132~164 m2 8 4%
165~329 m2 13 6%
More than 329 m2 11 5%
Others 3 1%
Unknown 9 4%
Years (Y) Unknown Y<
3 3≤Y
< 5 5≤Y
<10 10≤Y
<20
20≤Y
<30
30≤Y
<40
40≤Y
<50 Y≧
50 Number
of answer
4 6 8 8 18 27 19 17 101
% 1.9 2.9 3.8 3.8 8.7 13.0 9.1 8.2 48.6
15
For the number of employees of each shop, as shown in Table 2-5, about half of the shops have run by family only.
Table 2-5. Number of employees of shops in the old shopping street Number of employees Number of answer %
Family only 93 45%
less than 2 44 21%
3 to 5 35 17%
6 to 10 23 11%
More than 10 11 5%
Unknown 2 1%
For the age of storekeepers, as shown in Table 2-6, about half of the shop storekeepers are more than 60 year old, the normal age of retirement in Japan.
16
Table 2-6. Age of shop storekeepers in the old shopping street Age of storekeepers Number of answer %
20's 2 1%
30's 23 11%
40's 19 9%
50's 58 28%
60’s 59 28%
70's or above 44 21%
Unknown 3 1%
For successor, only 16% give a positive answer as shown in Table 2-7.
Table 2-7. Whether have successor as storekeeper
Whether have successor? Number of answer %
Yes 34 16%
Yes, but do not know whether to be successor 59 28%
No 74 36%
Unknown 41 20%
2.3.2. The Financial Condition of Shops
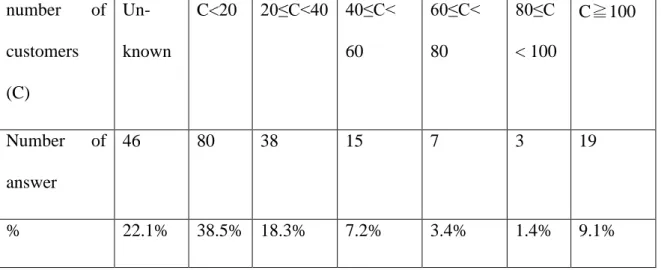
First, in order to investigate business conditions of the shops, I set a question about the number of purchase customers per day for the last week at the investigation time. As
17
shown in Table 2-8, about 40% shops had less than 20 customers.
Table 2-8. Number of Purchase Customers per Day for the Last Week
About income, number of customers and profit, as shown in Table 3, compare with 3 years ago, less than 10% shops grow and more than 70% shops reduced. That is to say, the business condition is becoming worse.
number of customers (C)
Un- known
C<20 20≤C<40 40≤C<
60
60≤C<
80
80≤C
< 100
C≧100
Number of answer
46 80 38 15 7 3 19
% 22.1% 38.5% 18.3% 7.2% 3.4% 1.4% 9.1%
18
Table 2-9. Income, number of customers and profit compare with 3 years ago
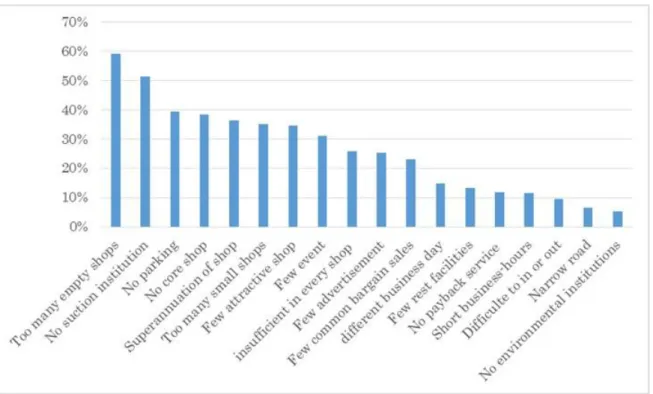
2.3.3. Problems of Old Shopping Street
About the problem of the old shopping street, I list up all the problems conceivable in the questionnaire and ask the storekeeper to multiple select all the problems they thought.
As shown in Figure 2-1, many problems, such as too many empty shops, no suction institution, no parking, etc. exist.
Growth by or more than 10%
Growth less than 10%
No Change
Reduce less than 10%
Reduce by or more than 10%
Unknown
Income 10 8 24 38 119 9
5% 4% 12% 18% 57% 4%
number of customers
9 9 32 45 100 13
4% 4% 15% 22% 48% 6%
Profits 5 10 28 39 114 12
2% 5% 13% 19% 55% 6%
19
Figure 2-1. Problems Selected by Storekeepers
2.4. Discussion
From the result above, it was found that many shops have long histories and run by the family only. Many shops are small-scale and using the building together with home. In addition, the decrease in income and number of customers, the aging of storekeepers and absence of successor become serious problems for the storekeepers.
As the problems of the old shopping street, too many empty shops, no suction institution and no parking etc. are given.
20
Chapter 3. Questionnaire Survey on Citizens of Kiryu City
3.1. Introduction
Getting to know the shopping behavior of the customs and how the old shopping street is evaluated by them are also very important for grasp the condition of it and further for developing the compact city Kiryu. Therefore, the questionnaire surveys on citizens of Kiryu city was administered as part of the JST Project.
In this study, I conducted big-scale-questionnaire surveys of citizens of Kiryu city as consumers and analyzed the data, using R [6]: a free software programming language and software environment for statistical computing and graphics. Then the evaluation to the Shops in the old shopping street, Supermarket and Mall from viewpoint of goods, traffic, and pleasure and so on by the customs were achieved. In addition, I compared the thought on the old shopping street by both the citizens and the storekeepers and grasped some problems of the old shopping street.
3.2. Method
Another big-scale-questionnaire surveys I conducted is on the citizens of Kiryu city in November 2012 to get to known the shopping activity of them. This questionnaire were sent to 10,000 householders whom are random sampled from a total 49,411 householders of Kiryu and returned 2,963 ones; it means about 6% of the total or the 29.63% of the sample. The survey’s content is as follows:
Q1: The name of the stations of bus or train to be used (not included in this study)
Q2: The personality of the answer, such as the sex, age, address, traffic means (bicycle, car, train, on foot, etc.) and whether own license.
Q3: Where and how many times to do the shopping during one month, activities done in
21
the store, such as foods, clothes, daily goods, window-shopping, etc. and the traffic means used.
Q4: The points to choose or not to choose the store.
Q5: Awareness of the activities of our project (not included in this study).
Q6: Frequency of going to the city center street in one month.
Q7: The opinion regard to city and public transport (not included in this study).
3.3. Results
There are seven questions in this questionnaire survey. Questions 2 to 4 and 6 will be discussed here for the relation to the problems to deal with. Other questions were analyzed by Seki [5].
3.3.1. Statistics on Characteristics of Respondents
Question 2 related to age, gender, licensing presence of their families and the respondents themselves and the result is shown below. As shown in Table 3-1, 1,665 male and 1,043 female answered the questionnaire survey. There is the possibility that the wife answered using the name of the householder, so the analysis according to sex will not be conducted in this study for the lack of reliability.
About the age, it is 1,421 the old, 1,056 middle aged and 253 the young. Most persons own license regardless of sex and age, especially for the middle age. There are less young persons in Kiryu city and the questionnaire survey is conducted every householder unit, so less young person in respondent is reasonable.
22
Table 3-1. Age, sex, licensing presence of the respondent
The young Middle-age The old Unknown Total
Teens Twenties Thirties Forties Fifties Sixties Seventies Eighties
Sex Male 3 17 119 220 375 524 376 8 23 1665
Female 6 23 76 211 237 305 172 3 10 1043
Unknown 0 2 6 5 8 15 19 0 201 256
Car License
own 3 36 196 421 597 767 428 8 38 2494
Not own 6 6 4 7 13 52 111 3 3 205
Unknown 0 0 2 8 10 27 25 0 193 265
% 33.3% 85.7% 97.0% 96.6% 96.3% 90.7% 75.9% 72.7% 16.2% 84.1%
Total 9 42 202 436 620 846 564 11 234 2964
23
As shown in Table 3-2, 993 persons living in Across river, 841 persons living in Old Town, 676 persons living in New Town and 453 persons living in Detached area answered the questionnaire survey.
Table 3-2. Living area of the respondent
About 6% family answered the questionnaire survey and there is no clear deviation in age or region as mentioned above, so it is thought that Kiryu citizens' general shopping situation can be grasped almost correctly with this survey data.
3.3.2. Statistics about Shopping Behavior
In this survey, I asked about shopping to the main person who usually goes to shopping in his/her home. Question 3 is the main part of the question in which about where respondents were shopping during the month before the questionnaire survey. At the first, respondents were asked to write the frequency of shopping in every individual shop, next, to check all propose to visit the shop. In the answer sheet, I illustrate vertically stores’
name of shops, and illustrate horizontally shopping activities done in the store, such as foods, clothes, daily goods, window-shopping, etc. Respondents check the corresponding cells. It is difficult to ask all of the stores located in Kiryu city, so I limited alternatives in the questionnaire to the representative shopping places in Kiryu city, and they classified in three kinds: Shops in The old shopping street, Supermarket and Mall. In addition, means to go to the shopping, such as bicycle, car, walk were investigated for each shop. Number of total times of visiting every shop and Experience of visiting every shop are shown
Old town New town Across river Detached area Total
Answers 841 676 993 453 2963
% 28.4% 22.8% 33.5% 15.3% 100.0%
24
separately by visiting purpose in Figure 3-1 and 3-2 respect as a bar graph. The horizontal axis of bar graph shows propose and total times of all respondent who visiting that shop.
The vertical axis of bar graph shows the ratio of visiting an individual shop to all shops. As shown in Figure 3-1 and 3-2, for propose of visiting shops, food and daily commodities is obviously greater in number for Supermarket. Different to Supermarket, Shops in the old shopping street are used for multiple purposes.
Figure 3-1. Number of Total Times of Visiting Every Shop by Visiting Purpose
25
Figure 3-2. Experience of Visiting Every Shop by Visiting Purpose
For visiting means, as shown in Table 3-3, private cars were used basically. More specifically, 2/3 visitors used private cars and of about 1/3 used bicycle or on foot for Shops in the old shopping street, nearly 90% visitors used private cars for Supermarket and almost all of the visitors used private cars for Mall.
26
Table 3-3. Visiting means to stores
Figure 3-3 shown visiting rate between shopping places separated by the different ages.
It can be seen that the old using shops in shopping street more and Mall less than the other ages. For Mall, usage is very different and decreased in the order of the young, Middle-age and The Old.
On foot Bicycle Auto- bicycle
Car Bus Train Total
Shops in old shopping
street
982 1067 106 4673 124 88 7040
13.9% 15.2% 1.5% 66.4% 1.8% 1.3% 100.0%
Supermarket 2400 2325 650 36395 82 14 41866
5.7% 5.6% 1.6% 86.9% 0.2% 0.0% 100.0%
Mall 4 27 2 3058 4 16 3111
0.1% 0.9% 0.1% 98.3% 0.1% 0.5% 100.0%
27
Figure 3-3. Visiting Rate between Shopping Places by Different ages
Figure 3-4 shows visiting rate between shopping places separated by the four areas. It can be seen that for Supermarket, Mall and others, there are little difference among the four areas. However, for Shops in shopping street, usage is very different and decreased in the order of Old town, New town, Across river and detached area.
28
Figure 3-4. Visiting Rate between Shopping Places by Different Areas
3.3.3. Statistics about Shop Evaluation
In Question 4, respondent was asked to write ○ or ×for the three types of stores, which are Shops in old shopping street, Supermarket and Mall, about 25 points shown in Table 3- 4. The ○ means that the point is a good point makes the respondent choose the shop and the
× means the point is a bad point makes the respondent do not choose the shop.
First, total number of both ○and × was counted and calculated as point rate to find which point is considered for decide the shopping place. As shown in table 7, “variety of goods”, “parking” and “all can bought in one place” are the most important points for decision. “Cheap”, “easy to find goods”, “near”, “having place for rest and meal” and
“Good atmosphere” are the points followed.
Then, average number of point in each evaluate object [(the number of ○) - (the
29
number of ×)] for those three stores are shown at the right side of Table 7. Average number of point in “parking”, “all can bought in one place” and “variety of goods” for Shops in the old shopping street are low. “Cheap”, “long business-hour”, “having place for children”,
“having place for rest and meal” and “attractive advertising” are low also. On the other hand, “parking”, “cheap”, “variety of goods” and “all can be bought in one place” of Supermarket are high. It is similar of Mall to Supermarket and “Having favorite goods”,
“good atmosphere”, “having place for rest and meal” are also evaluated highly but “Near”
and “intimacy” are not good.
Table 3-4. Point rate and average number of points of all that selected by respondent
shops in Old Shopping Street
Super-
market Mall
Variety of goods 0.350 -0.181 0.384 0.389
Easy to find goods 0.217 -0.006 0.096 0.114
All can be bought in one place 0.338 -0.203 0.347 0.380
Having favorite goods 0.202 -0.040 0.039 0.257
Fresh and good sense 0.177 -0.016 0.077 0.167
Cheap 0.258 -0.109 0.462 0.063
Good atmosphere 0.212 -0.024 0.057 0.332
Intimacy 0.113 0.098 0.014 -0.040
Famous 0.108 -0.010 0.039 0.092
Individuality 0.101 0.038 0.001 0.036
Good service attitude 0.118 0.028 0.045 0.080
Product knowledge of clerk 0.089 0.023 0.004 0.036
After-sales service 0.079 0.023 0.001 0.001
Delivery 0.068 -0.013 0.001 -0.010
Long-opening Hours 0.185 -0.088 0.239 0.151
Near 0.218 0.050 0.323 -0.077
Parking 0.352 -0.218 0.407 0.317
Convenient of bus 0.080 -0.030 -0.012 -0.036
Having place for children 0.107 -0.076 0.014 0.125
Convenient of public facility 0.070 -0.025 -0.004 -0.011
Convenient of ATM 0.130 -0.019 0.106 0.104
Having place for rest and meal 0.214 -0.059 0.061 0.380
Attractive advertising 0.130 -0.055 0.132 0.086
Attractive event 0.086 -0.033 -0.007 0.069
Payback 0.106 -0.029 0.063 -0.010
Traffic
Pleasure
Adv.
Evaluate objects
Average number of point Point
rate
Goods
Shop
30
In addition, regional differences of the evaluation are shown in Table 3-5. Distance to store is regard importantly by the respondents living in New town and Old town but reverse by those living in Across river and Detached area. The reason of it can be thought as the difference in means of transportation. In addition, “long-business-hour” is not regarded so important by those living in detached area. Those living in all the area except old town regard pleasure important.
In addition, as shown in table 3-5, it can be seen that the Shops in the old shopping street is evaluated highly by those living in old town but reverse by those living in detached area. In addition, the mall is evaluated highly by those living in across river but reverse by those living in old town.
Age differences of the evaluation are shown in table 3-6. First, for the young, it can be seen that they give more points than the other ages, especially on goods, having place for children, Long-opening hours and having place for rest and meal. The young give more negative to the old shopping street, although Individuality, Good service attitude and Product knowledge of clerk were evaluated positively. In addition, the young give positive evaluation about Price, Long-opening hours and Near to Supermarket and about Goods, Good atmosphere, having place for children, having place for rest or meal and Long- opening hours to Mall. On the other hand, middle age and the old gave an evaluation of the inverse of the young generally.
31
Table 3-5. Average number of points separated by different area
(*shops in OSS means Shops in old shopping street in the table above)
32
Table 3-6. Average points separated by different ages
Point rate
shops in OSS
Super-
marketMall Point rate
shops in OSS
Super-
market Mall Point rate
shops in OSS
Super- market Mall Variety of goods
Easy to find goods
All can be bought in one place Having favorate goods Fresh and good sense Cheap
Good atmospher Intimacy
Famous Individuality
Good service attitude Product knowledge of clerk After-sales service
Delivery
Long-opening Hours Near
Parking
Convenient of bus Having place for children Convenient of public facility Convenient of ATM
Having place for rest and meal Attractive advertising
Attractive event Payback Goods
Shop
Traffic
Pleasure
Adv.
Living area The Young ( <40 ) Middle-age ( 40 to 59 ) The Old ( >59 ) Evaluate
objects
33
Evaluation on each item, which is goods, shop, traffic, pleasure and advertisement, to Shops in the old shopping street by different categories are summarized in Figure 3-5 and Figure 3-6. They are calculated by using the following formula to balance the different number of question in every item.
Evaluation on each item = Total evaluation of all questions in the item / number of question in the item
As shown in Figure 3-5, evaluations to Shops in the old shopping street by those who have visiting or no visiting experience in this one month are very different. However, it is difficult to clarify the relevance between the evaluations and the visiting only by this data for which one is the reason and which one is the result are unknown.
Figure 3-5. Evaluation to Shops in The Old Shopping Street by Different Areas
As shown in Figure 3-6, evaluations to Shops in the old shopping street by different residential areas are very different and they decreased in the order of Old town, New town,
34
Across river and Detached area.
Figure 3-6. Evaluation to Shops in The Old Shopping Street by Different Areas
For the frequency of going to the city center street in one month, I analyzed it by different area and different ages. As shown in table 3-7, the farther people live, the less visiting was found. Especially for the Detached area, 36% people have no experience of visiting the old shopping street in this one month. In addition, as shown in Table 3-8, there is no significant difference for the visiting to the old shopping street among the different ages
35
Table 3-7. Frequency of going to the city center street in one month by different areas
Table 3-8. Frequency of going to the city center street in one month by different ages
3.4. Discussion
In my study, I investigated not only Action step, the final step in the AIDA steps [4], but also the previous steps that show the processes to the action. As a result, I grasp the condition of the old shopping street and found some of the problems of it based on the results of the two questionnaire surveys mentioned above. Consequently, I suggest below for improving two problems of them.
First, as indicated by the result above, shortage of goods verities and cannot buy all in
Whole city
Old town
New town
Across river
Detached area
Whole city
Old town
New town
Across river
Detached area Nearly Everyday
4 or 5 times per week 2 or 3 times per week Several Times About 1 time None Living there No Answer Total
The Young
Middle- age
The Old
The Young
Middle-
age The Old
Nearly Everyday 4 or 5 times per week 2 or 3 times per week Several Times About 1 time None Living there No Answer Total
36
one shop are mentioned as problems by both the customers and the storekeepers in the old shopping street. Therefore, potential customers think to have to move among the shops in the old shopping street to get all goods they needs. So frequent parking include in and out is necessary since car is used most widely as a means to stores. On the other hand, they assess parking to be very difficult. Storekeepers mention too parking difficulty and narrow road as problems of the old shopping street. It can be thought that moving among shops in the old shopping street is inconvenience for customers. That is to say, moving among the shops is necessary in the old shopping street, this inconvenience prevent the visiting.
In order to improve the problem above, direct measures are making a block on which existing every individual shop and stores lacking the street are concentrated, and making parking easier to in and out. However, as mentioned above in the survey of storekeepers, the business condition is not so good so it can be thought that these direct measures are difficult to realize. Therefore, it is necessary to deal with the problems in other view.
Therefore, I propose to create a move means among the shops in the old shopping street to deal with the inconvenience to increase the visiting rate. Transit mall is a one of the solution; however, it was difficult because it needed large investment. Accordingly, EV bus (FIG. 3-7) developed by the present project was considered. It is easy to get on and off for its low floor and full of spaciousness for without door and window glass. It can be thought that it can be used easier for the old, children and customers with heavy shopping- goods and can improve the charm of Old town. Now, examination service of the EV bus began, and the service is being evaluated.
37
Figure 3-7. EV bus
Second, as indicated by the result above, evaluation on the old shopping street is very different by the four areas and decreased in the order of Old town, New town, Across river and Detached area. For some items, such as traffic, evaluated different by residents in different living area is reasonable. As to other items, such as goods, shop and pleasure, it is not reasonable. I found that the usage of the old shopping street also decreased in the order of Old town, New town, Across river and Detached area. That is to say, the more usage of the old shopping street, the higher evaluation it receives. Then, it can be say that the charm of the old shopping street is not known by those who seldom using it.
In order to improve the problem above, it is necessary to find a good way to make the charm of the old shopping street to be known by those seldom using it. Therefore, an experiment about information transmission conducted by us will be described in the next Chapter.
38
Chapter 4. Experiment on a WOM Network
4.1. Introduction
As mentioned in Chapter 3, the old shopping street has lost its bustle and there are a lot of problem in it. In order to activate the shopping streets, I am trying to find an effective method of disseminating information to citizens to make them recognize the charm of the shopping streets. Also as mentioned in Chapter 2, most storekeepers and their customers are aging. On the other hand, I also found that there are about 7000 high school students and about 3000 university students in Kiryu City. It means that many teenagers who are free in the daytime are in Kiryu City. Therefore, effective information dissemination for both elders and teenagers should be found. Though the internet is popular in the society of today, I believe that face-to-face WOM, the traditional way of disseminating information, will be more effective in this case, in which elders and teenagers are the key persons in the community. Therefore, in this research, I examine the capability of the WOM network.
The purpose of my research is to evaluate the effect of WOM in relation to the graph structure of a WOM network. First, I evaluate the relationship between the behavioral tendency of the members of the network and the WOM graph structure. Next, I evaluate the spread of new information based on the WOM graph structure. WOM about meal in a student community will be examined in this research. The reason of choosing student as the subject of this experiment is that the student has clear affiliation and easy to examine and control. In addition, the reason of choosing meal as the topic of WOM is that it is concerned by most students and the talking about it is existing actually so it is easier to grasp. The result of this experiment will be used as preliminary data for the activation of the shopping streets of Kiryu City.
39
4.1.1. Related Research
Problems concerning interpersonal relationship networks are addressed in many fields such as informatics, sociology, psychology, business administration, and economics from different viewpoints. I introduce related studies in the following two areas: interpersonal relationship networks and WOM marketing, which is an effect of those networks.
4.1.1.1. Interpersonal Relationship Network in Informatics
Research that analyzes social networks has been conducted for a long time, for example, the famous Small World study by Milgram [7]. Adamic, L. A. et al. [8] devised techniques and tools to mine internet information in two data sets and extracted social networks and the exogenous factors underlying the networks’ structure. This study found that some factors are better indicators of social connections than others are, and that these indicators vary between user populations. Recently, Wu [9] studied several longstanding questions in media communications research, in the context of the microblogging service Twitter, regarding the production, flow, and consumption of information. Matsuo et al. [10]
researched the extract method of the relationship between researchers by using a search engine based on the web information. Yasuda et al. [11] researched constructing, changing process and structure of a research’s network that was obtained by web mining within a period of four years. Yuda et al. [12] analyzed network structure at the time of 2005 of mixi, the biggest Social Network Service in Japan.
Instead of the real relationship of people, the web data that was automatically left the log was used by most of those researches. In addition, most of those researches focus on the network itself but put the relation to the people’s activity away.In this study, we focus on the people’s activity and WOM network.
4.1.1.2. WOM Marketing
In the field of marketing, WOM is examined chiefly in comparison with the mass
40
media influence on an individual’s decision-making. Rogers [13] compares advertisement to WOM, and shows that the former has a great influence on an individual at the information- gathering stage but the latter has a big influence at the decision-making stage. Herr et al. [14]
investigated the effects of WOM communications and specific attribute information on product evaluations and found that a face-to-face WOM communication was more persuasive than a printed format but the effect was reduced or eliminated when a prior impression of the target brand was available from memory or when extremely negative attribute information was presented.
4.1.2. The Meaning of WOM Network in This study
WOM was defined by Arndt [15] as oral person-to-person communication between a receiver and a communicator whom the receiver perceives as noncommercial, concerning a brand, product, or service. Brown et al.[16] added that “the communicator and the receiver have a social tie.”
In this study, I use the definition of WOM mentioned above. It can be expected that the networks differ depending on the topic of the WOM. Therefore, as the social tie of the communicator and the receiver, I use the existence of conversation concerning meals in daily life as a WOM network. I investigate how information about the shopping streets spreads on this network. In this study, I check just two points. The first point is whether communicators and receivers are interested in the topic. The second point is whether each constituent of the community has a chance to have conversations exchanging information concerning the topic. Meals are a topic of concern for all students, so the network satisfies both these points. Furthermore, the network about meals can be expected to function as a WOM network concerning the shopping streets.
4.1.3. The Hypothesis to be Examined
In this study, I survey the network of interpersonal relationships that exists in the real
41
community, analyze its structure, and investigate its relation to the behavioral tendency of the constituent members. As a result, I examine the utility of WOM as an information dissemination method to activate the shopping streets. Concretely, a questionnaire survey was designed to examine the following hypothesis: First, there is a strong relationship between the structure of a WOM network and similarity of the members’ behavior concerning the topic of the network. Second, when new information is acquired by some members of the network, it will spread in the network. The usability of WOM as an information dissemination method for shopping streets activation is evaluated by assessing the degree of information spreading in a WOM network of a student community.
4.2. Method
4.2.1. The Questionnaire Survey
Questionnaire surveys with the same content were administered to 189 junior students at the Department of Computer Science (henceforth C1) and the Department of Mechanical System Engineering (henceforth C2) of Gunma University two times, in April and July. I selected junior students as the investigation object because the groups of students are clear and easy to study. Moreover, steady interpersonal relationship networks are expected for these communities because the students have been in the same department for two years.
The analysis was based on the students whose answers were effective in both investigations, and the sample size is 53 for C1 and 58 for C2. The data of C1from the first and second investigations are abbreviated as C11 and C12, respectively. The data of C2from the first and second investigations are abbreviated as C21 and C22, respectively.
The survey carried a signature, and its content is as follows:
1) Eating style at the university in the daytime.
2) The names of other students that the student talked with or emailed about which
42
restaurant to go to for meals, excluding drinking parties, in the preceding week.
3) The name of the restaurant that became the topic.
4) Living conditions, such as where the student’s home is and whether he or she has a car.
5) Whether does he or she recognize the restaurant Basho (Basho is a European-food restaurant with a long history. It is an unobtrusive presence for the locals because it is in an alley in the city centre. But it became a topic nationwide when a wall painting by Shiko Munakata, a famous painter in Japan, was foundhidden in the wall several years ago. Yet, local young people are not aware of the restaurant although customers come from far away.
Also, it is not a good choice for lunch for university students because its distance from the university is more than 1 kilometer.).
After the first investigation, information about the restaurant Basho was given in a lecture to some of the investigated students of C1. Then, the appearance of the spread of the information was observed in the second investigation (Figure 4-1).
Figure 4-1. Method of Research
43
4.2.2. The Definition of the Graph Structure of a WOM Network
In this study, I represent a WOM network, using graph theory (for example, Jonathan Gross et al.[17]), as a directed graph whose vertices are persons, and a directed edge from vertex A to vertex B means that person A talked to person B. I define adjacent level for a pair of vertices in order to indicate the level of information sharing between a pair in the WOM network. Adjacent level of vertices A and B is defined as the minimum length of paths from A to B or reverse. If there are no such paths, the adjacent level is defined as ∞.
An n-path graph is defined as a graph in which all vertices pairs of adjacent level n or less are connected (Figure 4-2). An n-path graph of a mutually connected graph becomes a complete graph for a large enough n. If a subset of vertices and their edges becomes a clique—a subgraph that becomes a complete graph—these persons possibly share all the information in n conversations or less. As an index of the information sharing ease of a WOM network, I define the n-density of a network as the ratio of the number of edges in an n-path graph to the number of edges in a complete graph that has the same vertices as the original graph. The n-path graph of a graph G is sometimes referred to as n-th power of G. Furthermore, I define transitivity and reciprocality as the auxiliary indexes of a directed network. The former is defined as the ratio of the number of shortcut edges to the number of pairs of vertices that have a path of length 2. It means the ratio of the relations “a friend of a friend is a friend.” The latter is defined as the ratio of the number of reciprocal pairs of vertices to the number of connected pairs. It means the ratio of relations “a friend thinks of me as a friend.” That is to say, the allowable conversation frequency means the quality of the information sharing relation.
44
Figure 4-2. n-path graph
4.3. Results
4.3.1. The Result of WOM Network
4.3.1.1. Characteristics of the WOM Network Graph
WOM networks concerning meals in each department were identified by the two investigations (Figures 4-3 to 4-6), and the characteristics of them are summarized in Table 4-1 and Table 4-2. I found that all of the 1-densities of the four networks are about 0.06 when I consider the graphs as directed graphs. There are more large cliques (size of 7) and more isolated students in C1 than C2. Moreover, C1 has high transitivity and high reciprocality. The students in C1 divide into several groups that are highly independent of each other and are intimate in the group. Thus, C1 has a higher transitivity than C2, considered as an undirected graph. The reason for the difference between the two departments can be thought as a result of the different types of study. The students of C1
have more one-person jobs, such as programming, and discussion, if it exists, is limited to the one-to-one type. However, the students of C2are assigned more experiment practice, and they need to collaborate with different students. Therefore, various interpersonal relationships are composed and a uniform network is established.
45
Figure 4-3. Network of C11
46
Figure 4-4. Network of C12 (G1–G4 are 4 cliques)
47
Figure 4-5. Network of C21
48
Figure 4-6. Network of C22
Table 4-1. Basic character of networks Verti
ces
Indexes as directed graph Indexes as undirected graph Edges Density Transitiv
ity
Reciproca- lity
Edges Density Transitivity
C11 53 177 0.064 0.713 0.566 113 0.082 0.627 C12 53 163 0.059 0.746 0.630 100 0.073 0.651 C21 58 192 0.058 0.617 0.524 126 0.076 0.557
C22 58 200 0.06 0.529 0.449 138 0.083 0.423
49
Table 4-2. Large cliques and unconnected vertices
* Cliques are enumerated exclusively from the larger one to the small one.
Exclusive large cliques* Unconnected sub-graph from the maximum connected sub-graph Clique size Included
vertices
% Sub-graph size Fewer than 3 vertices Medium size
7 6 5 4 12 5 4 3 2 1 Included
vertices
% Included vertices
%
C11 1 1 1 2 26 49.1% 1 1 1 7 9 17.0% 18 34.0%
C12 1 2 1 24 45.3% 1 7 9 17.0% 20 37.7%
C21 1 1 2 2 31 53.4% 1 1 6 8 13.8% 19 32.8%
C22 2 4 28 48.3% 1 1 4 6.9% 26 44.8%
50
On the other hand, the number of isolated students decreases in the second investigation, compared with the first one. It seems the students who were isolated at the beginning of the semester became related to a group as time went by.
4.3.1.2. n-density of WOM Networks
The n-densities of both WOM networks are shown in Figure 4-7, where the WOM networks are fixed by the second investigation. The horizontal axis of this figure is path length, which means conversation frequency, and the vertical axis is n-density. It can be found that the n-densities become saturated with 7 path lengths in C2 and 9 path lengths in C1, and the n-densities are 0.9 and 0.7 respectively. That is to say, the information can be disseminated to 90 percent and 70 percent, respectively, of constituent members. The figures are about 30 percent and 20 percent when I assume these networks are undirected networks.
Figure 4-7. Possibility of Information Transmission
51
I consider conversations symmetric among receivers and communicators, and I assume that a reverse edge could not be investigated if there is an edge. Therefore, in the following discussion, directed graphs will be treated as undirected graphs if there is no specification.
4.3.2. Relationship between WOM Network and Behavioral Tendency
Table 4-3 and Table 4-4 show the results for the method of taking a meal. Main methods for lunch are using the refectory, purchasing a lunch box, and cooking in both C1
and C2. However, for dinner, most students of C1cook by themselves, but there are a variety of methods in C2, even though cooking is the main method.
Table 4-3. Method for lunch (%)
Table 4-4. Method for dinner (%) Cooking
Purchasing lunch box
Using refectory
Eating at a restaurant
Eating nothing
Other
C1 23.6 26.4 43.4 3.4 1.9 1.3
C2 18.9 33.5 44.2 0.9 2.5 0.0
Average 21.3 30.0 43.8 2.2 2.2 0.7
Cooking
Purchasing lunch box
Using refectory
Using at a restaurant
Eating nothing
Other
C1 76.2 3.2 4.7 11.9 2.5 1.5
C2 53.6 12.2 18.7 12.4 2.2 0.9
Average 64.9 7.7 11.7 12.2 2.4 1.2
52
4.3.2.1. Relationship between WOM Network and Meal Characteristics
Principal component analysis of the ratio of the methods of taking a meal was conducted based on the second investigation. Figure 4-8 shows an individual factor score scatter plot. Most members of the same clique, indicated by the same mark, have positions in the same quadrant in this figure. That shows a tendency for the persons to have the same eating style. This configuration may indicate that students who have a similar eating style composed the clique on a WOM network, or it may indicate that some intimate members have a high possibility of taking a meal together and so their eating styles became nearly the same. It was clarified that a strong relationship existed between the WOM network concerning meals and similarities in the behavior of taking a meal.
53
Figure 4-8. Factor scores of the two department’s students methods of taking a meal Note: ▲is G1, ■ is G2, ● is G3, ◆ is G4, ▼ is G5, × is G6, and · is the others of Figure 4-5.The 1st, 2nd, and 3rd principal components are lunch box, cooking, and restaurant, respectively.
![Figure 1-3. Action of Shopping Street WG [1]](https://thumb-ap.123doks.com/thumbv2/123deta/6237868.1092233/14.1262.225.1024.109.680/figure-action-shopping-street-wg.webp)
![Figure 1-4. Area Divided in Kiryu City [5]](https://thumb-ap.123doks.com/thumbv2/123deta/6237868.1092233/17.892.127.776.103.617/figure-area-divided-kiryu-city.webp)
![Figure 1-5. Population Pyramid of Kiryu City [5]](https://thumb-ap.123doks.com/thumbv2/123deta/6237868.1092233/18.892.193.725.110.402/figure-population-pyramid-kiryu-city.webp)