Contents lists available atScienceDirect
BBA - Bioenergetics
journal homepage:www.elsevier.com/locate/bbabio
Spectral tuning of light-harvesting complex II in the siphonous alga Bryopsis
corticulans and its effect on energy transfer dynamics
Parveen Akhtar
a,c, Paweł J. Nowakowski
b, Wenda Wang
d, Thanh Nhut Do
b, Songhao Zhao
d,
Giuliano Siligardi
e, Győző Garab
a,f, Jian-Ren Shen
d,g, Howe-Siang Tan
b,⁎, Petar H. Lambrev
a,⁎ aBiological Research Centre, Szeged, HungarybDivision of Chemistry and Biological Chemistry, School of Physical and Mathematical Sciences, Nanyang Technological University, Singapore cELI-ALPS, ELI Nonprofit Ltd., Szeged, Hungary
dPhotosynthesis Research Centre, Chinese Academy of Sciences, Beijing, China
eDiamond Light Source Ltd., Harwell Science and Innovation Campus, Didcot, Oxfordshire OX11 0DE, UK fDepartment of Physics, Faculty of Science, University of Ostrava, Czech Republic
gResearch Institute for Interdisciplinary Science, Graduate School of Natural Science and Technology, Okayama University, Okayama, Japan
A R T I C L E I N F O Keywords: Circular dichroism Light-harvesting complexes Marine algae Photosynthesis Time-resolved spectroscopy Two-dimensional spectroscopy A B S T R A C T
Light-harvesting complex II (LHCII) from the marine green macroalga Bryopsis corticulans is spectroscopically characterized to understand the structural and functional changes resulting from adaptation to intertidal en-vironment. LHCII is homologous to its counterpart in land plants but has a different carotenoid and chlorophyll (Chl) composition. This is reflected in the steady-state absorption, fluorescence, linear dichroism, circular di-chroism and anisotropic circular didi-chroism spectra. Time-resolved fluorescence and two-dimensional electronic spectroscopy were used to investigate the consequences of this adaptive change in the pigment composition on the excited-state dynamics. The complex contains additional Chl b spectral forms – absorbing at around 650 nm and 658 nm – and lacks the red-most Chl a forms compared with higher-plant LHCII. Similar to plant LHCII, energy transfer between Chls occurs on timescales from under hundred fs (mainly from Chl b to Chl a) to several picoseconds (mainly between Chl a pools). However, the presence of long-lived, weakly coupled Chl b and Chl a states leads to slower exciton equilibration in LHCII from B. corticulans. The finding demonstrates a trade-off between the enhanced absorption of blue-green light and the excitation migration time. However, the adaptive change does not result in a significant drop in the overall photochemical efficiency of Photosystem II. These results show that LHCII is a robust adaptable system whose spectral properties can be tuned to the environment for optimal light harvesting.
1. Introduction
Bryopsis corticulans (B. corticulans) is a marine green macroalga,
growing in the rocky intertidal shores in the form of a single-cell thallus with tubular filament siphons. Its photosynthetic apparatus, similar to other species in the order Bryopsidales, is adapted for optimal utilization of the predominant blue-green light available under water and may be modulated in response to fast changing light environments [1]. The spectral adaptation involves changes in the pigment composition of light-harvesting complex II (LHCII) – the membrane-intrinsic chlor-ophyll (Chl) a/b-binding peripheral antenna of Photosystem II (PSII). The peculiar structural and functional characteristics of the B.
corticu-lans antenna system make it a useful model to understand the design
principles of photosynthetic light harvesting and photoprotection [2,3].
At present, there is no crystallographic structure of LHCII from B.
corticulans and information about the molecular structure and pigment
composition is obtained from biochemical and spectroscopy analyses. Although B. corticulans is more distant to plants than other green algae such as well-studied Chlamydomonas reinhardtii, its Lhcbm apoprotein has >70% sequence identity with the major LHCII (Lhcb1–3) in higher plants and is expected to possess a similar structure with three trans-membrane α-helical regions [4–6]. Thus, the key sequences and re-sidues responsible for maintaining the structure and trimerization of LHCII are largely conserved in the syphonous green algae, as are all the carotenoid and Chl binding ligands. In spite of the high degree of homology, however, marked differences are found in the pigment composition. Instead of the xanthophylls lutein and violaxanthin pre-sent in higher plants, B. corticulans contains siphonaxanthin and
https://doi.org/10.1016/j.bbabio.2020.148191
Received 23 October 2019; Received in revised form 11 March 2020; Accepted 13 March 2020 ⁎Corresponding authors.
E-mail addresses:[email protected](H.-S. Tan),[email protected](P.H. Lambrev).
BBA - Bioenergetics 1861 (2020) 148191
Available online 20 March 2020
0005-2728/ © 2020 The Authors. Published by Elsevier B.V. This is an open access article under the CC BY license (http://creativecommons.org/licenses/BY/4.0/).
siphonein – unique keto-carotenoids [5–7] which are more reminiscent of the carotenoids found in the light-harvesting antenna complexes of red algae and diatoms. Siphonein and siphonaxanthin significantly enhance the absorption of green and blue-green light. The centrally located xanthophylls – normally luteins in LHCII of higher plants [8] – are essential for the folding and structural stabilization of the complex. The amino acid sequence of the Lhcbm proteins in B. corticulans is al-tered to accommodate the large hydroxyl group of siphonaxanthin and the large ester group of siphoneins [4–6].
The total number of Chls in LHCII of B. corticulans is the same as in plant LHCII – 14. However, instead of eight Chl a and six Chl b, LHCII of
B. corticulans binds six Chl a and eight Chl b [5]. In spite of the exchange of two Chls a to b, the amino acid ligands to the chlorin rings are the same in the two types of LHCII, suggesting that the ligand environment for Chl a and b is somewhat flexible. This is in agreement with in vitro reconstitution experiments showing that Chl a and b can occupy the same binding sites [9,10]. The higher Chl b/a ratio also contributes to the absorption of shorter-wavelength light in the region 600–660 nm [1].
Nakayama and coworkers [11,12] investigated the Chl spectral forms and the excitation energy transfer (EET) dynamics in LHCII of a related organism, B. maxima. Steady-state and time-resolved fluores-cence analysis revealed efficient EET from the carotenoids siphonein and siphonaxanthin to Chl a, whereas EET to Chl b was not observed. In contrast to LHCII from spinach, Chl b emission was detected in B.
maxima LHCII upon direct excitation in the Chl b region at low
tem-perature (77 K). The authors concluded that a fraction of Chl b, albeit small, is unable to transfer energy to Chl a at this temperature. This poses the question whether spectral adaptation in the algal LHCII comes at a price of compromising the efficiency of EET. One of the most potent techniques for resolving the dynamics of EET is two-dimensional elec-tronic spectroscopy (2DES), mapping the transient absorbance changes in femtoseconds to nanoseconds time range with simultaneous resolu-tion of the excitaresolu-tion (“pump”) and detecresolu-tion (“probe”) wavelength [13–15]. Circular dichroism (CD) and anisotropic CD (ACD) spectro-scopy have recently been proven useful for identifying the exciton states responsible for the spectral features and EET in plant LHCII [16]. Here we present a comprehensive spectroscopic characterization of LHCII isolated from B. corticulans, a green macroalga closely related with B. maxima, aimed at better understanding the consequences of the pigment composition changes, in comparison with higher-plant LHCII, on the photophysical properties of the antenna. Steady-state absorption, fluorescence, linear dichroism (LD), CD and ACD spectra showed that at least two Chl a sites in higher-plant LHCII are occupied by Chl b in B.
corticulans, decreasing the absorption at long wavelengths (674 and
679 nm) and increasing short-wavelength absorption (650 and 658 nm). Time-resolved fluorescence and 2DES showed that overall EET remains highly efficient despite the presence of relatively long-lived Chl b forms and slightly slower exciton equilibration dynamics in the Chl a domain of B. corticulans LHCII.
2. Materials and methods
2.1. Sample preparation
B. corticulans was collected from intertidal coastal areas around
Qingdao, China and LHCII was isolated and purified as described in [5]. Detergent-solubilized LHCII was embedded into native thylakoid lipid membranes according to the protocol of Akhtar et al. [17].
2.2. Absorption, LD, CD and ACD spectroscopy
Absorption and CD spectra in the range of 350–750 nm were re-corded at room temperature (RT) with a Thermo Evolution 500 spec-trophotometer and a Jasco J-815 spectropolarimeter, respectively. LHCII samples in solution were diluted in 20 mM Tricine buffer
(pH 7.8) with 0.03% n-dodecyl β-D-maltoside (β-DDM) to an absor-bance of one at the red maximum. Measurements were performed in a standard glass cell of 1-cm optical path length. Synchrotron-radiation (SR) CD spectra in the near and far UV region were measured at the B23 CD beamline of the Diamond synchrotron (UK). For SR CD measure-ments, the samples were placed in 0.2 mm fused silica cells.
LD and ACD spectra were recorded from reconstituted LHCII membranes macroscopically aligned by polyacrylamide gel compres-sion and by drying on a quartz surface under N2gas stream as described in Akhtar et al. [16]. ACD spectra were recorded in face-aligned or-ientation, with the measuring beam parallel to the membrane normal, and LD spectra were recorded in edge-aligned orientation (with the membrane plane parallel/perpendicular to the beam polarization).
2.3. Steady-state fluorescence spectroscopy
Fluorescence emission spectra at 77 K were recorded with a Fluorolog 3 double-monochromator spectrofluorometer (Horiba Jobin-Yvon, USA). 40 μl of LHCII solution with absorbance of 0.3 at the red maximum were evenly placed onto a Whatman GF/C glass microfiber filter and immersed in liquid nitrogen in a Dewar glass vessel. Spectra were recorded in the range of 600–800 nm with 436 nm and 475 nm excitation light and 5 nm excitation/emission spectral bandwidth and corrected for the spectral response of the detector. RT fluorescence spectra were recorded with a Jasco FP-8500 spectrofluorometer. The samples were diluted to absorbance of 0.01 at the red maximum and placed in a 1-cm quartz cell.
2.4. Time-resolved fluorescence
Fluorescence decays were measured at RT by time-correlated single-photon counting using a FluoTime 200/PicoHarp 300 instrument (Picoquant, Germany). The source of excitation was a Fianium WhiteLase Micro (NKT Photonics, UK) supercontinuum laser, providing white-light pulses at a repetition rate of 20 MHz. The samples were diluted to an absorbance of 0.03 at the excitation wavelength in a 1.5-mm pathlength flow cell and continuously circulated during the mea-surement to avoid repeated excitation of the same sample volume. The excitation wavelength was set to either 460 nm or 633 nm by passing the laser beam through an excitation monochromator and a band-pass filter and the pulse energy was adjusted to ~0.1 pJ. Fluorescence de-cays were recorded at wavelengths between 656 and 744 nm with 8 nm steps and binned in 4-ps time channels. The instrument response function (IRF) was measured using 1% Ludox (colloidal silica) as scattering medium. The IRF width was ~50 ps at the excitation wa-velength. The fluorescence decays were subjected to global multi-exponential lifetime analysis routine with IRF reconvolution to obtain lifetimes and decay-associated emission spectra (DAES) using MATLAB routines created in-house.
2.5. Two-dimensional electronic spectroscopy
Fourier-transform femtosecond 2DES was performed at 295 K (RT) and 77 K in a partially collinear “pump-probe” geometry using an ex-perimental setup described in [18]. Briefly, a two-pulse train of inter-action pulses (pump/excitation pulses) of 35 fs duration with con-trollable inter-pulse delay time and phase difference are obtained by passing the output of a non-collinear parametric amplifier (TOPAS, Light Conversion) through an acousto-optic programmable dispersive filter (AOPDF) pulse shaper (Dazzler, Fastlite). The spectra of the ex-citation pulses are centred at 670 nm, coinciding with the Chl a Qy
absorption band of LHCII (Supplementary Fig. S1). A white-light su-percontinuum pulse generated in a 2-mm sapphire window is used as the third interaction pulse (probe/detection) after compressing with a pair of chirped mirrors. The transient absorption of the probe is then measured along the λt axis. The cross-correlation width of the
excitation and probe pulses was 70 fs (FWHM) or less. The time delay τ between the two excitation pulses was scanned between 0 and 150 fs with 3-fs steps for RT measurements and between 0 and 378 fs with 6-fs steps for 77 K measurements. The 2D photon echo signals were re-corded by utilizing a 1 × 2 phase cycling scheme in a partially rotating frame of reference [19]. The probe pulse was plane-polarized at the magic angle (54.7°) with respect to the polarization of the excitation pulses. The signals (2D interferograms) were Fourier-transformed along τto obtain 2D electronic spectra in the frequency/wavelength domain (with excitation/detection wavelengths λτ/λt). The waiting time (Tw)
between the excitation and probe pulses was scanned from −100 fs to 100 ps in a quasilogarithmic progression. The excitation pulse energy was attenuated to 1–1.5 nJ, equivalent to ~2 × 10¹³photons/cm2/ pulse, to obtain maximal transient absorption signal of 1.5 and 2 mOD for RT and 77 K, respectively. The average number of excitations per LHCII trimer was approximately estimated to be 0.04–0.06.
For 2DES measurements at RT, the LHCII samples were diluted in degassed buffered medium (pH 7.8) containing 20 mM tricine and 0.03% β-DDM to absorbance of 0.3 at 675 nm (1 mm path length). The sample was continuously circulated during the measurement. For 77 K measurements the LHCII samples were diluted in degassed buffered medium (pH 7.8) containing 60% (v/v) glycerol, 20 mM tricine and 0.03% β-DDM. The suspension was placed in a cell between two sap-phire windows separated by a 0.5-mm Teflon spacer shielded with cryogenic grease to absorbance of 0.3 at 675 nm. Temperature was controlled by a liquid‑nitrogen-cooled vacuum cryostat (Janis) with BaF2windows.
3. Results
3.1. Absorption and fluorescence spectra
The absorption spectra of LHCII trimers isolated from B. corticulans solubilized with β-DDM are compared with LHCII isolated from pea (Pisum sativum) in Fig. 1. The RT absorption spectra have two char-acteristic peaks in the Soret region, at 437 nm and 475 nm, and two in the Chl Qyregion, 672 nm and 651 nm, primarily attributed to Chl a
and Chl b, respectively. The peak positions and their amplitudes slightly differ between B. corticulans and P. sativum owing to the different pig-ment composition of the two species. The positive peaks at 655 nm and 478 nm in the difference absorption spectrum testify to a higher Chl b content of B. corticulans, and, conversely, the negative peaks at 680 nm and 430 nm indicate lower Chl a content. The broad absorption band at 532 nm in B. corticulans is due to the carotenoids siphonein and si-phonaxanthin [5]. The absorption spectrum of B. corticulans LHCII at 77 K (Fig. 1b) contains two resolved peaks in the Chl b Qyregion – at
650 and 658 nm. The difference spectrum with P. sativum shows ne-gative peaks at 679 nm and 674 nm and positive peaks at 650 nm and
658 nm.
Fluorescence emission spectra of LHCII from B. corticulans and P.
sativum at RT and 77 K are shown inFig. 2. Reflecting the blue-shifted maximum in the absorption spectrum, the emission of B. corticulans is shifted by 2 nm to shorter wavelengths. The spectra also show higher emission from Chl b at RT – 16% relative fluorescence intensity at 655 nm, compared to 9% in the spectrum from P. sativum. There is virtually no Chl b emission at 77 K.
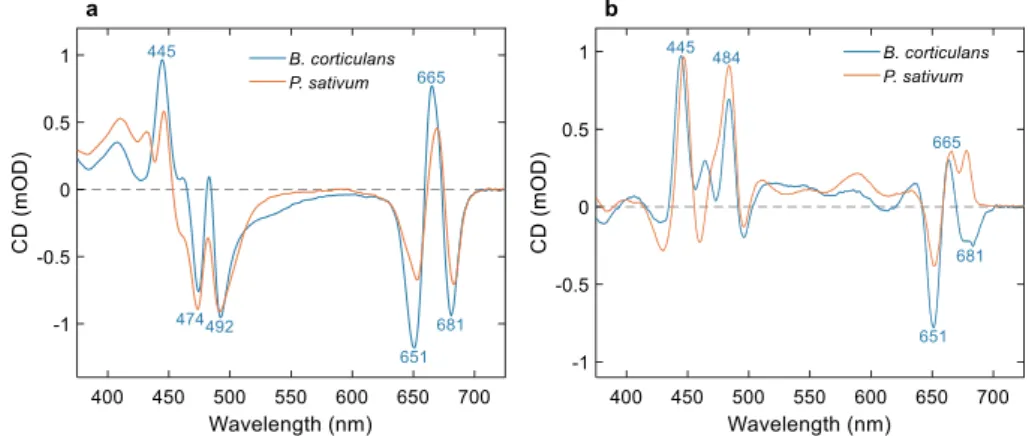
3.2. CD, ACD and LD spectra
The CD and ACD spectra of LHCII from B. corticulans measured in the visible wavelength region are shown inFig. 3. Note that for the measurement of ACD and LD spectra, the complex was embedded in reconstituted membranes. The CD spectrum of reconstituted LHCII membranes (Supplementary Fig. S2) is not significantly different from that of LHCII solubilized in β-DDM (Fig. 3a). In the red region, the CD spectrum is characterized by two negative (651 and 681 nm) and one positive band (665 nm) associated with the Qyexciton states of Chl b
and a. The CD in the Soret region is dominated by two negative bands (475 nm and 492 nm) and two positive bands (445 nm and 484 nm). B.
corticulans and higher-plant (P. sativum) LHCII share similar spectral
features, both in the ultraviolet and in the visible wavelength region (Supplementary Fig. S2). B. corticulans shows stronger CD in the Qy
band of Chl b, 651 nm, stronger positive CD bands at 445 nm and 484 nm and an additional negative CD band at 532 nm. The CD bands associated with Qy transitions of Chl a are blue-shifted compared to
higher-plant LHCII, in agreement with the blue-shifted absorption maximum.
The face-aligned ACD spectrum enhances excitonic CD bands wherein the electronic transition dipole moment is predominantly parallel to the membrane plane (Fig. 3b). The ACD spectrum has intense positive peaks at 445 nm and 484 nm – which is characteristic of higher-plant LHCII as well [16]. Further, bands at 586, 607 and 637 nm are clearly visible in the ACD spectrum but barely or not at all detect-able in the isotropic CD. On the other hand, the negative bands at 431 and 473 nm, observed in the CD spectra, are suppressed in the ACD spectrum, signifying that the associated transition dipole moments are close to perpendicular to the membrane plane. A notable difference between the ACD spectra of the algal and the higher-plant LHCII is that the positive band at 680 nm in the latter is not observed in B. corticulans – the red-most ACD band is negative in the algal spectrum (see Dis-cussion). On the other hand, B. corticulans shows an additional positive ACD band at 454 nm. ACD spectra were also recorded from uniaxially compressed gels in the face-aligned position as a control (Supplemen-tary Fig. S3). The spectra were virtually identical to the spectra of de-hydrated lipid films.
The major bands in the face-aligned ACD spectrum – at 445 and
Fig. 1. Absorption spectra of LHCII isolated from B. corticulans and P. sativum solubilized in 0.03% β-DDM at RT (a) and 77 K (b). The black curve shows the difference spectrum B. corticulans minus P. sativum.
484 nm – are correlated with positive peaks in the LD spectrum of edge-aligned LHCII membranes (Fig. 4), confirming that the contributing transition dipole moment is preferentially parallel to the membrane plane. Comparison with the LD spectrum of plant LHCII, highlights the additional chlorophyll b forms in B. corticulans.
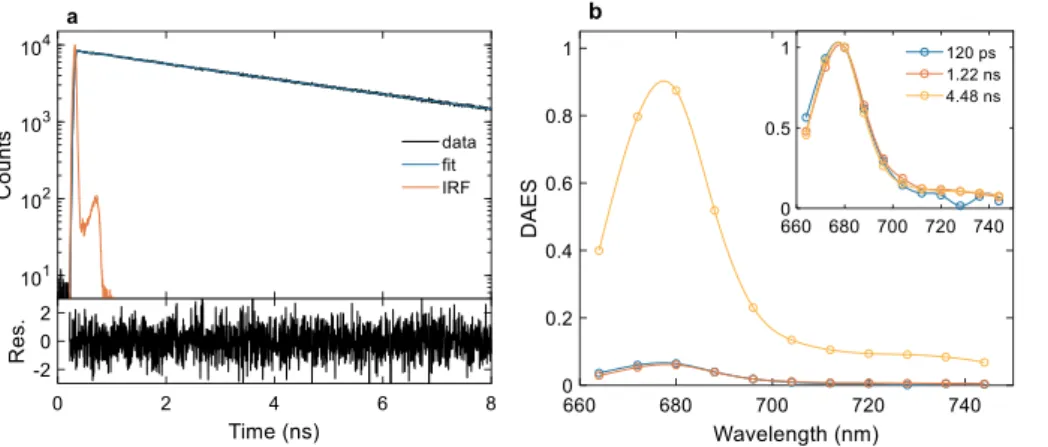
3.3. Time-resolved fluorescence
The fluorescence decay kinetics of LHCII of B. corticulans was re-corded by time-correlated single photon counting at several emission wavelengths (Fig. 5). Global multiexponential analysis of the decays at
emission wavelengths 664–744 nm required three decay lifetimes to fit the data (Supplementary Fig. S4) – a major lifetime of 4.5 ns, having 90% contribution, and two shorter lifetimes (120 ps and 1.2 ns). In-terestingly, this results in an average fluorescence lifetime of 4.0 ns – longer than higher-plant LHCII, which was found to be 3.5–3.6 ns, consistent with previous reports [20,21]. The decay-associated emis-sion spectra (DAES) are nearly identical for all three components (Fig. 5). It can be concluded that upon excitation at 633 nm (exciting both Chl a and b), EET is faster than the time resolution of the instru-ment (approx. 20 ps). The same conclusion can be drawn from an in-spection of the time-resolved spectra and the decay traces at different wavelengths (Supplementary Fig. S5). LHCII embedded in liposomes exhibits multiexponential kinetics with shorter decay lifetimes and the spectra show enhanced emission above 700 nm (Supplementary Fig. S6), similar to LHCII from higher plants [22]. In this case, global ana-lysis resolves an 80-ps lifetime component with a positive peak in the DAES at 680 nm and negative peak at ~700 nm. Therefore, the com-ponent likely represents the appearance (via EET) of states emitting in the far-red region that can be assigned to mixed exciton-charge-transfer states.
3.4. Two-dimensional electronic spectroscopy 3.4.1. Room temperature 2D electronic spectra
The 2D electronic spectrum is a correlation map of two frequencies or wavelengths for a given waiting time Tw. Generally, the negative
absorptive signal at excitation wavelength λτand detection wavelength λt(denoted λτ→ λt) is proportional to the population, at time Tw, of
states absorbing at λt, given that the initial excitation was at λτ.Fig. 6 shows RT 2D electronic spectra of detergent solubilized LHCII from B. Fig. 2. Fluorescence emission spectra of LHCII from B. corticulans and P. sativum at RT (a) and 77 K (b), with excitation at 475 nm. The spectra are normalized to the maximum emission.
Fig. 3. CD and ACD spectra of LHCII from B. corticulans and P. sativum (a) CD spectra of LHCII solubilized in 0.03% β-DDM and (b) ACD spectra of membranes oriented in dehydrated films. The spectra are plotted in units of ΔA × 10−3(mOD) and normalized to unity isotropic absorbance at 675 nm.
Fig. 4. LD spectra of LHCII from B. corticulans and P. sativum measured from membranes in a squeezed polyacrylamide gel in edge-aligned orientation. The spectra are normalized to unity isotropic absorbance at 675 nm.
corticulans recorded at several distinct Tw. The total spectral width
along the vertical axis (λτ) is determined by the overlap of the excita-tion pulse spectrum and the LHCII absorpexcita-tion spectrum (Supplementary Fig. S1). At early waiting times (Tw= 100 fs), the negative signal (from
ground-state bleaching and stimulated emission) is predominantly aligned along the diagonal, representing population of states directly excited by the pump pulse (Fig. 6a). Off-diagonal signals are also ob-served in the region λτ = 650–670 nm and λt = 660–680 nm, in-dicating very fast exciton relaxation among strongly coupled Chl do-mains. In the evolution of the 2D spectrum from 100 fs to 1 ps (Fig. 6a and b, respectively), the diagonal signal around 650 nm decays (by about 70%) while off-diagonal signals gain intensity.
The rapid decay of the 650-nm diagonal signal is shown by the time course inFig. 7. The 665-nm diagonal trace decays markedly slower while the off-diagonal signal from 650 nm to 665 nm reaches its maximum value in <300 fs and decays thereafter. The time traces and the 2D spectra clearly show significant remaining population of states at around 665–670 nm up to 5 ps. On the other hand, almost no po-pulation of states absorbing below 660 nm is detected at this time
Fig. 5. Time-resolved fluorescence spectroscopy of detergent solubilized LHCII of B. corticulans. (a) Fluorescence decay trace at 680 nm emission (black), three-exponential fit (blue), IRF (red) and weighted residuals (lower subplot). (b) Decay-asso-ciated fluorescence emission spectra obtained from three-exponential global analysis of the decays at 664–744 nm. The inset shows normalized decay-as-sociated spectra.
Fig. 6. Representative purely absorptive 2D spectra of detergent solubilized LHCII (B.
corti-culans) recorded at RT with excitation pulses
centred at 670 nm and selected waiting times (0.1, 1, 5 and 50 ps). The symbols λτand λt indicate excitation and detection wavelengths, respectively. Yellow-red colours code the nega-tive ground-state bleach/stimulated emission signal with contour lines at every 12.5% in-tensity.
Fig. 7. Waiting-time dependence of the absorptive signal from 0.1 to 100 ps at selected excitation/detection wavelength intersections in the 2D electronic spectra, indicated as λτ→λt. Note the logarithmic time scale.
(Fig. 6c). With the decay of the 665-nm diagonal trace and the 650–665-nm off-diagonal trace, a corresponding rise of the 665–680-nm trace is observed showing that excitations are transferred to lower-energy states. Thus, the spectral evolution generally shows a multistep cascade with rapid EET (mostly within 1 ps) from Chl b to the inter-mediate wavelength region at 660–670, followed by slower dynamics to the low-energy Chl a states. Virtually all EET ceases by 20 ps. The 2D spectra beyond this waiting time are centred at λt= 680 nm and
ex-hibit no correlation between excitation and detection wavelengths (Fig. 6d), which signifies that a thermal equilibrium among all states has been reached.
To obtain a quantitative measure of the EET timescales and asso-ciated pathways, the time-resolved 2DES data were subjected to global multiexponential lifetime analysis [23]. Four lifetime components were necessary for a satisfactory fit. The 2D decay-associated spectra (2D DAS), shown inFig. 8, describe the spectral changes occurring in the 2D electronic spectra with the corresponding lifetimes. Negative or positive amplitudes primarily indicate that the ground state bleach/stimulated emission signal decays or rises, respectively, on a given timescale. The shortest resolved lifetime (260 fs) is characterized by the decay of the diagonal signals (negative amplitudes) along the entire probed region with local maxima at 652 and 660 nm, and the corresponding rise (positive amplitudes) of off-diagonal signals at λt = 672–675 nm
(Fig. 8a). The second 2D DAS (1.7 ps) (Fig. 8b) shows the decay of states at around 662–665 nm, which are either directly excited (on the di-agonal) or populated via EET from upper-lying states (λτ= 650–660 nm) and the corresponding rise of low-energy Chl a excitons (λt≈ 680 nm). The slowest EET timescale, 9.4 ps (Fig. 8c),
shows decay of diagonal and cross-peak signals at λt≈ 670 nm and
further rise of the lowest-energy excitons. A diagonal peak at 650–655 nm is also resolved in the 2D DAS, revealing a small fraction of long-lived Chl b states. Overall, 20% of excitations from 650 nm are transferred to the lowest-energy states (680 nm) within 100 fs, 24% on a 260 fs timescale, and the remaining 56% are transferred on a time-scale longer than 1 ps – the amplitude-weighted average rise time of the
650 → 680 nm cross-peak is ~2 ps.
All three EET components also show uphill pathways as cross-peaks below the diagonal (λt< λτ), positioned generally symmetric to the downhill cross-peak but with lower amplitude, as expected from the detailed balance [24]. The final 2D DAS (τ ≈ 3 ns) (Fig. 8d) reflects the decay to the ground state. As described above, the shape of the spectrum shows almost no correlation between the excitation and detection wa-velengths, indicating that EET is complete and a final, thermally equili-brated state population is reached independent of the initial excitation.
3.4.2. 2D electronic spectra at 77 K
Cooling down to 77 K brings about more spectral details – the lineshapes are significantly narrower and individual peaks become re-solved in the 2D electronic spectra (Fig. 9) – around 650, 658, 669 and 677 nm. At early waiting times (Tw= 100 fs), all four peaks are along
the diagonal line (Fig. 9a). A cross-peak is also observed around λτ= 670 nm and λt= 675–678 nm, which is separated from the
di-agonal peak at 669 nm and probably originates from excitonic coupling between Chl a molecules. In the time between 100 fs and 1 ps (Fig. 9a and b, respectively), the 650 and 658-nm peaks practically vanish and corresponding cross-peaks at λt≈ 675 nm are visible. This indicates
that EET from the high-energy Chl b band to Chl a occurs at a rate comparable to that observed at RT.
The 669-nm peak retains 70% of its intensity at 1 ps, the remaining 30% apparently being transferred to 674 nm. The 669-nm peak is de-tectable even after 5 ps (Fig. 9c), at about 23% of its initial amplitude. By 50 ps (Fig. 9d), all peaks are centred around λt= 677 nm, which is
the terminal excited state. In contrast to the RT measurements, there is still a pronounced correlation between excitation and detection wave-lengths at long waiting times. This is visualized by the horizontal cuts of the spectra at λτin the range 676–680 nm (Supplementary Fig. S7). In
other words, the final exciton state at 77 K, depicted by the diagonal peak at 677 nm, is inhomogeneously broadened.
More details about the EET at 77 K can be seen in the selected ki-netic traces inFig. 10. For instance, the 652-nm diagonal trace (blue Fig. 8. 2D decay-associated spectra of LHCII obtained from four-component global lifetime analysis of 2DES data collected at RT. Red/blue colours represent negative/positive amplitudes (decay/rise of the negative absorptive signal). Note the different colour coding of the signal amplitude. (For interpretation of the references to colour in this figure legend, the reader is re-ferred to the web version of this article.)
curve,Fig. 10a) decays slightly faster than the 658-nm trace (Fig. 10b); initial excitation at both wavelengths results in the population of states around 670 nm (red curves), which grows until 1 ps and thereafter decays, giving rise to lower-energy states. The transients also reveal slow relaxation of states around 674 nm occurring on a timescale longer than 10 ps (yellow curves). The population of the lowest-energy states (purple) steadily grows until 30–40 ps, at which point decay processes prevail.
The 2D DAS resulting from four-exponential fitting of the 2D elec-tronic spectra at 77 K are plotted in Fig. 11. The first three 2D DAS (Fig. 11a, b and c) with lifetimes of 0.5, 2.7 and 15 ps are associated with EET as seen by the decaying diagonal states and corresponding rise of cross-peaks, mainly at longer detection wavelengths. The final life-time in the nanoseconds range represents decay to the ground state. The shortest resolved lifetime of 0.5 ps is associated with decay of the
shorter-wavelength peaks resolved in the 2D electronic spectra – at 650, 658 and 669 nm – giving rise to states at detection wavelengths be-tween 665 and 675 nm. Also visible is the decay of a 652 → 658-nm cross-peak signal, i.e. relaxation of the 658-nm states, which have been populated from states absorbing around 652 nm by very fast EET.
The second 2D DAS (2.7 ps) (Fig. 11b) reflects the subsequent re-laxation of excitons at 658 and 669 nm. The negative-amplitude cross-peaks at the corresponding detection wavelengths, 650 → 658 nm, 653 → 669 nm, 658 → 669 nm, show that these intermediate states bridge the EET from the high-energy Chl b to Chl a. Exciton equili-bration in the 670–675 nm region also occurs on this timescale, with well resolved downhill and uphill cross-peaks.
The slowest EET lifetime of 15 ps (Fig. 11c) is associated mainly with EET between the lowest Chl a states in the 674–678 nm region. However, diagonal peaks at 664–669 nm and at 650 nm are also visible Fig. 9. Representative purely absorptive 2D electronic spectra of detergent solubilized LHCII trimers recorded at 77 K with excitation pulses centred at 670 mm, at selected waiting times Twas indicated. The symbols λτand λtindicate excitation and detection wavelengths, respectively.
Fig. 10. Waiting-time dependence of the absorptive signal of LHCII at 77 K, at selected wavelength intersections, indicated as λτ→λt, plotted for two excitation wavelengths, 652 nm (a) and 658 nm (b).
(see Fig. S8), showing the existence of weakly coupled Chls, presumably Chl a and Chl b, respectively. The shape of the final 2D DAS (re-presenting decay to the ground state) is practically identical to the 2D electronic spectrum at Tw= 50 ps (seeFig. 9d).
4. Discussion
4.1. Chl spectral forms
The efficiency of light harvesting, and hence of photosynthetic en-ergy conversion, depends on the ability of the light-harvesting antenna to (1) absorb the available radiation, i.e. maximize the cross-section and (2) deliver the energy to the reaction centres without quantum losses, i.e. minimize the EET time. These two criteria are inherently at odds – on one hand, the excitation migration time scales with the antenna size and, on the other, the Förster resonance EET rate decreases as the en-ergy gap between the donor–acceptor chromophores increases. The light-harvesting antenna of B. corticulans has an altered carotenoid and Chl composition that enhances the absorption of shorter-wavelength light available below the water surface, when submerged. The car-otenoids siphonein and siphonaxanthin are well suited to absorb green light in the wavelength region between the Soret and Qytransitions of
Chls (Fig. 1) and the efficiency of EET transfer to Chls is higher than 90%, enabling B. corticulans to absorb and utilize the green light effi-ciently under intertidal water [5,25]. B. corticulans also binds more Chl
b at the expense of Chl a (compared to higher plants) to harvest
blue-green light (460–500 nm), and the consequences of this change on the spectroscopic and EET characteristics of the complex are the primary focus of the present study.
Owing to the high degree of sequence homology and the con-servation of all Chl binding sites in Lhcbm from B. corticulans and Lhcb from higher plants [5], the folded protein complexes should have a similar secondary and tertiary structure and general pigment
arrangement; this is also corroborated by the virtually identical CD spectra in the UV region (Supplementary Fig. S2). The absorption spectra confirmed that B. corticulans binds two extra Chl b molecules, giving rise to two positive peaks in the Chl b Qyregion of the difference
spectra B. corticulans minus P. sativum (Fig. 1). Because of the different binding sites, the two Chls differ in transition energy – one absorbs at 658 nm and the other around 650 nm. The additional 658-nm spectral form is also clearly resolved in the 2D electronic spectra at RT (Fig. 6) and 77 K (Fig. 9). It must be noted that similar 77 K absorption spectra were reported for B. maxima, where the 658-nm Chl form was present and identified by gaussian decomposition analysis but ascribed to Chl a [11]. Additional features in the absorption difference spectrum (Fig. 1b) hint that the transition energies of other Chls are perturbed in
B. corticulans. This is expected as the Chl a/b exchange will affect
ex-citonic couplings with neighbouring Chls even if the overall pigment arrangement/conformation is retained. Furthermore, the transition energy of Chls may also be affected by the protein environment sur-rounding their binding sites [26], since there are slight differences in the residues surrounding the binding sites [5] even though the direct ligands for all are conserved between the green alga and higher plants. It is interesting to observe that the additional Chls b in B. corticulans LHCII are at the expense of apparently the lowest-energy form of Chl a (679–680 nm). This results in blue-shifted maxima of the linear spectra (absorption, fluorescence, CD). The missing lowest-energy state is also evident in the 2D electronic spectra. Recently, phenomenological modelling of the 2DES data of P. sativum LHCII recorded under similar experimental conditions has revealed that the final state at 77 K is a distribution of predominantly two excitons – at 677–678 nm and 679–680 nm [27]. In contrast, the 2D electronic spectra of B. corticulans LHCII at long delay times are centred at 677 nm (Fig. 9) – the lowest-energy exciton in this complex. Nakayama and Mimuro [11] fitted a 679-nm component to the absorption spectra of B. maxima recorded at 15 °C but the longest-wavelength form at 77 K was at 675 nm (apart Fig. 11. 2D decay-associated spectra of LHCII at 77 K, obtained from four-component global lifetime analysis of the 2DES data. Red/blue colours represent negative/ positive amplitudes (decay/rise of the negative absorptive signal).
from a substoichiometric broad band at 682 nm). Note that in both B.
corticulans and plant LHCII, cooling results in a gradual blue shift in the
absorption [28] as well as the 2D electronic spectra [24] and an ap-parent disappearance of the red-most transitions that could be of vi-bronic nature [29].
Without a high-resolution structural model, we can only speculate about the binding sites of the extra Chl b molecules; however, the spectroscopic data presented here reveal that at least one of them is associated with the so-called terminal emitter or the lowest-energy exciton in plant LHCII. Earlier mutagenesis and spectroscopy studies on plant LHCII [26] and the most recent model calculations [30] have assigned the lowest exciton state to Chl a612, whereas other models point to a610 [31,32]. It is also possible that the latter two Chls change their role as the lowest-energy sink depending on temperature [33,34]. Müh et al. [32] suggested a possible conformational change of the Chl
a604 site (with respect to the crystal structure) resulting in a red shift.
Accordingly, Chls a604 and a610 may be the lowest-energy sinks in plant LHCII.
ACD spectroscopy can help identify the pigments contributing to spectral features by virtue of generally less crowded spectra [16,35,36] and by linking excitonic bands and the orientation of the underlying transition dipole moments [37]. Corroborating the assignment of Müh et al. [32], the ACD spectra of plant LHCII calculated using their exciton model provided a good qualitative fit of the experimentally measured spectra [16]. Moreover, when Chls a604 and a610 were omitted from the model, the resultant simulated ACD spectra failed to reproduce a characteristic sign inversion of the ACD at 680 nm. Similarly, if one of the energy sinks is replaced by Chl b, the positive ACD band at 680 nm should not be observed. Indeed, the ACD spectra of B. corticulans LHCII lack the positive 680 nm band. Provided that the assignment of the lowest-energy sinks in the model of Müh et al. is correct, it would follow that either Chl a604 or b610 must be replaced by Chl b in B. corticulans.
4.2. Excitation decay lifetimes
Because excitation energy equilibration in the complex is generally very fast (<< 0.1 ns), the fluorescence of the equilibrated system should decay monoexponentially. The minor contribution of short-lived fluorescence decay components (0.1–1.2 ns) might originate from small subpopulations (<10% total) of aggregated or dynamically quenched complexes in the sample. Both the average lifetime (4 ns) and the major decay lifetime (4.5 ns) of LHCII from B. corticulans are slightly longer than the respective values in higher-plant LHCII but within the range of values observed previously, especially for monomeric LHCII (un-published data), and can be attributed to the slightly different local environment of the emitting Chls. On the other hand, the pronounced lifetime heterogeneity and reduction of the average fluorescence life-time in proteoliposomes (Supplementary Fig. S6) is a result of the al-tered environment – mainly the formation of protein-dense LHCII clusters in the membrane [22,38].
It should be noted that the excitation decay lifetimes reported by 2DES are shorter – 1.4–2.6 ns at RT and 0.6–0.8 ns at 77 K. This ap-parent inconsistency is mostly due to the short time range of the measurements (0–100 ps). Consequently, short-lived components of even minor amplitudes (Fig. 5) may significantly bias the fit. Additional excitation decay is likely present in the conditions of the 2DES mea-surements due to singlet annihilation and the presence of glycerol [24]. It remains to be clarified whether the excitation lifetime actually de-pends on the temperature in the absence of these factors.
4.3. Energy transfer dynamics
The central question of the present investigation is how pigment composition changes in LHCII affect the dynamics and efficiency of energy transfer. In LHCII isolated from plants, EET from Chl b to Chl a occurs in the range of 0.15–0.5 ps at RT [39–41] and 0.3–0.6 ps at low
temperatures [42–45]. A distinctive characteristic of all LHCII forms is the presence of long-lived Chl forms absorbing in an intermediate re-gion (660–670 nm) between the major Chl b and Chl a Qy bands
[46,47]. In recent years, several 2DES theoretical modelling studies have revealed further details on the EET dynamics in plant LHCII [for review, see 15]. The lifetime of the intermediate ‘bottleneck’ state as well as the equilibration between the lowest-energy Chl a domains and between monomers in the trimers are in the range of several ps. Longer components in the range of 10–20 ps are resolved at low temperatures [24].
In an earlier work, Zhang et al. [48] assumed that excitation equi-libration in LHCII from B. corticulans occurs with time constants span-ning up to 160 ps. The analysis was based mainly on multiexponential fits of the fluorescence decay kinetics recorded at fixed emission wa-velengths. While a decay component of comparable lifetime (120 ps) was resolved in the time-resolved fluorescence presented here, the multiwavelength global analysis results are definitive – no EET takes place on such a long timescale and the decay is attributed to a small fraction (5%) of quenched complexes, always present in vitro. Clearly, the time window of EET is considerably shorter than 50 ps (the in-strument response width), as is the case with plant LHCII and in con-cord with the 2DES experiments performed with 35 fs pulses.
The increased Chl b emission observed in the fluorescence spectra at RT could mean that some Chl b molecules transfer energy to Chl a with lower efficiency. However, Chl b emission (5–10% intensity relative to Chl a) is also observed in RT spectra of higher-plant LHCII – this is a consequence of thermal equilibration and can be expected from the detailed balance condition. The relative increase of Chl b emission (at 650–660 nm) in B. corticulans is ~1.8-fold higher (Fig. 2), i.e. equivalent to the change in the Chl b/a ratio. Moreover, there is no difference between the fluorescence emission spectra upon Chl a and Chl b excitation (data not shown). All these observations indicate that the Chl b emission at RT is due to thermal equilibration. Finally, there are no persistent diagonal peaks in the 2D electronic spectra, which would indicate the presence of energetically uncoupled Chls in the complexes. Therefore, we can conclude with confidence that the light-harvesting complexes are fully functional in the sense that all absorbing chromophores are coupled with high EET efficiency. The very low Chl b emission at 77 K (Fig. 2b), which is consistent with the results of Na-kayama and Mimuro on B. maxima [11], can be attributed to a small, substoichiometric fraction of uncoupled Chl b in the samples. Never-theless, the 2DES data show marked differences in the dynamics of EET in the plant and algal LHCII, as discussed below.
The RT 2D electronic spectra are generally similar to those of higher-plant LHCII obtained with the same experimental setup [15,49]. They show spectral redistribution occurring on different timescales – from several hundred fs to several ps, ending up in a thermal equili-brium of excited states independently from the initially excited state. However, global analysis of the 2DES data revealed that the pathways and dynamics of EET differ between plant LHCII and B. corticulans. An obvious change is that the longest resolved EET lifetime is around 5 ps in plant LHCII but 9.4 ps in B. corticulans. The EET process contributing mostly to the decay lifetime is from states around 669 nm – this spectral form is also resolved at 77 K and can be related to the ‘bottleneck’ long-lived Chls in plant LHCII. The 9.4 ps 2D DAS also revealed a fraction of long-lived Chl b, at 650–655 nm. Such long-lived Chl b states are not present in plant LHCII; therefore, the decay probably represents one of the extra Chl b molecules found in B. corticulans. It must be noted that the long-lived Chl b population has no significant impact on the overall rate of Chl b → a EET at RT – the 2 ps average time for populating the lowest-energy Chl a is still very short, compared to the excitation life-time of 4 ns. As discussed above, a second additional Chl b in B.
corti-culans LHCII absorbs at 658–659 nm. This spectral form rapidly relaxes
by EET to Chl a, as revealed by the well resolved diagonal peak in the 260-fs 2D DAS (Fig. 8a).
temperature to 77 K results in measurably slower EET dynamics in LHCII from B. corticulans as well. The relative contribution of decay lifetimes to the diagonal peaks in the 2D electronic spectra at 77 K is shown inTable 1. The average population lifetime of high-energy Chl b forms (650 nm) is about 5 ps (note that the final ns decay is not in-cluded in the calculation of the average lifetimes). EET from the 658-nm spectral form slows down as well – approximately equal amplitudes of the 0.5 ps and 2.7 ps lifetimes result in a 1.8 ps average lifetime. The slowest EET dynamics, however, is found in the Chl a region – with average lifetimes of 8.4 and 10.7 ps for the diagonal signals at 672 and 674 nm, respectively. Comparing these diagonal peak lifetimes with the values corresponding to LHCII from P. sativum, it is evident that EET can be up to two-fold slower in B. corticulans. An exception is the life-time of the 658-nm peak, which is determined by relatively fast EET from the extra Chl b. The slower EET in the Chl a wavelength region may be intuitively understood in terms of comparatively lower Chl a concentration in the complex volume and lower density of excited states in energy domain. It can be said that adaptation of LHCII to shorter-wavelength light in the intertidal alga does come with a trade-off between the enhanced absorption cross-section and excitation mi-gration time. Although exciton equilibration time is longer in B.
corti-culans – about 10 ps – it is still an order of magnitude shorter compared
to the trapping time of PSII [50]. Therefore, the adaptive change should have negligible effect on the overall quantum efficiency.
5. Conclusions
The comprehensive spectroscopic characterization presented here reveals details on the adaptation of the siphonous alga B. corticulans to its intertidal habitat by spectrally tuning LHCII to shorter wavelengths. Compared to higher-plant LHCII, the complex contains two additional spectral forms of Chl b – absorbing at around 650 nm and 658 nm, at the expense of Chl a absorbing at around 674 nm and 679 nm – the lowest-energy Chl a form in LHCII. The specific Chl a/b exchange in B.
corticulans, while retaining the general tertiary structure of the protein
complex, presents a valuable opportunity to identify spectral forms and the associated Chl binding sites, which has been a highly challenging and contentious issue [15]. It would be highly informative to analyse the present spectroscopic results in terms of the complex structure, whenever it becomes determined, e.g. by X-ray diffraction or cryo-electron microscopy.
The adaptive change in Chl composition in B. corticulans LHCII al-ters the pathways and dynamics of EET. The Chl b form at 650 nm is relatively long-lived, slowing down EET to Chl a. The lower density of Chl a also results in a markedly slower EET to the lowest-energy state (677 nm), which occurs on a timescale of about 10 ps at 77 K. Thus, there is a trade-off between the increased absorption cross-section at shorter wavelengths and the excitation migration time. However, as the latter is much shorter than the overall excitation trapping time, the quantum efficiency of PSII should not be significantly affected. These results show that LHCII is a robust adaptable system whose spectral properties can be tuned to the environment while maintaining effi-ciency of EET.
Acknowledgements
The work is supported by grants from the Hungarian Ministry of Finance (GINOP-2.3.2-15-2016-00001), the National Research, Development and Innovation Fund (NKFI NN 124904; 2018-1.2.1-NKP-2018-00009), the Singapore Ministry of Education Academic Research Fund (MOE2015-T2-1-039), the National Key Research and Development Program of China (2017YFA0503700), a CAS Key Research Program for Frontier Science (QYZDY-SSW-SMC003), and the National Natural Science Foundation of China (31600191). CD mea-surements at the B23 beamline of the Diamond Light Source Ltd. were supported by the project CALIPSOplus under Grant Agreement 730872 from the EU Framework Programme for Research and Innovation HORIZON 2020.
Declaration of competing interest
The authors declare that they have no known competing financial interests or personal relationships that could have appeared to influ-ence the work reported in this paper.
Appendix A. Supplementary data
Supplementary data to this article can be found online athttps:// doi.org/10.1016/j.bbabio.2020.148191.
References
[1] J.T. Kirk, Light and Photosynthesis in Aquatic Ecosystems, 3rd edn., Cambridge University Press, Cambridge, 2011.
[2] V. Giovagnetti, G. Han, M.A. Ware, P. Ungerer, X. Qin, W.-D. Wang, T. Kuang, J.-R. Shen, A.V. Ruban, A siphonous morphology affects light-harvesting modulation in the intertidal green macroalga Bryopsis corticulans (Ulvophyceae), Planta 247 (2018) 1293–1306.
[3] G. Christa, S. Cruz, P. Jahns, J. de Vries, P. Cartaxana, A.C. Esteves, J. Serôdio, S.B. Gould, Photoprotection in a monophyletic branch of chlorophyte algae is in-dependent of energy-in-dependent quenching (qE), New Phytol. 214 (2017) 1132–1144.
[4] H. Chen, S. Shen, Y. Liang, J. Leng, M. Tang, Y. Gong, Evidence for dissociation of chlorophyll b from the main light-harvesting complex in the oligomerization state isolated from marine alga, Bryopsis corticulans, Biochim. Biophys. Acta 1707 (2005) 170–178.
[5] W. Wang, X. Qin, M. Sang, D. Chen, K. Wang, R. Lin, C. Lu, J.-R. Shen, T. Kuang, Spectral and functional studies on siphonaxanthin-type light-harvesting complex of photosystem II from Bryopsis corticulans, Photosynth. Res. 117 (2013) 267–279. [6] G. Chen, X. Niu, X. Chen, L. Li, T. Kuang, S. Li, Characterization of
chlor-ophyll–protein complexes isolated from a Siphonous green alga, Bryopsis corticulans, Photosynth. Res. 96 (2008) 75–81.
[7] K. Nakayama, M. Okada, Purification and characterization of light-harvesting chlorophyll a/b-protein complexes of photosystem II from the green alga, Bryopsis maxima, Plant Cell Physiol. 31 (1990) 253–260.
[8] Z.F. Liu, H.C. Yan, K.B. Wang, T.Y. Kuang, J.P. Zhang, L.L. Gui, X.M. An, W.R. Chang, Crystal structure of spinach major light-harvesting complex at 2.72 Å resolution, Nature 428 (2004) 287–292.
[9] A. Pagano, G. Cinque, R. Bassi, In vitro reconstitution of the recombinant photo-system II light-harvesting complex CP24 and its spectroscopic characterization, J. Biol. Chem. 273 (1998) 17154–17165.
[10] R. Croce, T. Morosinotto, S. Castelletti, J. Breton, R. Bassi, The Lhca antenna complexes of higher plants photosystem I, Biochim. Biophys. Acta 1556 (2002) 29–40.
[11] K. Nakayama, M. Mimuro, Chlorophyll forms and excitation energy transfer path-ways in light-harvesting chlorophyll a/b-protein complexes isolated from the si-phonous green alga, Bryopsis maxima, Biochim. Biophys. Acta 1184 (1994) 103–110.
[12] K. Nakayama, M. Mimuro, Y. Nishimura, I. Yamazaki, M. Okada, Kinetic analysis of energy transfer processes in LHC II isolated from the siphonous green alga, Bryopsis maxima with use of picosecond fluorescence spectroscopy, Biochim. Biophys. Acta 1188 (1994) 117–124.
[13] G.S. Schlau-Cohen, A. Ishizaki, G.R. Fleming, Two-dimensional electronic spectro-scopy and photosynthesis: fundamentals and applications to photosynthetic light-harvesting, Chem. Phys. 386 (2011) 1–22.
[14] F.D. Fuller, J.P. Ogilvie, Experimental implementations of two-dimensional Fourier transform electronic spectroscopy, Annu. Rev. Phys. Chem. 66 (2015) 667–690. [15] P.H. Lambrev, P. Akhtar, H.-S. Tan, Insights into the mechanisms and dynamics of
energy transfer in plant light-harvesting complexes from two-dimensional elec-tronic spectroscopy, Biochim. Biophys. Acta 2020 (1861) 148050.
[16] P. Akhtar, D. Lindorfer, M. Lingvay, K. Pawlak, O. Zsiros, G. Siligardi, T. Jávorfi,
Table 1
Decay lifetimes and relative amplitudes of the diagonal peaks in the 2D elec-tronic spectra at 77 K. Lifetime (ps) 650 nm 658 nm 669 nm 672 nm 674 nm 0.5 50% 51% 26% 8% 0% 2.7 22% 48% 50% 46% 40% 15.4 28% 1% 24% 46% 60% Average lifetime (ps) 5.2 1.8 5.1 8.4 10.7 Average lifetime (P. sativum)a 2.5 4.2 3.5 4.5 5.7
M. Dorogi, B. Ughy, G. Garab, T. Renger, P.H. Lambrev, Anisotropic circular di-chroism of light-harvesting complex II in oriented lipid bilayers: theory meets ex-periment, J. Phys. Chem. B 123 (2019) 1090–1098.
[17] P. Akhtar, M. Lingvay, T. Kiss, R. Deák, A. Bóta, B. Ughy, G. Garab, P.H. Lambrev, Excitation energy transfer between light-harvesting complex II and photosystem I in reconstituted membranes, Biochim. Biophys. Acta 1857 (2016) 462–472. [18] P.J. Nowakowski, M.F. Khyasudeen, H.-S. Tan, The effect of laser pulse bandwidth
on the measurement of the frequency fluctuation correlation functions in 2D elec-tronic spectroscopy, Chem. Phys. 515 (2018) 214–220.
[19] Z. Zhang, K.L. Wells, E.W.J. Hyland, H.-S. Tan, Phase-cycling schemes for pump–probe beam geometry two-dimensional electronic spectroscopy, Chem. Phys. Lett. 550 (2012) 156–161.
[20] R. Bassi, M. Silvestri, P. Dainese, I. Moya, G.M. Giacometti, Effects of a non-ionic detergent on the spectral properties and aggregation state of the light-harvesting chlorophyll a/b protein complex (LHCII), J. Photochem. Photobiol. B Biol. 9 (1991) 335–353.
[21] P. Lambrev, Z. Várkonyi, S. Krumova, L. Kovács, Y. Miloslavina, A.R. Holzwarth, G. Garab, Importance of trimer–trimer interactions for the native state of the plant light-harvesting complex II, Biochim. Biophys. Acta 1767 (2007) 847–853. [22] P. Akhtar, F. Görföl, G. Garab, P.H. Lambrev, Dependence of chlorophyll
fluores-cence quenching on the lipid-to-protein ratio in reconstituted light-harvesting complex II membranes containing lipid labels, Chem. Phys. 522 (2019) 242–248. [23] K.L. Wells, P.H. Lambrev, Z.Y. Zhang, G. Garab, H.-S. Tan, Pathways of energy
transfer in LHCII revealed by room-temperature 2D electronic spectroscopy, Phys. Chem. Chem. Phys. 16 (2014) 11640–11646.
[24] P. Akhtar, T.N. Do, P.J. Nowakowski, A. Huerta-Viga, M.F. Khyasudeen, P.H. Lambrev, H.-S. Tan, Temperature dependence of the energy transfer in LHCII revealed by two-dimensional electronic spectroscopy, J. Phys. Chem. B 123 (2019) 6765–6775.
[25] T. Polívka, V. Sundström, Ultrafast dynamics of carotenoid excited states−from solution to natural and artificial systems, Chem. Rev. 104 (2004) 2021–2072. [26] R. Remelli, C. Varotto, D. Sandona, R. Croce, R. Bassi, Chlorophyll binding to
monomeric light-harvesting complex - a mutation analysis of chromophore-binding residues, J. Biol. Chem. 274 (1999) 33510–33521.
[27] T.N. Do, A. Huerta-Viga, P. Akhtar, H.L. Nguyen, P.J. Nowakowski,
M.F. Khyasudeen, P.H. Lambrev, H.-S. Tan, Revealing the excitation energy transfer network of light-harvesting complex II by a phenomenological analysis of two-di-mensional electronic spectra at 77 K, J. Chem. Phys. 151 (2019) 205101. [28] G. Zucchelli, P. Dainese, R.C. Jennings, J. Breton, F.M. Garlaschi, R. Bassi, Gaussian
decomposition of absorption and linear dichroism spectra of outer antenna com-plexes of photosystem II, Biochemistry 33 (1994) 8982–8990.
[29] G. Zucchelli, F.M. Garlaschi, R.C. Jennings, Thermal broadening analysis of the light harvesting complex II absorption spectrum, Biochemistry 35 (1996) 16247–16254.
[30] G. Zucchelli, S. Santabarbara, R.C. Jennings, The Qyabsorption spectrum of the light-harvesting complex II as determined by structure-based analysis of chlorophyll macrocycle deformations, Biochemistry 51 (2012) 2717–2736.
[31] V. Novoderezhkin, A. Marin, R. van Grondelle, Intra- and inter-monomeric transfers in the light harvesting LHCII complex: the Redfield–Förster picture, Phys. Chem. Chem. Phys. 13 (2011) 17093–17103.
[32] F. Müh, M.E.-A. Madjet, T. Renger, Structure-based identification of energy sinks in plant light-harvesting complex II, J. Phys. Chem. B 114 (2010) 13517–13535. [33] H. Rogl, R. Schödel, H. Lokstein, W. Kühlbrandt, A. Schubert, Assignment of
spectral substructures to pigment-binding sites in higher plant light-harvesting complex LHC-II, Biochemistry 41 (2002) 2281–2287.
[34] K. Vrandecic, M. Rätsep, L. Wilk, L. Rusevich, M. Golub, M. Reppert, K.-D. Irrgang, W. Kühlbrandt, J.R. Pieper, Protein dynamics tunes excited state positions in
light-harvesting complex II, J. Phys. Chem. B 119 (2015) 3920–3930.
[35] Y. Miloslavina, P.H. Lambrev, T. Jávorfi, Z. Várkonyi, V. Karlický, J.S. Wall, G. Hind, G. Garab, Anisotropic circular dichroism signatures of oriented thylakoid membranes and lamellar aggregates of LHCII, Photosynth. Res. 111 (2012) 29–39. [36] J.T. Nielsen, N.V. Kulminskaya, M. Bjerring, J.M. Linnanto, M. Rätsep,
M.O. Pedersen, P.H. Lambrev, M. Dorogi, G. Garab, K. Thomsen, C. Jegerschöld, N.U. Frigaard, M. Lindahl, N.C. Nielsen, In situ high-resolution structure of the baseplate antenna complex in Chlorobaculum tepidum, Nat. Commun. 7 (2016) 12454.
[37] H.-G. Kuball, E. Dorr, T. Höfer, O. Türk, Exciton chirality method. Oriented mole-cules – anisotropic phases, Monatsh. Chem./Chem. Mon., 136 (2005) 289–324. [38] A. Natali, J.M. Gruber, L. Dietzel, M.C. Stuart, R. van Grondelle, R. Croce,
Light-harvesting complexes (LHCs) cluster spontaneously in membrane environment leading to shortening of their excited state lifetimes, J. Biol. Chem. 291 (2016) 16730–16739.
[39] L.O. Pålsson, M.D. Spangfort, V. Gulbinas, T. Gillbro, Ultrafast chlorophyll b–chlorophyll a excitation energy transfer in the isolated light harvesting complex, LHC II, of green plants. Implications for the organisation of chlorophylls, FEBS Lett. 339 (1994) 134–138.
[40] T. Bittner, K.-D. Irrgang, G. Renger, M.R. Wasielewski, Ultrafast excitation energy transfer and exciton–exciton annihilation processes in isolated light-harvesting complexes of photosystem II (LHC II) from spinach, J. Phys. Chem. 98 (1994) 11821–11826.
[41] J.P. Connelly, M.G. Müller, M. Hucke, G. Gatzen, C.W. Mullineaux, A.V. Ruban, P. Horton, A.R. Holzwarth, Ultrafast spectroscopy of trimeric light-harvesting complex II from higher plants, J. Phys. Chem. B 101 (1997) 1902–1909. [42] T. Bittner, G.P. Wiederrecht, K.-D. Irrgang, G. Renger, M.R. Wasielewski,
Femtosecond transient absorption spectroscopy on the light-harvesting Chl a/b protein complex of photosystem II at room temperature and 12 K, Chem. Phys. 194 (1995) 311–322.
[43] H.M. Visser, F.J. Kleima, I.H.M. van Stokkum, R. van Grondelle, H. van Amerongen, Probing the many energy-transfer processes in the photosynthetic light-harvesting complex II at 77 K using energy-selective sub-picosecond transient absorption spectroscopy, Chem. Phys. 210 (1996) 297–312.
[44] F.J. Kleima, C.C. Gradinaru, F. Calkoen, I.H.M. van Stokkum, R. van Grondelle, H. van Amerongen, Energy transfer in LHCII monomers at 77 K studied by sub-picosecond transient absorption spectroscopy, Biochemistry 36 (1997) 15262–15268.
[45] C.C. Gradinaru, S. Özdemir, D. Gülen, I.H.M. van Stokkum, R. van Grondelle, H. van Amerongen, The flow of excitation energy in LHCII monomers: implications for the structural model of the major plant antenna, Biophys. J. 75 (1998) 3064–3077. [46] M.A. Palacios, J. Standfuss, M. Vengris, B.F. van Oort, I.H.M. van Stokkum,
W. Kühlbrandt, H. van Amerongen, R. van Grondelle, A comparison of the three isoforms of the light-harvesting complex II using transient absorption and time-resolved fluorescence measurements, Photosynth. Res. 88 (2006) 269–285. [47] A. Marin, I.N.M. van Stokkum, V.I. Novoderezhkin, R. van Grondelle,
Excitation-induced polarization decay in the plant light-harvesting complex LHCII, J. Photochem. Photobiol. A Chem. 234 (2012) 91–99.
[48] S.-J. Zhang, S.-C. Wang, J.-F. He, H. Chen, Energy transfer among chlorophylls in trimeric light-harvesting complex II of Bryopsis corticulans, Acta Biochim. Biophys. Sin. 38 (2006) 310–317.
[49] P. Akhtar, C. Zhang, T.N. Do, G. Garab, P.H. Lambrev, H.-S. Tan, Two-dimensional spectroscopy of chlorophyll a excited-state equilibration in light-harvesting com-plex II, J. Phys. Chem. Lett. 8 (2017) 257–263.
[50] S. Caffarri, K. Broess, R. Croce, H. van Amerongen, Excitation energy transfer and trapping in higher plant photosystem II complexes with different antenna sizes, Biophys. J. 100 (2011) 2094–2103.