Globalization of Services and Transnational
Corporations in Services: U. S. Experience
著者
関下 稔
journal or
publication title
Annual Research Report of Nagoya Gakuin
University
number
20
page range
1-17
year
2007-12-31
Introduction
The service economy is expanding at a rapid rate. The development of globalization has made possible the frequent movement beyond national boundary of information, money, goods and human resources, which has led to a borderless economy. This has made people’s lives more convenient, and companies have expanded to all corners of the globe, but on the other hand it has become increasingly difficult for individual states to reign in and control the situation, bringing about a weakening of and a transformation of the traditional role of the nation state. As one of the features of the new economy the IT revolution is promoting unprecedented development in globalization; certainly contributing toward creating a global economy.
Globalization is influencing the world economy in various ways. For example, the service economy and capitalization deriving from the IT revolution during the 1990s in the United States have swept ahead, and this “new economy” has flourished, causing changes in the very constitution of that countries economy. At the same time these things led to a loss of the traditional manufacturing base, there has been an increase in cross border service transactions and service derived revenue. On the other hand we have seen China move from a centrally planned economy to an open economy, which has led to a flow of foreign capital into that country leading to an expansion in its market economy. There have been large increases in manufacturing in China due to its low labor costs, with that country now known as the “world’s factory” or workshop of the world.
Transnational corporations spend enormous huge amount of money into research and development, developing numerous new products, although actual production is carried out through either, a) foreign affiliates or, b) independent local suppliers, in China and other countries that have lower labor costs. The former is a form of internalization through international division of labor in house (intra-firm division of labor), while the latter is externalization through international outsourcing, and in recent years there has been a large increase in the role of the latter. Using strong name branding, these companies make use of their global networks, selling goods to a global city at high prices, thereby maximizing profits. And through the use of advertising and promotions through the media, they strengthen images of their products in an effort to increase consumer confidence in their company and brand, seeking global standardization and uniformity. In addition, with projects, development,
Globalization of Services and Transnational
Corporations in Services: U. S. Experience
production, sales, maintenance and value chain becoming transnational, transnational corporations can concentrate on the upstream and downstream value added production and on the midstream have products of low value added manufacturing in countries with lower labor costs. Market investigation techniques, organizational skill and integrated network functions are very important to transnational corporations. Perhaps it is pertinent to say that integrated large scale transnational manufacturing corporations should rather be known as transnational service network corporations of knowledge. It is the emergence of the Intellectual Capital.
In the globalization trend at the beginning of the 21st Century, with the rise of its transnational service network system, the United States has become the centre of knowledge and on the other hand China has become the centre of fabrication of goods, therefore the two complementing each other, creating a version of Super Capitalism, a relatively new phenomenon. During the cold war it was a battle between capitalism and socialism, but this can no longer continue now that we live in a world with an integrated production system and common markets, in which both parties work against each other in a new era of competition. At the apex of this are The United States and China.
The Japanese economy, in response to a sudden rise in the price of oil in the 1970’s and the resulting price revolution1), made efforts to downsize and streamline and companies that represent the
Japanese production system such as Toyota, with their “Just in Time” or “Lean Production System” and the Japanese Management System have had been able to lead the world in process innovation and manufacturing of products. However, during the 1990’s a decrease in competitive power of Japanese companies due to the rise of China as a manufacturing base and a hollowing out of the Japanese economy due to the relocation of companies to mainland China and the emergence of new business models such as the flourishing of open architecture in the United States in IT, and modular production systems all threatened viability of the Japanese model. Thus Japan entered a period of prolonged economic stagnation, sometimes known as the “lost decade.” The Japanese style management has reached a turning point, with employee loyalty toward the company based on production system, life employment system, seniority system placing emphasis on the Keiretsu system and skilled labor being eroded, with continuing restructuring on a large scale based on the adoption of the achievement system and the splitting up of companies, for example.
This paper2) aims to examine how the development of globalization has led to the service
economy expanding on a world scale, to consider how this has changed the activities of transnational corporations, and finally to give an overview of the changes and influences on the world economy and to discuss possible future directions. In the first part the author will analyze development of the service economy by examining the role of transnational companies with particular focus on the United States. The latter part will focus on the affects of the service economy on the Japanese economy, as well as future possible directions for Asia.
1. The large scale formation of income and expenditure of services and the development of the service economy in the United States: A primary statistical analysis.
Let us consider that the main axis of the world economy in the 21st century will be the United States, which lead particularly in the area of the service economy. In recent years the development of the service economy has being able to flourish due to the development of IT, and internally this is reflected in the rising prices, development of infrastructure based on IT investment, increases in employment in the IT industry and improvement in the performance of information industries. Such developments have been emphasized in various Reports on the digital economy of the Department of Commerce3) and the Council of Economic Advisors of the President4). Here the author will focus not
on the internal situation, but rather on from an international perspective.
Progress in the development of the service economy and the dominance of the United States can be understood by examining that countries massive external excess of receipts in trade of services. It is well known that the United States runs a large trade deficit and this trade friction with Japan is seen as the cause of a drop in competitiveness in that country. However, one of the causes of this drop in the competitiveness in the manufacturing sector in that country is in fact the technology spin offs to the private sector of new technology developed by the military, and the resulting product innovation, and due to the high amount of competitive power in the market these products produces, it has gradually led to high economic growth and prosperity. Opposed to this, Japan that places high emphasis on process innovation, through a high quality cheap skilled labor force, total quality control, TQC, job rotation, loyalty to a firm by the sense of belonging installed through the seniority system of promotion at companies was able to put relatively high quality products to the market at relatively competitive prices, and possessed a high level of competitive power. Due to this, there was an increase in the trade imbalance between the U. S and Japan, and this was the source of the imbalance of trade between both countries.
Another cause of the drop in the competitive power of the manufacturing sector in the United States is that transnational manufacturing corporations gradual move of production bases overseas has led to a hollowing out of domestic industry within the United States itself, with the production base having being eroded. It was attempted to increase the competitive power on a global scale to compete with transnational companies, and it helped that the U. S dollar become the de facto international currency, which led to the accumulation of capital, distribution and production through production of goods through overseas affiliated companies in foreign direct investment.
The United States was not the only country to pursue the transnational manufacturing path, and other industry from developing countries also jumped on the bandwagon, but there were large differences in the order of development and the scale between the pioneering United States and the companies that followed from developing countries, with the pace of expansion unequal. It follows that
it is not only outward FDI from The United States, but if there is continued hollowing out of industry by foreign companies overseas (inward FDI from the point of view of The United States), then the situation should improve for foreign companies in third countries, but this did not happen. Rather, there was increased competition between U. S companies at home and abroad, and it become common to defend against The United States companies, even in their own market.
However, before long, newly industrialized countries began to expand themselves at a rapid pace, and at the same time, trilateral relations between the U. S, Europe and Japan with cross or mutual investment came to the fore. As globalization incorporating transitional economies developed in the post Cold-War period, there was active bi-directional FDI (inward FDI and outward FDI) and overseas expansion by companies, and it became appropriate for companies to embrace the concept of international direct investment ― outward and inward foreign direct investment. This led to world growth and an increase in industrialization. In contrast to the trend of large scale excess in balance of trade and decreased competitiveness in the area of manufactured goods, the United States has achieved new records in the scale of service income and expenditure, with this trend continuing to increase. A result of this is that about half of the trade deficit in the trade of goods can be traced back to receipt surplus in service trade (Table 1). It is a peak in 1997 and is falling down gradually in the following years. Furthermore, it will become clear later, but if we take into account local service transactions by overseas affiliates of U. S companies (Figure 5), then this cancels out any trade deficit that that country has. In this sense, it is irrefutable that United States dominance is due to the service trade and expansion of service sales in the local market of foreign affiliates of U. S. companies. Let us examine this in more detail.
There are numerous categories of service transactions, ranging from transportation and travel, the traditional ones, to new concepts such as IT. The recent excess in services transaction receipts in the U. S is overwhelmingly concentrated in the category, “other service transactions” (Figure 1 ~ 3). Especially since 2001, when the world situation became unstable and travel fares and transportation all decreased, this category of “other service transactions” has increased. In order to understand this, it is necessary to firstly outline how the different categories of service transactions in the United States are categorized. Since the 1990’s the Bureau of Economic Analysis (BEA) has published cross border service transactions (buying and selling) in their Survey of Current Business. They categorize international sales and purchases of private services into 1) cross border trade and 2) sales through locally established direct investment enterprises or affiliates. The former category is what we would normal expect to include in international service transactions, but the latter is a little unusual in that it goes so far as to include the transactions of affiliates and locally established firm’s business activities. This has special significance, which will be discussed below.
In the above category cross border trade includes: travel, passenger fares, other transportation, royalties and license fees (R&F), and other private services (Table 2). The first three represent
Table 1. U. S. International Transactions, 1986―2002 [Millions of dollars]
Year Goods Services Balance on
current account
Exports Imports Balance Exports Imports Balance
1986 223,344 368,425 - 145,081 86,689 80,147 6,543 -147,177 1987 250,208 409,765 - 159,557 98,661 90,787 7,874 -160,655 1988 320,230 447,189 - 126,959 110,919 98,526 12,393 -121,153 1989 359,916 477,665 - 117,749 127,087 102,479 24,607 -99,486 1990 387,401 498,435 - 111,034 147,832 117,659 30,173 -78,965 1991 414,083 491,020 -76,937 164,261 118,459 45,802 3,747 1992 439,631 536,528 -96,897 176,824 118,111 58,712 -48,013 1993 456,943 589,394 - 132,451 185,433 122,148 63,285 -81,989 1994 502,859 668,690 - 165,831 199,763 131,121 68,642 -117,678 1995 575,204 749,374 - 174,170 218,521 139,420 79,101 -105,217 1996 612,113 803,113 - 191,000 238,764 150,633 88,131 -117,203 1997 678,366 876,485 - 198,119 255,507 164,435 91,072 -127,684 1998 670,416 917,112 - 246,696 262,142 178,599 83,543 -204,691 1999 683,965 1,029,987 - 346,022 281,508 196,687 84,821 -290,846 2000 771,994 1,224,417 - 452,423 298,060 221,021 77,039 -411,458 2001 718,712 1,145,927 - 427,215 288,868 219,472 69,396 -393,745 2002 681,874 1,164,746 - 482,872 292,233 227,399 64,834 -480,861
Source: Survey of Current Business (SCB) July 1999, and U. S. Internatonal Transactions Accounts Data (http://www.bea.doc.gov/bea/international).
Other Service
Royalties & License Fees
Travel Passenger Fares Other Transportation
Figure 1. U. S International Trade Balance in Service by Category, 1986―2002
Source: SCB, various issues, table. 1. and U. S. International Transactions Accounts Data (http//www. bea.doc.gov/bea/international).
traditional service transaction concepts, and so we will examine the other two: R&F and “other private services”. These can be analyzed in the following ways:
Firstly, “other private services” record a large surplus (excess of transactions). A feature of this is that transactions between the U. S and the UK and Japan represent the largest proportion of these excess of transactions as well as recording a large surplus (Table 2). In this respect international service transactions do happen between developed countries, and this clearly demonstrates The United State’s competitive strength. However, on the opposite side of the coin, transactions with tax havens such as Bermuda and Bahamas are excess payments. The United States insurance industry has a large excess in payments, and over half of there are with Bermuda. The fact that there are service payments on such a large scale to tax havens is one special feature of this. Added to this, as the third point another feature of this is that the transactions between transnational corporations and independent organizations have a much larger excess in receipts than transactions between themselves. In any
Japan
Canada U. K. Netherlands Germany
Figure 2. U. S International Balance on Service by Country, 1986―2002
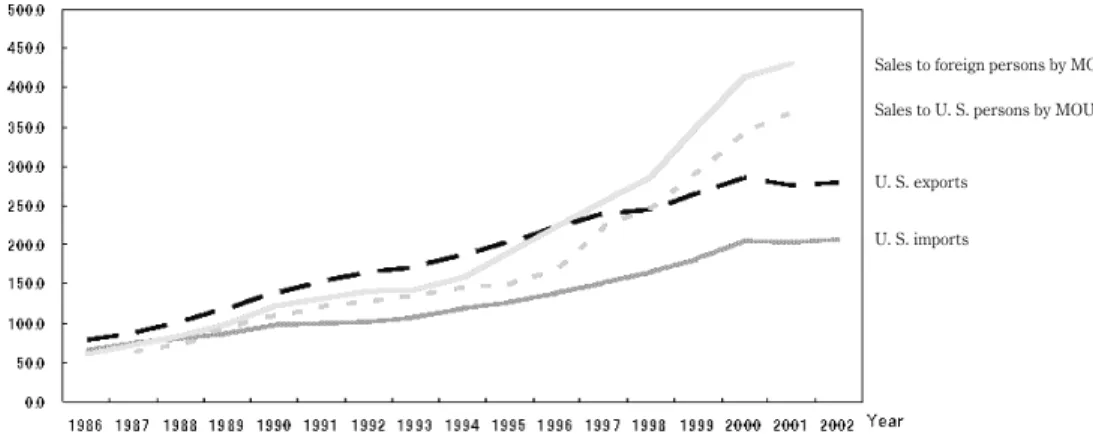
Sales to foreign persons by MOFA Sales to U. S. persons by MOUSA
U. S. exports
U. S. imports
Figure 3. Sales of Services to Foreign and U. S. Markets Through Cross-Border Trade and Through Affiliates, 1986―2002
Source: SCB, October 2003. Table. B. Source: SCB, various issues.
Table 2. Cr oss-Bor der Ser vices Expor ts and Impor ts by T
ype and Countr
y, 2002 Expor ts [Millions of dollars] Impor ts Balance Tr avel Passenger fares Other transpor tation
Royalties and licence fees Other private ser
vices Total ser vices Tr avel Passenger fares Other transpor tation
Royalties and licence fees Other private ser
vices Total ser vices Tr avel Passenger fares Other transpor tation
Royalties and licence fees Other private ser
vices Total ser vices 10 lar gest countries 38,205 11,295 15,755 25,594 65,449 156,298 (55.9%) 30,205 10,200 19,996 15,796 49,464 125,661 (61.2%) 8,376 - 873 - 6,246 11,158 17,747 30,162 (40.6%) United Kingdom 8,177 (2.9%) 2,813 1,932 4,452 14,442 (5.2%) 31,816 (11.4%) 5,561 (2.7%) 3,290 2,657 1,493 13,586 (6.6%) 26,587 (13.0%) 2,616 (3.5%) - 477 - 725 2,959 (4.0%) 856 5,229 (7.0%) Japan 8,492 (3.0%) 2,809 2,825 6,352 (2.3%) 9,210 (3.3%) 29,688 (10.6%) 2,874 1,051 4,169 (2.0%) 4,997 4,221 (2.1%) 17,312 (8.4%) 5,618 (7.6%) 1,758 - 1,344 1,355 4,989 (6.7%) 12,376 (16.7%) Canada 6,268 (2.2%) 1,717 2,624 3,091 10,594 (3.8%) 24,294 (8.7%) 6,489 (3.2%) 594 3,589 1,048 6,694 (3.3%) 18,414 (9.0%) - 221 1,123 - 965 2,043 3,900 (5.3%) 5,880 (7.9%) Ger many 2,934 1,001 2,018 3,090 7,013 (2.5%) 16,056 (5.7%) 2,275 1,531 2,560 2,091 6,246 (3.0%) 14,703 (7.2%) 659 - 530 - 542 999 767 1,353 (1.8%) Mexico 5,507 (2.0%) 1,329 792 1,247 7,027 (2.5%) 15,902 (5.7%) 7,061 (3.4%) 794 993 117 2,101 11,066 (5.4%) - 1,554 535 - 201 1,130 4,926 (6.6%) 4,836 (6.5%) France 1,974 778 876 2,119 4,993 10,740 (3.8%) 2,919 1,003 1,091 1,263 3,379 9,655 (4.7%) - 945 - 225 - 215 856 1,614 1,085 (1.5%) K or ea, R epublic of 2,175 13 2,063 1,157 2,352 7,760 (2.8%) 888 1,110 1,875 37 424 4,334 (2.1%) 1,287 - 1,097 188 1,120 1,928 3,426 (4.6%) Netherlands 1,024 413 836 1,332 3,614 7,219 (2.6%) 852 526 1,231 1,513 1,915 6,037 (2.9%) 172 - 113 - 395 - 181 1,699 1,182 (1.6%) Switzerland 696 195 353 2,031 3,475 6,750 (2.4%) 619 530 422 1,892 3,150 6,613 (3.2%) 77 - 335 - 69 139 325 137 (0.2%) China 958 227 1,436 723 2,729 6,073 (2.2%) 1,124 292 2,256 20 444 4,136 (2.0%) - 166 - 65 - 820 703 2,285 1,937 (2.6%) Ber muda 16 10 217 271 4,081 4,595 (1.6%) 563 0 454 1,364 7,879 (3.8%) 10,260 (5.0%) - 547 10 - 237 - 1,093 - 3,798 - 5,665 - (7.6%) Ta iwan 794 65 1,694 648 1,639 4,840 (1.7%) 992 881 2,830 18 292 5,013 (2.4%) - 198 - 816 - 1,136 630 1,347 - 173 - (0.2%) Other countries 28,342 5,751 13,411 18,548 57,145 123,197 (44.1%) 27,839 9,769 18,531 3,462 19,972 79,573 (38.8%) 127 - 2,050 - 3,115 13,726 35,411 44,099 (59.4%) All countries 66,547 (23.8%) 17,046 (6.1%) 29,166 (10.4%) 44,142 (15.8%) 122,594 (43.9%) 279,495 (100.0%) 58,044 (28.3%) 19,969 (9.7%) 38,527 (18.8%) 19,258 (9.4%) 69,436 (33.8%) 205,234 (100.0%) 8,503 (11.5%) - 2,923 - (3.9%) - 9,361 - (12.6%) 24,884 (33.5%) 53,158 (71.6%) 74,261 (100.0%) Sour ce: SCB, October 2003, T able D.
event service transactions occur on a large scale, irrespective to whether they take place within or outside of corporations, and this causes excess of service income.
Secondly, the category of “other private services” includes categories that do not traditionally fit in the above service categories, such as: a) education, b) financial services, c) insurance, d) telecommunication, e) business, professional and technical services (BPT), and f) other services (Table 3). Of these categories, BPT have shown significant increases in the past few years. This category remains vague, but includes the following sub-categories: a) advertising, b) computer and data processing services, 3) database and other information services, 4) research, development and testing services, 5) management, consulting, and public relations services, 6) legal services, 7) construction, architectural and engineering services, 8) industrial engineering, 9) installation, maintenance and repair of equipment. Most of these have come about due to the rise in IT, and as they are different from traditional services we could term them “new services”. However, the United States has enormous scale external excess of receipts in this group. In other words, the main increase in the service economy and service income and expenditure in the United States is concentrated in the group “other private services”, especially in BPT, which developed along with the IT revolution. In this group the largest representatives are installation, maintenance and repair of equipment, legal services and computer and data processing services.
Thirdly, another important category is loyalties and license fees (R&F) and this is shown in the strategy that U. S Companies place in the area of superior technology (Table 5). Income from R&F, coming from technology, is an important source of additional profits for U. S transnational corporations. There is more R&F activity within transnational companies than within independent organizations, and parent companies receive a lot more R&F than foreign affiliates. In other words, the parent companies of transnational corporations use the inside of the company as a transfer route for technology, get a lot of R&F income from their foreign affiliates and absorb this into the company. From another perspective, this reveals that foreign affiliates are paying a lot to their parent companies, and the march of globalization of transnational corporations and the production spreads throughout the world (result of proliferation), but the accumulation of capital gets sucked up by the parent company (result of concentration). Especially, amid calls for localization, it is a very important to the future and expansion of transnational corporations that profits earned in the country of the foreign affiliates are reinvested (reinvested earnings, RE), and although foreign governments call for such moves, other profit is taken in as remuneration of technology transfer in the same way as R&F within the company. So it follows there is the large contrast between large excess in receipts of the parent company and the large excess in payments of foreign affiliates. In this way, there is great advantage in the monopolization of technology by the parent companies of transnational corporations, and one could say that there is no independence in the area of technology between the parent company and foreign affiliates. This is one reason why transnational companies choose foreign affiliates based on FDI. That is the secrecy
Table 3. Private Services Trade (Royalties and License Fees, and Other Private Services) by Type,
2002 [Millions of dollars]
Exports Imports Balance
Royalties and license fees 44,142 19,258 24,884
Affiliated 32,218 15,132 17,086
U.S. parents’ transactions 29,066 2,958 26,108
U.S. affiliates’ transactions 3,152 12,174 -9,022
Unaffiliated 11,924 4,126 7,798
Other private services 122,594 69,436 53,158
Affiliated services 43,500 32,367 11,133
U.S. parents’ transactions 25,194 17,529 7,665
U.S. affiliates’ transactions 18,306 14,838 3,468
Unaffiliated services 79,094 37,069 42,025
Education 12,759 2,466 10,293
Financial services 15,859 3,665 12,194
Insurance services 2,839 15,348 -12,509
Telecommunications 4,137 4,180 43
Business, professional, and technical services 28,799 10,732 18,067
Accounting, auditing, and bookkeeping services 360 716 356
Advertising 633 1,360 -727
Agricultural, mining, and onsite processing services 366 273 93
Agricultural and mining services 346 259 87
Waste treatment and depollution services 20 14 6
Architectural, engineering, and other technical services 1,916 312 1,604
Computer and data processing services 3,004 1,057 1,947
Construction, architectural, engineering, and mining services n.a. n.a. n.a.
Construction 654 226 428
Data base and other information services 2,426 236 2,190
Industrial engineering 749 185 564
Installation, maintenance, and repair of equipment 4,992 812 4,180
Legal services 3,270 768 2,502
Management, consulting, and public relations services 1,696 1,188 508
Medical services 1,901 n.a. n.a.
Miscellaneous disbursements 623 1,522 -899
Operational leasing 3,573 190 3,383
Research, development, and testing services 1,086 1,040 46
Sports and performing atrs 175 110 65
Traderelated services 353 95 258
Training services 591 361 230
Other business, professional and technical services 430 283 147
Other unaffiliated services 14,700 679 14,021
n.a. : Not Available.
of important technology within the company and the diffusion of the mechanism of the technology transfer to foreign affiliates are a source of the massive amounts of R&F income that is generated. In addition, companies also have a two pronged strategy of moving secondary and tertiary technology outside of the company.
Fourthly, let us examine intra-firm trade in services (Table 4). Much intra-firm trade in services is composed of R&F and BPT. As mentioned above, although most R&F is absorbed back into the parent company, BPT also represents a surplus for the parent company. However, foreign affiliates also record a surplus in this area, although the form takes on different characteristics. In other words, in the case of the parent company, R&F causes BPT to increase, and in the case of affiliates, we have the opposite scenario in which BPT causes R&F to increase. More specifically, R&F from foreign affiliates is absorbed by the parent company, and BPT received within the parent company becomes an important source of service income for the foreign affiliates company. The implication is that the results of technology development become R&F and are absorbed into the parent company, but in reality since the actual service takes place at the foreign affiliates company and income is generated, in sheer numbers of BPT, foreign affiliates play an important role in that transnational corporation’s entire service activity. One could say that if the former belongs to the company’s strategic assignment, the latter performs the essential activity of the company.
Fifthly, let us examine service transactions of foreign affiliates in their local market, something we have as yet neglected. What makes these activities international services is when considering the overseas activities of transnational manufacturing corporations, it is not only local production, other things such distribution, sales activities in that market and reverse importation to the parent companies country, the total activity of the foreign affiliates in production and transportation taken up as exportation to a third country. These activities create a huge amount of profit and power for the entire organization, not only the affiliates (Figure 5).
However, the transnational corporation still focuses on the service activities of the affiliates in its local market. It is obviously an indispensable to U. S parent companies in using service activities of foreign affiliates. It is safe to say that this is one method for the extension of the formation of service economy in the United States, and even further the expansion of the world service economy. The aim of The United States for the foreseeable future is to create another world service economy outside that of The United States, in U. S fashion. It means Americanization of services.
Service sales by the overseas subsidiaries came to exceed crossing border service exports after the middle of the 1990s. This means that selling activities by affiliates companies of transnational corporations came to exceed service trade. Also in services, the center of gravity has been moving to the service activities of the local subsidiary instead of the export from the U. S. In manufacturing, just as there has been an increase in overseas production, it indicates that there has been a step forward in the development of internationalized services, and an even larger increase in development of the
international service industry. Presently, international service activity by foreign affiliates is heading toward a new period of more importance than service activity trade from the United States itself. If we should compare the activities of majority owned foreign affiliates of U. S companies (MOFA) and majority owned U. S affiliates of foreign companies (MOUSA) and compare the activity patterns and degree of development of each, in the case of MOFAs, the greater part of the service sale comes from outside the company, and indeed most of the sales come from within the country that the MOFA is situated in (Figure 4). However, sales of these services are still less within the company itself, i. e. sales
Table 4. Intrafirm Trade in Services, by Type, 2002 [Billions of dollars]
Total Transpor-tation Royalties
and License
fees
Other Private Services
Other private services
Total
Business, professional, and technical services (BPT) Film and television tape rentals BPT Total Financ‐ ial services Computer and informati‐ on services Manage‐ ment and consulti‐ ng services Research and devel-opment and testing services Operati-onal leasing Other business, professio‐ inal, and technical services Receipts Total transactions 76.4 0.7 32.2 43.5 40.6 4.0 1.5 2.0 5.2 2.3 25.5 2.9 U.S. parents’ transactions 54.9 0.7 29.1 25.2 22.3 3.0 1.3 1.3 1.2 1.9 13.7 2.9 U.S. affiliates’ transactions 21.5 (*) 3.2 18.3 18.3 1.0 0.2 0.8 4.1 0.5 11.8 (*) Payments Total transactions 48.0 0.5 15.1 32.4 32.3 5.6 2.9 2.6 1.1 0.8 19.3 (*) U.S. parents’ transactions 21.0 0.5 3.0 17.5 17.5 4.9 2.7 0.5 0.6 0.1 8.8 (*) U.S. affiliates’ transactions 27.0 (*) 12.2 14.8 14.8 0.7 0.3 2.1 0.5 0.7 10.5 (*)
(*)Less than $50 million. Source: SCB, October 2003, Table F.
<U.S. Parents>
Receipts Payments Balance
Royalties and License fees 29.1 3.0 26.1
Business, professional, and technical services 22.4 17.6 4.8
<U.S. Affiliates>
Receipts Payments Balance
Royalties and License fees 3.2 12.2 -9.0
Business, professional, and technical service 18.4 14.8 3.6
U.S. Affiliates
FA
U.S. Parents P
Ta
ble 5.
R
oyalties and License F
ees, 2002 [Millions of dollars] R eceipts Pa yments Total A ffiliated Unaffiliated Total A ffiliated Unaffiliated Total By U.S. par ents fr om
their foreign affiliates By U. S. affiliates from their foreign par
ents Total Industrial processes Books, recor ds and tapes Br oadca ‐
sting and recor
ding of live events Franc ‐ hise fees Trade -marks
General use computer softwar
e Other intangi ‐ bles To ta l By U.S. par ents fr om
their foreign affiliates By U. S. affiliates from their foreign par
ents Total Industrial processes Books recor ds and tapes Br oadca ‐
sting and recor
ding of live events Franchi ‐ se fees Tr ade-marks
General use computer softwar
e Other intangi ‐ bles All countries 44,142 32,218 29,066 3,152 11,924 3,900 523 277 555 1,184 4,824 661 19,258 15,132 2,958 12,174 4,126 1,935 346 946 2 230 481 187 Canada 3,091 2,388 2,332 56 703 154 48 20 74 122 286 0 1,048 849 554 295 199 124 38 4 2 8 22 2 Eupope 21,217 16,954 14,573 2,380 4,263 1,325 307 103 189 370 1,954 15 9,779 7,385 1,303 6,083 2,394 1,312 276 D * 61 D D France 2,119 1,525 1,435 90 594 207 36 D D 50 271 0 1,263 651 216 435 612 D8 6 0 10 D * Ger many 3,090 2,028 1,612 416 1,062 326 56 20 27 44 589 * 2,091 1,667 162 1,505 424 247 7 146 0 4 D D Netherlands 1,332 D 1,058 D D 26 16 5 3 D 92 0 1,513 D DD D 31 5 * 0 D 1 0 Switzerland 2,031 D 1,459 D D 113 9 1 1 D 56 * 1,892 D 67 D D 166 4 D 0 8 1 1 United Kingdom 4,452 3,489 2,410 1,079 963 235 79 15 50 97 487 0 1,493 992 178 813 502 200 217 39 * 17 30 0 La
tin America and
Other W ester n Hemispher e 3,739 D 2,966 D D 89 34 D 67 110 210 * 1,555 D D D D D 10 1 0 1 * D Brazil 585 448 447 * 138 11 D D 11 29 2 0 7 6 41 1 *1 * 0 * * 0 Mexico 1,247 D 1,028 D D 42 14 D 18 42 61 0 117 98 31 67 19 D5 1 0 * * D Ber muda 271 D D D D 1 * D * * 5 * 1,364 D DD D D0 0 0 * 0 6 A frica 305 D 190 D D 13 5 3 D 8 38 0 9 7 61 3 1* * 0 * D 0 Middle East 289 D 104 D D 29 11 5 D 16 46 29 31 D D1 D 5* * 0 * D 0 Asia and P acific 13,135 D 7,447 D D 2,270 94 D 164 528 2,241 21 5,215 D DD D 481 14 1 * 16 D D A ustralia 834 D 586 D D 24 18 6 15 38 D * 76 D 23 D D 16 7 * 0 * D * China 723 497 497 * 226 48 5 1 3 20 144 6 20 15 15 0 5 2 * *0*3 0 Japan 6,352 3,097 2,863 234 3,254 1,271 45 41 37 368 1,485 8 4,997 4,519 22 4,497 478 453 6 1 * 14 4 0 K or ea, R epublic of 1,157 D 257 D D 590 9 D 28 34 D 5 37 D 9 D D 4 * * 0 1 D 0 Singapor e 2,327 2,256 2,255 1 71 31 1 * 8 4 25 2 24 22 22 1 1 10 0 0 * * 0 Ta iwan 648 216 211 5 432 234 5 3 12 13 166 0 18 16 16 * 2 1* * 0 * * 0 Inter national or ganisations and unallocated 2,365 1,612 1,454 158 753 21 23 D D 30 49 596 1,620 662 129 533 958 8 8 D * 144 1 D note: (D) Suppr
essed to avoid of data of individual companies. (*) L
ess than $500,000. Sour ce: SCB, October 2003, T able 4.4.
between the parent and affiliate, but have are increasing to some extent, due the use of in company networks. Opposed to this, most MOUSA’s have their majority of sales within the United States, and sales within the parent company and third countries affiliates (the same company) are less. In this respect it can be concluded that the global network is not fully completed, and thus companies are focus their activities in the heart of the service economy, the United States. We have provided a general view of the global service activities seen in the Survey of Current Business (local service transaction of overseas subsidiary + transnational company cross border service transactions), and have introduced five features, but in the area of conceptual regulations and accounting of service transactions, it is rather weak and insufficient.
For example, although today, we may classify the structure of companies as transnational manufacturing, they do not just concentrate on the production and it is not the case that most of their corporation’s profits stem from manufacturing activities alone. In addition, as ties with other Figure 4. Sales of Services by U. S. MNCs Through Their Nonbank MOFAs and by Foreign MNCs Through
Their Nonbank MOUSAs, 2001 [Millions of dollars]
(A) MOFA (Majority‐owned foreign affiliates) (B) MOUSA (Majority‐owned U. S. affiliates)
business and outside expansion develop, they become holding companies where no production takes place, and actually have the tendency to focus on an ongoing strategy and structure, control, and maintenance of brand. The collection and reorganization of data that reflects the actual conditions is needed. Furthermore, it would be ideal to, on an international scale to have unification of concepts and statistical collection methods, as well as principles and standards. Without these things it becomes impossible to deal with the rapidly advancing service economy. Although the statistics may be insufficient in a few aspects, it is true that to some extent U. S data does show the advancement of the development of the service economy in that country. It can be said that progress of the formation of service economy having changed the constitution of U. S. economy, having brought about a fast increase in service transactions with transnational company’s at the centre, which is leading to a change in the structure of transnational companies to knowledge based international service companies. And these transnational corporation service companies spread the activity all over the world through their overseas subsidies and promote progress of the formation of a world service economy. This is connected with the rise of an open architecture or a modular type business model,
U. K. Canada Japan France Netherlands Australia Germany
Figure. 5.1 Sales by MOFAs to foreign persons
U. K. Netherlands Canada Germany Australia France Japan Bermuda
Source: SCB, October 2003, table 8.
and promotes a power shift to a knowledge centered economy, and has led to the establishment of a secure social agreement that bundles the result as intellectual property rights. And we have a situation now where the sphere we call intellectual property rights has far greater value than the value from manufactured goods. This is consolidated in the concept we call “goodwill”5) and the right of use
has become equity, and can be sold at great prices and gets great income.
2. The suffering Japanese economy: The rise of IT and China
The progress toward globalization during the post cold war era has entrapped Japanese economy in a predicament. One is the rise of Chinas as a manufacturing base, the “world’s factory.” Enforcement of reform / opening policy in China began from acceptance of the foreign funding in the area and form which were restricted very much at the beginning. It started from the export processing of labor intensive goods and parts that utilized the lower labor costs in special restricted economic zones along coastal areas. It spread to the whole of the coast gradually, and soon promoted the growth and demand for consumer goods in the whole of China, and expanded the production of finished consumer goods for domestic consumption, and we see the reorganization of nationalized enterprises and private domestic industry, which bought about the emergence of new entrepreneurship. And now there are huge areas devoted to manufacturing such as the Yangtze Delta (for internal consumption), Pearl Delta (traditional export manufacturing), and outlying areas of Beijing (IT). These areas have quickly been added to. The rapid development of a market economy in China suits a powerful policy of structural reform and government, and political instruction, and has led to success in industrialization, highly competitive power, enabling that country to become a overwhelmingly power player in the global market place. It is not that Japan has just become less and less competitive in exports, but that production has increasingly become more concentrated in China, a result of which there has been a move of Japanese production to China and restructuring of the Japanese companies within Japan, or the hollowing out effect. The potential of the China domestic market, with a population also of 1,300 million is limitless, with more options than just mass producing making use of the low cost of labor. Foreign companies have gradually increased their sales of goods and service activities in the Chinese market to match the expansion of domestic consumption demand. Consequently, there has been an increase in the interest in dealing with China, and this has increased the momentum of the expansion of production. Japanese companies have finally developed their own plans for expansion into China, and at the moment there is an unprecedented amount of interest in expansion into China.
The expansion potential into the Chinese market have caused Japanese companies to rethink their old strategy of only developing top products in Japan, and companies have been forced to think seriously about considering such things as the transferring technology, know-how, skilled labor, management know how, and in fact a change in the whole system of Japanese management. This has
caused even more of a reduction in the manufacturing base in Japan, and led to an increase in the speed of the hollowing out of industry.
However, the increase in the manufacturing prowess and attraction of China has led to more interest in other activities in that market, such as marketing, credit and insurance business. This furthermore extends the business opportunities in China for Japanese companies.
Another cause of the current predicament of the Japanese economy is the rise of the new business model, i. e. open architecture type production. The features of the Japanese production system are comprised of a highly skilled workforce and the “keiretsu” subcontractor supplier system, and through an integrated capital production system, it was able to produce high quality goods at relatively cheap prices and maintain a competitive edge in exporting. The four main elements of the means of the strength of this are: Q (quality), C (cost), D (delivery) and F (flexibility), integrated with the external 4p’s (product, price, promotion and place). Fundamentally, Japanese tend to maximize real working hours and minimize waiting time, C, and of course work to ensure Q is lack of defect products, and as a result, D are high number of hours worked to produce flexibly in a small quantity of goods with multi kind of products. All these things, instead of achieving improved products and positive value creation of production, have the effect of a reduction (dropping and slimming) and saving of costs. It means the Japanese lean production system.
If such things continue with the advancement of IT, the competitive power of the old Japanese system will be further eroded. That is to say, that the development of IT with its open architectural approach to business, has been in The United States, promoting the improvement of relations in business, uniting progress, and promotion of the competitive power in that country. It has a kind of complementary character in The United States. However, in Japan, these are substituted for highly skilled labor and subcontract suppliers, and do not strengthen competitive power, but instead will speed up the restructuring of Japanese companies, and increase the troubles of the Japanese economy. The truth is that we are seeing the inversion of competitive power between Japan and the United States accompanying the progress of the IT revolution.
These two things are contributing to the predicament of the Japanese economy, and accompanying the expansion of the instability in the world, government and military cooperation between the United States and Japan under the Japan-US Security Treaty is increasing rapidly. It could be said that if Japan’s previous position under the treaty was that of a “free rider”, then it has moved now to that of “forced rider” (forced upon it due to economic necessity)6). This distorts the way of the development
of the Japanese economy until now, and has created restricting conditions.
3. Conclusion
This promotes the possible horizontal linkage of fair combined production between small and medium businesses from developed countries and overseas companies in local areas, in other words, collaboration. The road from unified type transnational companies to network type collaborative company collaboration has paved the way for establishing new ties. Although progress of the borderless economy and globalization loosens the connections of companies on one hand, it opens opportunities for new connections on the other. Transnationalism until now involved mainly large enterprises until recently, but the spread of the internet has made it possible to exchange information between companies across borders, and is therefore very advantageous to small and medium businesses. Moreover, a combination of production has brought about the rise of the “virtual company” which exists as a virtual space ranging between countries. Such phenomena, will work to help the manufacturing industry and promote its development, and will promote strengthening of power and at the same time advance the trend toward as service economy, especially in Asia. However, to achieve this, transnational corporations that until now kept technology in-house, and took huge R&F back to the parent company, should work toward mutual benefit, equality and cooperation in collaboration with each other, and to promote this, governments and international organizations should encourage the formation of basic rules and support. It is most important that human linkages and friendship are united each other in transnational level.
Notes
1 )This concept is advocated by Yoshikazu Miyazaki. See A New Price Revolution, Yoshikazu Miyazaki (in Japanese), Iwanami Shinsyo, 1975.
2 )This paper arranged from the papers which I had submitted to the UNCTAD and ASEAN Seminar on FDI in Services and Competitiveness in Asia at Ritsumeikan University, Kyoto, Japan, 2―4 March 2004, and made it the complete papers with added some amendement.
3 )The Emerging Digital Economy, U. S. Department of Commerce, 1998, and The Digital Economy 2, U. S. Department of Commerce, 1999.
4 )The Annual Report of The Council of Economic Advisers, 2001, U. S. Government Printing Office.
5 )This concept was made originally by Thorstein Veblen, but it is needed more sophistication and comrehensiveness in our days. See Thorstein Veblen, The Theory of Business Enterprise, New York, 1904.
6 )In detail see Transnational Corporations: Overseas Subsidiaries and Partnerships between Enterprises, Minoru Sekishita (in Japanese), Bunshindo, 2006.
![Table 1. U. S. International Transactions, 1986―2002 [Millions of dollars]](https://thumb-ap.123doks.com/thumbv2/123deta/8248859.1768550/6.774.142.636.135.624/table-u-s-international-transactions-millions-dollars.webp)
![Table 2. Cross-Border Services Exports and Imports by Type and Country, 2002 Exports [Millions of dollars]ImportsBalance TravelPassenger faresOther transportationRoyalties andlicence feesOther privateservicesTotalservicesTravelPassengerfaresOthertranspor](https://thumb-ap.123doks.com/thumbv2/123deta/8248859.1768550/8.774.142.641.113.987/services-millions-importsbalance-travelpassenger-faresother-transportationroyalties-andlicence-privateservicestotalservicestravelpassengerfaresothertranspor.webp)
![Table 3. Private Services Trade (Royalties and License Fees, and Other Private Services) by Type, 2002 [Millions of dollars]](https://thumb-ap.123doks.com/thumbv2/123deta/8248859.1768550/10.774.118.665.154.924/private-services-royalties-license-private-services-millions-dollars.webp)
![Table 4. Intrafirm Trade in Services, by Type, 2002 [Billions of dollars]](https://thumb-ap.123doks.com/thumbv2/123deta/8248859.1768550/12.774.106.674.124.541/table-intrafirm-trade-services-type-billions-dollars.webp)
![Table 5. Royalties and License Fees, 2002 [Millions of dollars] ReceiptsPayments Total](https://thumb-ap.123doks.com/thumbv2/123deta/8248859.1768550/13.774.124.670.95.992/table-royalties-license-fees-millions-dollars-receiptspayments-total.webp)
