Hydrogen Flux through Size Selected Pd
Nanoparticles into Underlying Mg Nanofilms
Author Sushant Kumar, Theodore Pavloudis, Vidyadhar Singh, Hoa Nguyen, Stephan Steinhauer,
Christopher Pursell, Bruce Clemens, Joseph Kioseoglou, Panagiotis Grammatikopoulos, Mukhles Sowwan
journal or
publication title
Advanced Energy Materials
volume 8
number 4
page range 1701326
year 2017‑09‑22
Publisher WILEY‐VCH Verlag GmbH & Co. KGaA, Weinheim Rights (C) 2017 WILEY‐VCH Verlag GmbH & Co. KGaA,
Weinheim
This is the peer reviewed version of the
following article: Hydrogen Flux through Size Selected Pd Nanoparticles into Underlying Mg Nanofilms, which has been published in final form at
http://dx.doi.org/10.1002/aenm.201701326. This article may be used for non‑commercial
purposes in accordance with Wiley Terms and Conditions for Use of Self‑Archived Versions.
Author's flag author
URL http://id.nii.ac.jp/1394/00000637/
doi: info:doi/10.1002/aenm.201701326
1 DOI: 10.1002/
Full Paper
Hydrogen Flux Through Size Selected Pd Nanoparticles into Underlying Mg Nanofilms Sushant Kumar, Theodore Pavloudis, Vidyadhar Singh, Hoa Nguyen, Stephan Steinhauer, Christopher Pursell, Bruce Clemens, Joseph Kioseoglou, Panagiotis Grammatikopoulos, and Mukhles Sowwan*
Prof. S. Kumar, Dr. V. Singh, Dr. S. Steinhauer, Dr. P. Grammatikopoulos, Prof. M. Sowwan Nanoparticles by Design Unit, Okinawa Institute of Science and Technology Graduate
University, 1919-1, Onna-Son, Okinawa 904-0495, Japan Prof. S. Kumar
Department of Chemical and Biochemical Engineering, Indian Institute of Technology Patna, Bihta, Patna 801103, Bihar, India
Dr. T. Pavloudis, Prof. J. Kioseoglou
Department of Physics, Aristotle University of Thessaloniki, GR-54124, Thessaloniki, Greece Prof. H. Nguyen
Department of Mathematics, Trinity University, San Antonio, TX 78212-7200, USA Prof. C. Pursell
Department of Chemistry, Trinity University, San Antonio, TX 78212-7200, USA Prof. B. Clemens
Materials Science and Engineering, Stanford University, Stanford, CA 94305, USA E-mail: [email protected]
Prof. M. S. Author 10
Nanoparticles by Design Unit, Okinawa Institute of Science and Technology Graduate University, 1919-1, Onna-Son, Okinawa 904-0495, Japan
E-mail: [email protected] Prof. J. K. Author 8
Department of Physics, Aristotle University of Thessaloniki, GR-54124, Thessaloniki, Greece Keywords: hydrogen storage, cluster beam deposition, Pd nanoparticles, diffusion coefficient, density functional theory
The application of Mg as a potential hydrogen storage material has been hindered due to the slow absorption rate of hydrogen in Mg films. Herein, we explore the hydrogenation process theoretically using DFT calculations, and compare the energy barriers for hydrogen diffusion through Pd nanoparticle/Mg film interfaces and their variations, i.e. Pd(H)/Mg(O).
2
Decomposing the mechanism into basic steps, we show that Pd undergoes a strain-induced crystallographic phase transformation near the interface, and indicate that hydrogen saturation of Pd nanoparticles enhances their efficiency as nanoportals. Using energetic arguments, we explain why hydrogen diffusion is practically prohibited through native Mg oxide, and seriously suppressed through existing hydride domains. We experimentally investigate hydrogen flux through the nanoportals in Pd nanoparticle-decorated Mg films by PCT hydrogenation measurements, and demonstrate the effect of the surface oxide layer and film thickness on hydrogenation kinetics. We theoretically calculate an r~t1/3 relationship for the radial growth of hemispherical hydride domains, and confirm this relationship by AFM. The diffusion constant of hydrogen in Mg films is estimated as DHfilm≈8×10-18m2s-1, based on TEM characterization. Our unique nanoportal configuration allows direct measurement of hydride domain sizes, thus forming a model system for the experimental investigation of the hydrogenation process in any material.
1. Introduction
The often-cited hydrogen economy relies heavily on the efficient extraction of hydrogen gas from the gas mixture produced from fossil fuels, and its storage in an appropriate medium.
Regarding the latter, metal hydrides are promising materials, given their low cost, abundance, and high weight-percent hydrogen absorption.[1,2] Magnesium hydride, in particular, is an attractive candidate at 7.6 wt.% hydrogen mass capacity.[3] However, to date, commercial application of metal hydrides has been limited by slow absorption and desorption kinetics, requiring high pressure and high temperature, respectively.[4,5] The sluggish absorption rate of hydrogen in Mg, which limits its practical use, can be attributed (i) to surface-adsorbed oxides and impurity gases (such as CO2, H2O, CxHy), and (ii) to the low diffusion constant of hydrogen into existing MgH2. The former are considered to deprive Mg of active sites for
3
catalytic dissociation of hydrogen molecules by covering the nucleation sites for hydride formation, whereas the latter can affect the overall hydrogen uptake capacity substantially.[1,2]
Over the last decade, multiple attempts have been aimed to resolve these issues, including nanostructuring of Mg-based hydrides.[6] Nevertheless, hitherto, a coherent description of vital aspects of these relevant hydrogen sorption factors is still missing or remains unexplored at the nanoscale.
To begin with, thin Mg films are prone to oxidation and spontaneously form an oxide/hydroxide layer on the surface under humid air or even under high vacuum.[7] Upon air- exposure, the Mg surface is covered with 1-2nm of oxide layer within minutes, which reaches to approximately 3nm after 2h. With time, the oxide layer continues to grow slowly following a logarithmic growth rate and reaches 4-5nm within 10 months.[8-10] Notably, both temperature and moisture can expedite the oxide growth.[11] Once formed, the MgO surface layer remains non-catalytic for dissociation of hydrogen molecules due to the high activation energy barrier (2.34-2.94eV).[12-15]
In addition, the hydrogen diffusion coefficient is an important kinetic parameter that determines the suitability of a system for hydrogen storage applications. In general, this value is extremely small in existing MgH2 (e.g., DHMgH2=1.1×10⁻²⁰m2s-1 at T=305K),[16] but can be greatly affected by grain boundaries and other imperfections in the material. The slow absorption kinetics of hydrogen in Mg samples is mainly attributed to the diffusion resistance offered by a blocking layer of MgH2.[17-19]
Consequently, the extremely slow mass transport of atomic hydrogen through this near-impermeable hydride layer becomes the rate-controlling reaction step.[20]
4
A capping layer (~10nm) of transition metals such as Pd or Ti has been proposed as a possible solution in order to overcome the former obstacle, i.e. the early oxidation of Mg films, and facilitate the catalytic dissociation of hydrogen molecules.[14,21-23] However, in doing so, this actually expedites the formation of a surface MgH2 blocking layer, thus stumbling upon the latter hurdle. After studying the effect of oxygen contamination on hydrogen uptake in Pd- covered Mg films, it was found that the presence of a thin native oxide layer could actually increase the hydrogen uptake [24,25] by preventing the formation of a surface MgH2 layer;[18,26]
as long as hydrogen atoms could still penetrate the MgO/Mg interface at certain positions.
Hence, the idea of Pd nanoparticles (NPs) acting as nanoportals for hydrogen diffusion into oxidized Mg films was introduced to enable the decoupling and simultaneous study of both obstacles.[27,28]
Herein, we investigate the crucial factors that can affect the hydrogen sorption behavior in a Pd NP-catalyzed Mg film. In doing so, we explore all the implicit and explicit assumptions of the proposed mechanism, both theoretically and experimentally, with an emphasis on the role of the various potential interfaces. In order to understand the effect of the interfacial MgO layer on the hydrogenation mechanism, we deposit size-controlled Pd NPs on the surface of both oxidized and non-oxidized Mg films within the soft-landing regime; specifically, we investigate the kinetics of both samples (Pd/Mg and Pd/MgO) and validate their differences based on density functional theory (DFT) calculations of hydrogen diffusion barriers through the interface. We employ atomic force microscopy (AFM) to observe the growth rate and the dimensions of localized hydride nanodomains for various film thicknesses. In addition, we explicitly demonstrate the diffusion-induced hydrogen concentration in a single hydride domain by showing the cross-section of a hydrogenated Mg film using transmission electron microscopy analysis of a focused ion beam-prepared sample (henceforth referred to as FIB- TEM), and estimate the apparent diffusion coefficient using MATLAB codes.
5 2. Results and Discussion
2.1. Model for the hydrogenation of a Mg film through Pd nanoportals
Pd NPs overlaid on the surface of a Mg film can locally inhibit the oxidation of Mg,[27]
forming localized metal-metal interfaces on otherwise surface-oxidized Mg films. In this context, a potential hydrogenation mechanism through Pd NP nanoportals was proposed for an underlying surface-oxidized Mg film, as summarized in Figure 1.[27,28] Upon hydrogen exposure, hydrogen molecules adsorb and dissociate to individual atoms on the surface of the Pd NPs (A), which subsequently diffuse through interstitial octahedral sites of the Pd NPs toward the interface with the substrate.[29-31] If this is a Pd/MgO interface (B), hydrogen penetration is suppressed; if it is a Pd/Mg interface (C), hydrogen atoms diffuse through it, eventually forming MgH2. Hydride growth beneath the Pd NPs leads to a volumetric expansion as a result of the Mg-to-MgH2 transformation. Consequently, such expansion ruptures the surface of the surrounding MgO layer, allowing additional hydrogen atoms to spillover through the cracks and react with underlying fresh Mg (D).[32]
2.2. Theoretical investigation of hydrogen diffusion through oxidized and non-oxidized interfaces
In order to elucidate the hydrogenation process theoretically, we used DFT calculations to explore hydrogen diffusion through Pd/Mg and Pd/MgO interfaces (corresponding to our experimental pristine and air-exposed samples, respectively; see sections 2.3 and 2.4, below).
Details regarding the simulation method can be found in the Experimental Section. For comparison, we also built PdH/Mg and PdH/MgO interfaces, to study the effect of hydrogenation of the Pd NPs, as the interstitial diffusion of hydrogen through Pd NPs is a preliminary step in the hydrogenation of Mg films.
6
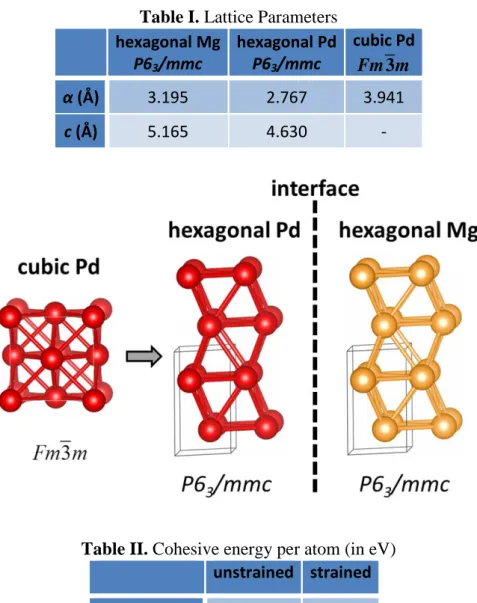
During the Pd/Mg interfacial relaxations, the initially cubic Pd structure (space group:Fm m3 225) always switched to a hexagonal one, similar to the hexagonal structure of the underlying Mg film (space group: P63/mmc 194). The structural transformation was driven by the strain arising from the accommodation of Pd on the hexagonal Mg substrate, since the energy of the strained hexagonal structure is much lower than the energy of the strained cubic structure. The resulting lattice parameters, respective unit cells, and cohesive energies are provided in Figure S1.
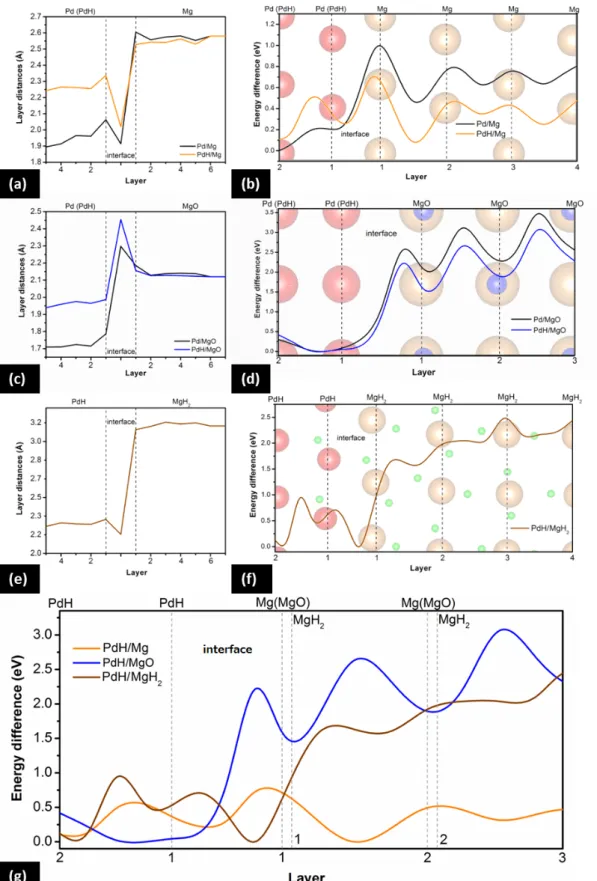
Interlayer distances near and at the four aforementioned sharp interfaces are compared in Figure 2(a) and (c). As expected, in all cases internal layers of all atomic types are almost regularly spaced up to the interface area. However, at the Pd/Mg and PdH/Mg interfaces, both topmost layers expand perpendicularly toward the interface, resulting in a closer distance between the two interfacial components. The behavior is different for the Pd/MgO and PdH/MgO interfaces, where the expansion of the topmost layers is accompanied by larger interfacial distances.
Subsequently, we investigated the potential hydrogen diffusion pathways and barriers for all interfaces. At the Pd/Mg interface, the hydrogen atom needs to overcome a barrier of 0.90eV to penetrate into the Mg region (Figure 2(b)-black curve). The same barrier is lower for PdH/Mg, at 0.49eV, showing that there is a strong correlation between the diffusion barrier and hydrogen saturation of Pd (Figure 2(b)-orange curve). The lower barrier may be attributed to the larger interfacial distance mentioned above, which results in more space for the hydrogen atom to diffuse through. The Pd(H)/Mg interfaces facilitate the diffusion through the first and second Mg layer and hence a sudden drop in the energy can be observed.
The diffusion barrier between the first and second Mg layer is reduced to 0.43eV. In the
7
PdH/Mg case, the energy for the hydrogen position between the first and second Mg layer is even lower than the energy for the hydrogen atom between the last two PdH layers. Finally, the diffusion behavior is stabilized in the following layers, and the barrier becomes 0.15- 0.27eV for both cases, close to the diffusion barrier for hydrogen in bulk Mg. Energy minima are located between the Mg layers, where the hydrogen atom can be easily accommodated.
The diffusion path of hydrogen in a pristine sample is clearly demonstrated in Supplementary Information Movie S1. It should also be mentioned that in the case of partial interfacial alloying the diffusion barrier is further reduced by ~12%, as explained in Figure S2.
On the contrary, the diffusion barriers are markedly higher for Pd/MgO and PdH/MgO, being 2.54eV and 2.21eV respectively (Figure 2(d)). In this case, the hydrogen atom is strongly attracted by the oxygen atoms in MgO. Since the attractive forces by the surrounding left and right oxygen atoms are equal, the hydrogen atom stays on a straight-line, perpendicular path, while the oxygen atoms are pulled closer to it (see Movie S2). The minimum distance recorded between the hydrogen and oxygen atoms is only 1.25Å. Energy maxima are located between Mg layers where the hydrogen atom is interacting with four neighboring oxygen atoms, while minima are located on layers where hydrogen interacts with just two oxygen atoms. The configuration energy keeps increasing as the hydrogen atom moves deeper into the MgO region, with the diffusion barriers becoming ~0.99-1.18 eV. This suggests that the oxide layer inhibits hydrogen diffusion; especially so with increasing oxide layer thickness.
In the case of pristine samples, where hydrogen diffusion through the interface is much more likely, the region of the Mg film directly below the nanoportal is transformed into Mg hydride very early on in the hydrogenation process. This transformation is accompanied by a crystallographic phase transition, as hexagonal Mg (space group: P63/mmc 194) turns into tetragonal MgH2 (space group: P42/mnm 136) (for more details, see Supplementary
8
Information, Figure S3). A series of models with different orientation combinations was examined and a conclusion was reached that MgH2 is accommodated on Mg with the (110) surface parallel to the Mg (001) surface. This combination is of the lowest total energy and causes the lowest strain on MgH2. Experimental evidence supporting this result can be found in literature.[33] Full hydrogenation into MgH2 is also accompanied by volumetric expansion of ~32%.[14] It should be noted that a consequent transformation of hexagonal PdH back to its original cubic structure, following the crystallographic phase transition of the underlying Mg substrate into MgH2, was deemed energetically non-preferable by a large margin, suggesting that PdH retains the hexagonal structure near the interface even after Mg transforms to MgH2.
The inter-layer distances of this newly formed PdH/MgH2 interface are shown in Figure 2(e).
The distance between the last two layers before the interface slightly increases for PdH and decreases for MgH2, whereas, the distance between the adjacent PdH and MgH2 layers at the interface is much smaller. The hydrogen atom needs to overcome a barrier of approximately 0.81eV and then 0.17eV to jump from its initial position to the position between the last PdH and the first MgH2 layers, right in the middle of the interface, as shown in Figure 2(f).
Globally, this is the energetically favored position. An additional 1.63eV (compare with 0.90eV for Pd/Mg and 0.50eV for PdH/Mg) is required for the hydrogen atom to penetrate into the MgH2 region. The configuration energy increases as the hydrogen atom moves into the MgH2 region. The diffusion barriers drop from 0.88eV for the first layers to 0.28eV for consecutive layers deeper into MgH2. The corresponding meandering diffusion path through the PdH/MgH2 interface is shown in Movie S3. Eventually, after roaming the hydride domain, the hydrogen atom can readily diffuse into a yet non-hydrogenated region of the Mg film, as the diffusion barrier from MgH2 to Mg is virtually non-existent, see Figure S4.
9
All diffusion barriers for the pristine, oxidized and hydrogenated samples are summarized in Figure 2(g); for easy comparison, the energy axes are redrawn to scale. It is evident that the assumptions of the aforementioned hydrogenation model hold true: oxidation of the Mg surface leads to prohibitively high-energy barriers for hydrogen diffusion, whereas hydrogenation becomes increasingly difficult through already existing hydride domains.
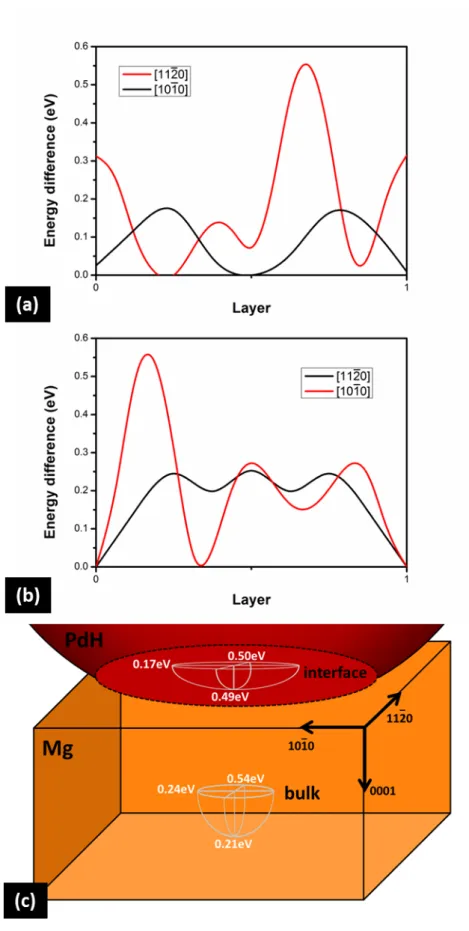
Next, we calculated the diffusion barriers along different crystallographic directions parallel to the PdH/Mg interface, as well as perpendicular to it, as shown above, both near the interface and deeper in the Mg film. Variations in barrier heights imply preferential directions of hydrogen atoms during their diffusion, and may determine the shapes of hydride nanodomain seeds. For diffusion along the
[
0001 , 1120]
, and 1010 directions just one layer below the interface, hydrogen atoms need to overcome barriers of 0.49eV, 0.50eV and 0.17eV, respectively, as shown in Figure 2(b) and 3(a). Farther down in the pure Mg matrix, these barriers become 0.21eV, 0.54eV and 0.24eV, respectively (Figure 2(b) and 3(b)). The differences between these sets of values are due to the strain imposed to the first Mg layers by the interface with PdH. Clearly, the 1010 direction seems to be easier for hydrogen diffusion than the 1120 , leading to ellipsoidal hydride domain seeds, as schematicallydepicted in Figure 3(c). Interestingly, near the interface the 1010 barrier is significantly lower than that along [0001], implying the probable growth of a thin hydride layer just below the interface prior to the hydrogenation of the bulk of the Mg film, in agreement with previously reported observations.[20]
Naturally, on a coarser scale, deviations from the perfect crystalline structure of the Mg films cancel out any directionality in the growth of hydride domains, which, for thick films, can be
10
assumed roughly hemispherical, as schematically illustrated in Figure 4(a). As more hydrogen penetrates the Mg film with time, the radius of the hydride domain increases.
Observing hydrogen mass conservation, and assuming a hydrogen flux, jH, through a constant active nanoportal area, Anp, it can be easily derived that the radius, r, of the hemispherical hydride nanodomain at any given time, t, is given by
3 3 2
H np H
r j A t
pc
= (1)
where cH is the concentration of hydrogen in the hydride region. This r ~ t1/3 dependence describes three-dimensional hydride growth.
In the limiting case of thin films, however, where MgH2 expands all the way to the substrate before reaching either film grain boundaries or other nucleation sites, hydride growth can be approximated by two-dimensional lateral growth, since vertical growth is suppressed due to thickness restrictions. In this case, the domain acquires a cylindrical shape (Figure 4(b)), whose radius as a function of time is given by
= pH np
H
r j A t
c h (2)
where h is the film thickness.[28] This r ~ t1/2 dependence describes two-dimensional hydride growth, and, once again, assumes nanoportal areas which remain constant during the hydrogenation process. Experimental evidence reported in the past, however, showed that this assumption is not necessarily valid at all times, as nanoportal areas were found to shrink or even disappear with time, thus affecting the rate of the hydrogenation process.[28] This is our next point of focus in the following section, where we investigate the kinetics of hydrogenation from an experimental perspective and put our theoretical findings to test.
2.3. Growth of Pd nanoportals on pristine and surface-oxidized Mg nanofilms
11
Film samples were experimentally prepared by sequential deposition of Mg nanofilms and Pd NPs, using an RF- and a DC magnetron-sputtering source, respectively, as schematically shown in Figure S5. The possibility to adjust various deposition parameters such as magnetron power, U/V ratio, Ar flow rate, and aggregation zone length, as well as the utilization of a QMF for subsequent post-growth size-selection,[34] enable the deposition by soft-landing of monodispersed NPs of chosen shapes[35] and sizes.[36] We have recently emphasized the dependence of Pd NP catalytic activity for hydrogenation of Mg films on their size.[29] Therefore, in accordance with our previous results, in this study we opted for the synthesis of uniform Pd NPs 5nm in diameter; an exemplary AFM scan of a 5nm Pd NP- decorated Mg film is shown in Figure S6. More details on deposition specifications and parameter adjustments are provided in the Experimental Section and Supplementary Information Figure S7. Notably, the ability to deposit Mg and Pd sequentially allowed for an optional intermediate stage of air-exposure, between film and NP depositions, enabling the synthesis of Pd/Mg or Pd/MgO interfaces in a well-controlled manner.
2.4. Chemical characterization of films before and after hydrogenation
First, we studied the chemical composition of our films before and after exposure to hydrogen.
As expected, after hydrogenation clear x-ray peaks of MgH2 (110) appear, shown in the GIXRD analysis of Figure S8(a) for an exemplary film 250nm thick; in addition, EELS analysis confirmed the newly formed phase as MgH2 (Figure S8(b)). Similar peaks were obvious for films of all thicknesses (Figure S8(c)). Moreover, a hydrogenation-induced compressive stress in Mg grains is evident from the slight lower shift (~0.05°) of the Mg (002) peaks,[37] (Figure S8(d)). Note also that crystallite size increases with film thickness (see table in Figure S8)).
12
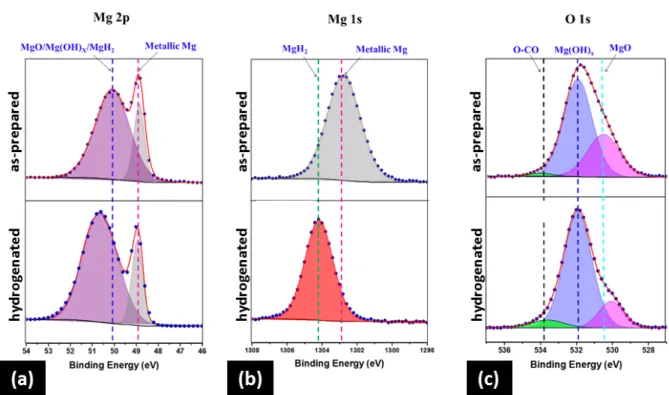
The hydrogenated film was further analyzed using XPS (Figure 5). Since sample handling was carried out in air, a thin oxide/hydroxide passivation layer spontaneously covered the film surface, which simultaneously acquired adventitious carbon.[38] Previous studies showed that the extent of air-exposure is correlated with the shift in the binding energies (EB) of nanocrystalline Mg and MgH2 phases.[39,40] XPS spectra of Mg 2p, Mg 1s, and O 1s were acquired using a monochromated Al Kα source (1486.6eV) under vacuum (~10-9 Torr). The calibration was performed for adventitious carbon; the binding energy, EB, of C 1s was fixed at 284.8eV (Figure S9).
Both samples (before and after hydrogenation) have metallic peaks which are covered with chemisorbed layers of MgO and Mg(OH)x,[41] as shown by the Mg 2p core level spectra (Figure 5(a)). However, on the high EB side of the metallic peak, Mg oxide, hydroxide and hydride peaks overlap to form a broader continuous peak. Notably, the differences in EB of oxide, hydroxide, and hydride are small and cannot be clearly determined.[42] Additionally, the peak intensity of the hydrogenated sample is higher, due to the contribution from overlapping hydrides with oxides. There is a small shift (~0.5eV), which can be attributed to the change in relative concentration of the different phases (MgO, Mg(OH)x, MgH2).
Moreover, there is also a broadening of the Mg peak at 50.0eV, which is due to the additional contribution from MgH2 (other than MgO/Mg(OH)x) for the hydrogenated sample. A discernible difference in the peak position of Mg 1s core level for the as-prepared and hydrogenated sample can be seen in Figure 5(b) and is attributed to the phase transformation of metallic Mg to MgH2. A clear peak of MgH2 at higher EB is evident in the hydrogenated sample.[43,44] The presence of both Mg-O and Mg-OH is also demonstrated by fitting the O 1s core level spectra (Figure 5(c)). A weak third peak at 533.4eV can be assigned to carbon- containing species, carbonate (CO32-) and carboxylates (CO22-), attributed to the chemisorbed water.[45,46] Figure S9(c) shows the Pd 3d spectra for as-prepared samples; the binding
13
energies of Pd 3d5/2 (335.2 and 337.2eV) are 5.3eV and 3.3 eV, respectively, lower than that of Pd 3d3/2 (340.5eV). The intense doublet peaks belong to Pd(0) and the weak peak is attributed to Pd(II) species, such as PdO-Mg and Pd(OH)2- Mg.[47]
Clearly, the probability of formation of one or the other type of interface depends on the thickness of the oxide layer. Therefore, in order to investigate its effect, we divided our samples in two groups: (a) pristine: those deliberately exposed to air after Pd NP deposition, but prior to hydrogenation, leading to the formation of a thin protective MgO (or, occasionally, Mg(OH)2) layer, and (b) air-exposed: the Mg film is exposed to air prior to subsequent Pd NPs deposition. Both sample types were exposed to the same hydrogen pressure, 1bar, at 298K for various times. In order to explore the hydrogenation mechanism and kinetics, we used Mg films of various thicknesses, namely 25, 100, and 250 nm.
2.5. Effect of surface oxide layer on hydrogenation kinetics
As explained in the previous section, in the air-exposed sample a thin layer of MgO/Mg(OH)2 builds on the Mg surface, creating Pd/MgOx/Mg interfaces. At these interfaces, high oxygen content impedes or ceases diffusion of hydrogen due to the high-energy barrier for diffusion, as shown by our DFT calculations. Moreover, even when hydrogen manages to penetrate the interface, it can be easily trapped at the MgO/Mg boundaries, as explained by the effective medium theory, which states that the electron density is lower at the MgOx/Mg interface than in pure Mg; this makes the latter bond more strongly with hydrogen.[48] Hence, it is likely that hydrogen concentration at a Pd/MgOx/Mg interface is higher than at a nearby Pd/Mg interface; however, this may not necessarily result in MgH2 formation.
14
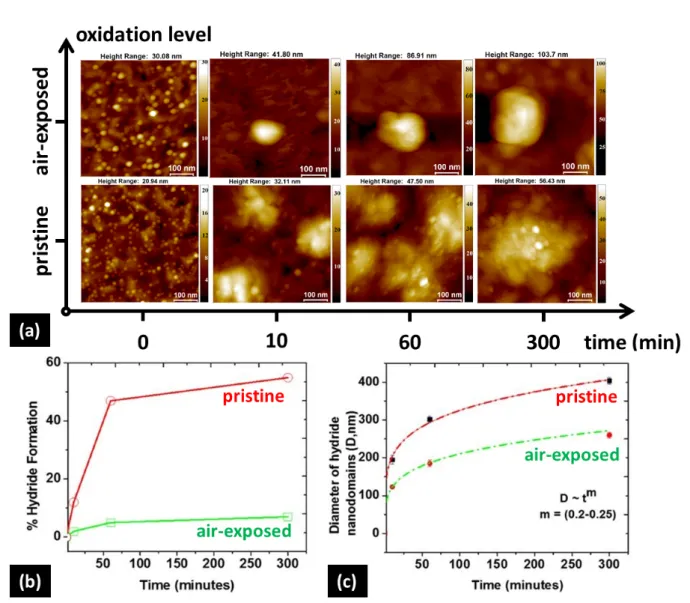
In order to study the effect of surface oxidation quantitatively, we deposited Pd NPs of comparable diameters (selected at ~5nm) and number density (~20-25% coverage) on both pristine and air-exposed 100nm Mg films, and hydrogenated them under the same conditions.
Because of the ~32% volume expansion upon the metal-to-hydride phase transformation, hydride domains readily protruded from the surface of the Mg film, and could, therefore, be profiled by AFM topography mappings. Since AFM is a non-intrusive technique, no destabilization or decomposition of the hydride occurred during the measurements.[28] The expansion of hydride nanodomains with reaction time for both samples is shown in Figure 6(a). The presence of active sites even in the air-exposed sample is understandable by the non-negligible surface roughness of the film, which leads to a native oxide of inhomogeneous thickness. As a result, relatively uncovered metallic Mg surface regions do occur in random positions, which allow the diffusion of hydrogen inside the film and result, to some extent, in hydrogen uptake. However, the number of nucleation sites, or active Pd nanoportals (where metallic Mg is in direct contact with Pd), differs vastly between the two samples;
consequently, the hydrogenation rates are also quite different. The average distance between hydride nanodomains in the air-exposed sample is larger, indicating a smaller number of active nucleation sites, and, as expected, a lower percentage of metal-to-hydride conversion at any given reaction time (Figure 6(b)).
Another point of interest is that hydride nucleation is practically instantaneous in both cases indicating the catalytic efficiency of the Pd NPs; subsequently, the Mg film hydrogenates fast at the beginning, but gradually the transformation decelerates (Figure 6(b)). This can also be observed in Figure 6(c), where the mean hydride nanodomain diameter, D, averaged over 50 nanodomains, is shown as a function of reaction time; the diameter grows rapidly at the beginning, but eventually slows down considerably. For both samples, the observed growth rate of hydride nanodomains follows a correlation of D ~ tm, where m = 0.2-0.25,
15
approximating three-dimensional growth (where m=0.3), as theoretically predicted above.
This growth mode can be attributed to the relatively high thickness of the Mg nanofilms. The slightly lower values for m suggest that growth may also be hindered by other factors. For example, the appearance of protrusions can reduce the nanoportal area, due to the increased curvature sustained by the hydride domain surface near the interface. Further, this curvature may also cause additional reduction of the nanoportal area by facilitating partial undercutting of the Pd NPs by an oxide layer.[28,49] In its own turn, the encroachment of the oxide under the nanoportal can deter the contribution of spillover as an auxiliary mechanism for hydrogenation, slowing it down further.
Naturally, after prolonged hydrogenation times, neighboring hydride regions merge with each other, and their contours on the film surface deviate from the circular shape. This leads initially to domains of irregular shapes, due to the random positions of the nanoportals, as can be seen, for example, in the pristine sample after 60 mins (Figure 6(a)). As it is strongly dependent on the distances between active nanoportals, this phenomenon is less pronounced for the air-exposed sample at equal hydrogenation times. Boundaries between crystalline grains may also add to this effect, suppressing hydride expansion.[29] Later on, nanodomains may regain regular, round shapes, after further hydrogenation (e.g., see Figure 6(a), pristine sample at 300 mins). The effect of nucleation site density on the shape of hydride regions is more clearly demonstrated in Figure S10(a) and (b), where different surface coverage yields nanodomains of markedly different profiles. Simultaneously, via EELS mapping it can be observed that, at areas where the film is completely oxidized, no hydride is formed, due to the absence of active Pd nanoportals (Figure S10(c-f)). This, once more, confirms our DFT result that the Pd/MgO interface inhibits – or even blocks completely – the diffusion of dissociated atomic hydrogen into the underlying Mg film.
16 2.6. Hydrogenation of films of different thicknesses
Next, we investigated the thickness of the Mg film as a parameter affecting the saturation point of individual hydride domains, and, as such, the overall hydrogenation kinetics of the film. We exposed pristine films of various thicknesses (i.e. 25, 100, 250nm) to atmosphere, in order to create a thin MgO layer before exposing them to hydrogen for prolonged periods of time (Figure 7(a)), and measured representative hydride protrusion heights at different stages, presented in Figure 7(b-c). As shown in the previous section, it is evident that the hydride seeds expand and merge with hydrogenation time, acquiring irregular shapes. Eventually, these domains reach the grain boundaries, which act as barriers for hydride growth either by impairing[28] or by promoting hydrogen diffusion without allowing for prior hydride formation.[50-52]In either case, at this stage the hydride regions align with the grain boundaries of the parent Mg phase, revealing its granular profile. Subsequently, since lateral expansion is prohibited, the domains grow in the only available direction, i.e. vertically, protruding further from the initial film surface. In the case of thin films, where grains are more limited in size both horizontally and vertically, the hydride pockets reach their full hydrogen capacity per grain sooner.
Indeed, it can be seen that both the exact values of the protrusion heights and their relative increase with respect to the parental film thickness depend on the thickness itself.
Interestingly, the topography profile does not change significantly between Figure 7(b) and (c), indicating that some grains may have achieved full hydrogenation already within the first 10min of hydrogen exposure; beyond this point, further hydrogenation of these pockets ceased. Of course, further hydrogenation of the overall film did occur, though at a lower rate, until all grains containing active nanoportals were also saturated.
17
In the case of films of intermediate thickness, i.e 100nm, protrusion height values also give the corresponding percentages with respect to the film thickness. Protrusions grew from
~25nm after 10 minutes to ~34nm after 300 minutes, indicating that saturation was reached after 5 hours, as protrusion heights extended to ~32% of the film thickness. On the contrary, no hydride pocket saturation was reached for the thick films within 5 hours of exposure, with peak heights of 35 and 51nm corresponding to 14 and 20% of the film thickness for 10 and 300min, respectively.
2.7. Estimation of apparent diffusion coefficient
Finally, we developed a coarse-scale, time-dependent model to estimate the diffusion coefficient of hydrogen in a Mg film at room temperature. Our model is qualitatively based on our DFT findings, but the numerical values of its parameters are taken directly from the observed size of hydride nanodomains inside a thick (250nm) Mg film, assuming Fick’s second law of diffusion. This novel approach is possible due to our deposition method offering the possibility to develop a unique configuration of distinct hydride domains. As such, the obtained result concerns the apparent diffusion coefficient of the overall system, and implicitly contains information about the formation of the hydride phase, and about hydrogen diffusion through the interfaces of lean- and rich-hydride domains and along grain boundaries.
In literature, the standard method for calculating diffusion constants has been by performing high-temperature experiments and then extrapolating to room temperature, as reported in refs.[53-55] It appears that only Uchida et al. have calculated the diffusion constants of hydrogen in Mg films at room temperature for different hydrogen concentrations.[56] Their films were 500nm thick and covered by a full layer of Pd. They found a very high value (DHMg = 7(±2)×10-11 m2s-1) at the beginning of the hydrogenation process, when hydrogen
18
concentration was very low (<1%) and hydrogen atoms had to diffuse through pure Mg;
however, this value dropped a staggering seven orders of magnitude later on (DHtot
= 10-18 m2s-1), with increasing hydrogen concentration. They attributed this pronounced difference on the blocking layer of MgH2, in full qualitative agreement with our DFT results. Still, their calculated diffusion constant was ~100 times higher than that reported by Spatz et al. for bulk MgH2 at 305K (DHMgH2 = 1.1×10⁻²⁰ m2s-1).[57]
According to our proposed mechanism, the hydrogen atoms that are released by the dissociation of hydrogen molecules on the Pd surface diffuse to the underlying Mg film through interstitial sites, forming MgH2 phases. The diffusion of a concentration C of hydrogen (representing MgH2 formation) inside a Mg film is described by a parabolic partial differential equation, as explained in Methodology. For the calculation of the diffusion coefficient, we assume that the top-most layer of the film (which also acts as a hydrogen source in our model) consists fully of MgH2. Such an assumption implies a rather regular distribution of nanoportals on a region of the film surface, and is inspired by our DFT result of preferential horizontal diffusion of hydrogen near the PdH-Mg interface (Figure 3). As the hydrogenation proceeds, the phase becomes MgHx<2 away from the surface. We estimate the value of the diffusion constant by analyzing the depth profile of MgHx until x=0 for a given hydrogenation time.
The spatial distribution and shape of hydride nanodomains inside the 250nm film were determined using FIB-TEM (Figure 8(a)). Near-hemispherical nanodomains nucleated underneath Pd NPs and subsequently grew inside the film; since they were spaced apart by (~0.8µm), they did not fuse with each other during the reaction (Figure 8(b)). The height of the protrusion (~50nm) matches that observed for the 250nm film shown in (Figure 8(c)).
The depth of the hydride domain from the surface is ~110nm, similar to the lateral expansion
19
radius of ~130nm (Figure 8(c)). The hemispherical, rather than ellipsoidal, shape of the hydride region can be attributed to the aforementioned deviations from a perfectly monocrystalline structure of the film. For example, grains of low-angle misorientations can cancel out differences in diffusion barriers along different crystallographic directions, without interfering much with hydride growth.[28]
By comparing the proposed diffusion model to experimental values, the diffusion constant of hydrogen in the film was estimated for the steady-state conditions (Figure 8(d)). The result (DHtot≈ 8 ×10-18m2s-1) is comparable with that of Uchida et al., which supports their reported values and proposed mechanisms, while utilizing an alternative method. The slightly higher constant obtained here may be related to the nanoportal geometry minimizing the effect of the hydride blocking layer. Most importantly, using the proposed diffusion model described here, one can determine the diffusion coefficient of hydrogen inside the metal by analyzing the surface dimensions of the hydride domains.
3. Conclusion
Recently, a configuration of Pd NPs deposited on Mg thin films was proposed, in order to enable the efficient storage of hydrogen inside the latter. According to this scheme, Pd NPs form localized metallic-metallic interfaces with Mg on otherwise surface-oxidized Mg films.
Unlike the native Mg oxide surface, these interfaces were assumed to be hydrogen permeable and, as such, to act as nanoportals for the hydrogenation of the Mg film.
Herein, we explored this mechanism, both theoretically and experimentally, and investigated the kinetics of hydrogen flux through the nanoportals. Using DFT calculations, we determined the energy barriers for hydrogen to diffuse through the Pd NP/Mg film interface. We showed that interfacial strain dictates the transformation of cubic Pd into a hexagonal structure near
20
the interface, and indicated that prior hydrogen saturation of the Pd NPs improves their nanoportal efficiency. We proved that hydrogen diffusion is essentially prohibited through the native oxide layer, especially for one of substantial thickness, and seriously inhibited through existing hydride domains. We calculated an r ~ t1/3 relationship for the radial growth of hemispherical hydride domains, and confirmed this relationship by AFM in experimentally grown, Pd NP decorated Mg films (100nm in thickness). We investigated the hydride growth in films of various thicknesses, exploiting the simple observation that Mg hydrides protrude above the original film surface, reaching up to ~32% of the film thickness for fully-saturated hydride pockets. Making use of FIB-TEM observations, the diffusion constant of hydrogen in Mg films was estimated as DHfilm ≈ 8 ×10-18 m2s-1, which is comparable with previous literature reports for Mg films.
Our nanoportal configuration offers the opportunity to observe distinct hydride domains directly, thus forming a model system for the experimental investigation of the hydrogenation process. Our study confirms the assumptions of the proposed nanoportal mechanism, and provides further insight to the kinetics of the hydrogenation process. We also put forward a diffusion model that can be used to determine the diffusion coefficient of hydrogen in metal- hydrogen systems at room temperature, based on the hydride dimensions. As such, our results encourage further research toward the implementation of nanoportals for commercial application in hydrogen storage media.
4. Experimental Section
4.1. Density Functional Theory (DFT) calculations
All DFT calculations were performed using the Vienna ab initio simulation package (VASP) implementation of the projector augmented wave (PAW) method.[58,59]
21
Pd structural reconstruction: This reconstruction was examined with a model consisting of 80 Pd (10 layers) and 64 Mg atoms and was found to be dominant for all layers. The hexagonal (space group: P63/mmc 194) and cubic (space group:Fm m3 225) structures of Pd were compared in their unstrained and strained states. 12×12×12 and 12×12×8 Γ-centered k-point grids were used for the cubic and hexagonal structures respectively. The cut-off energy for the plane wave basis set was fixed at 520eV and the tetrahedron smearing method with Blöchl corrections with a smearing width of 0.1eV was chosen for the partial occupancies.
Mg to MgH2 transformation: The transformation of hexagonal Mg (space group: P63/mmc 194) to tetragonal MgH2 (space group: P42/mnm 136) was investigated using hexagonal and tetragonal unit cells comprised of 2 Mg, and 2 Mg and 4 hydrogen atoms for Mg and MgH2. The cut-off energy for plane wave basis set was set at 520eV and the smearing method was the tetrahedron method; Blöchl corrections with a smearing width of 0.1eV were chosen. Γ- centered 12×12×8 and 8×8×12 k-point grids were chosen for hexagonal Mg and MgH2 and tetragonal Mg and MgH2, respectively.
Hydrogenation through the PdH/MgH2 interface: The diffusion of hydrogen through the PdH/MgH2 interface was examined using models consisting of six PdH layers and eight MgH2 layers, for a total of 280 atoms. The atoms of the bottom three layers of MgH2 were kept fixed in their positions, while all the remaining atoms in the supercell were free to relax.
A vacuum of 15Å separated the last MgH2 and the first PdH layer. The cut-off energy for plane wave basis set was set at 520eV, and the Gaussian smearing with a smearing width of 0.05eV was chosen for the partial occupancies. A Γ-centered k-point grid with a resolution of 0.6Å-1 was used. An additional diffusing hydrogen atom was allowed to move along the [100] and [010] directions, but was kept frozen at the [001] direction. The hydrogen atom was positioned at three different places in between the layers, starting in PdH, two layers before the interface, and ending at the fourth MgH2 layer, for a total of 21 positions. The total configurational energy was recorded at each position, and the energy difference from the lowest energy configuration for each case was calculated.
Hydrogen diffusion through various Pd-Mg interfaces: Four models were constructed:
a) A Pd NP on a Mg nanofilm, consisting of 48 Pd and 64 Mg atoms
b) A PdH NP on a Mg nanofilm, consisting of 48 Pd, 48 H and 64 Mg atoms
22
c) A Pd NP on a MgO nanofilm, consisting of 48 Pd, 64 Mg and 64 O atoms
d) A PdH NP on a MgO nanofilm, consisting of 48 Pd, 48 H, 64 Mg and 64 O atoms resulting in six layers of Pd (PdH) and eight layers of Mg (MgO) in an orthogonal box. A vacuum of 15Å along [001]([0001]) separated the first Pd layer from the first Mg layer, while periodic boundary conditions were applied on the other two perpendicular directions. The atoms on the bottom three layers of Mg (MgO) were kept fixed in their bulk positions, while all the remaining atoms in the supercell were free to relax. In all models, Pd was strained and was accommodated on the unstrained Mg (MgO). The cut-off energy for plane wave basis set was set at 520eV and a Gaussian smearing with a smearing width of 0.05eV was chosen for the partial occupancies. A Γ-centered k-point grid with a resolution of 0.6Å-1 was used. For the investigation of the diffusion barriers, a hydrogen atom was positioned inside Pd, two layers away from the interface. A second set of relaxations was performed, where the hydrogen atom was allowed to move along the [100] and [010] directions and was kept frozen at the [001] direction. The Pd, Mg, H, and O atoms of the bulk were free to move along all directions, with the exception of the atoms of the bottom three layers of Mg (MgO) that were kept fixed in their positions. The hydrogen atom was positioned at the layers and at three places in-between the layers, for a total of twenty-one positions for Pd (PdH)/Mg (four layers into Mg) and seventeen positions for Pd (PdH)/MgO (three layers into MgO). The total energy of each configuration was recorded and the energy difference from the lowest energy configuration for each case was calculated.
Following the aforementioned computational methodology and settings, two additional diffusion studies were performed:
a) Hydrogen diffusion along different directions near the interface: The optimal position for a hydrogen atom (as obtained previously in the interfacial diffusion study) between the first and second Mg layers was chosen as the starting point.
b) Hydrogen diffusion along different directions inside Mg film: using a 64-atom Mg supercell in an orthogonal box.
4.2. Sequential deposition of Pd nanoparticles on Mg nanofilms of variable thickness
The as-proposed configuration was prepared by sequential deposition of Pd NPs on Mg nanofilms of various thicknesses using (i) a NP source and (ii) an RF-sputtering source, respectively. First, Mg (target purity >99.05%, 50mm in diameter × 3mm thick, purchased from Kurt J. Lesker (PA, USA)) nanofilms of different thicknesses were deposited on un-
23
doped silicon substrates (5×5mm, MTI Corporation, CA, USA) at base pressure below 4×10⁻⁸ mbar and Ar pressure 1.6×10⁻³mbar. The Mg deposition rate was analyzed using a quartz crystal thickness monitor to control the thickness of the nanofilms. After deposition of Mg films, Pd (target purity >99.95%, 25mm in diameter×3mm thick, purchased from Kurt J.
Lesker (PA, USA)) NPs were synthesized; a quadrupole mass filter (QMF) was employed to monitor NP sizes in situ. For 5nm Pd NP deposition, magnetron power and Ar gas flow rate were set to 15W and 80sccm, respectively. The substrate table rotation was set at 2rpm for all depositions to ensure uniform coverage. TEM grids required for TEM/STEM measurements were purchased from Ted Pella Inc. (CA, USA).
4.3. Hydrogenation measurements
Hydrogenation of as-prepared Mg nanofilms with Pd NPs were conducted in a PCT (pressure- composition isotherms) Sievert’s-type apparatus (Setaram PCTpro 2000) for desired time and ambient pressure. In order to simulate real-world application conditions, as-deposited films were deliberately exposed to air for 5 minutes to create a very thin MgO/Mg(OH)2 layer.
Subsequently, these films were put into the micro-doser holder (volume of 0.49mL). All reactions were performed at room temperature (ca. 298K) for different times, at 1bar H2 pressure. The hydrogenated samples were stored inside the glove box, to avoid any contamination that could interfere with their proper characterization.
4.4. Characterization techniques
Grazing Incidence X-ray Diffraction (GIXRD): measurements were done using Cu Kα radiation (40kV/40mA, λ=1.5418Å) at a fixed incident angle of 0.5o. The mean size of Mg crystallites in different thin films was determined by x-ray broadening analysis using the Scherrer equation,
k cos
D λ
β θ
=
, where D=mean crystallite size, k=shape factor (0.94), λ=wavelength (Cu Ka1= 1.54056Å), β=line broadening at half maximum intensity, after subtracting the instrumental line broadening, θ=Bragg angle [37]
(Scanning) Transmission Electron Microscopy (S)TEM: TEM and STEM studies were carried out using an FEI Titan microscope, operated at 300kV, equipped with a spherical aberration corrector for TEM imaging. In TEM mode, spherical and chromatic aberrations were <5µm
24
and 1.4mm, respectively, with an optimum resolution of better than 0.09nm. Electron energy- loss spectroscopy (EELS) experiments were performed with a post-column Gatan Quantum 966 energy spectrometer.
Preparation of TEM Lamella: A Helios Nanolab 650 Focused Ion Beam (FIB) system was used to prepare the TEM lamella of hydride samples. To minimize the FIB-induced damage, a low current of 0.77nA was used to decrease the sample thickness, and 33pA of beam current was employed to observe the cutting process. The lamella thickness was downsized to approx.
200nm. As-prepared lamella were mounted to a TEM grid. Further, the grid was transferred using an inert transfer holder to the TEM in order to prevent the damage of hydride samples due to fast oxidation upon air exposure.
X-ray Photoelectron Spectroscopy (XPS): XPS measurements were performed in a Kratos AXIS Ultra DLD Photoelectron Spectrometer equipped with Al Kα anode (1486.6eV), and a base pressure of 2x10⁻⁹mbar. The Mg 2p, Mg 1s, and O 1s core level narrow spectra were recorded using pass energy of 20eV for high resolution. The binding energy scale was referenced to the C 1s binding energy of 284.8eV of adventitious carbon.
Atomic Force Mircoscopy (AFM): A Multimode 8 AFM (Bruker, Santa Barbara, CA) is stationed in the glovebox (<1ppm O2 and <1ppm water) and used for AFM measurements.
The AFM system has a NanoScope-V controller in tapping mode using a triangular silicon- nitride AFM tip (radius <10nm, force constant of 9N/m, resonant frequency of 150kHZ, and OLYMPUS optics). The AFM system height ‘‘Z’’ resolution and noise floor were less than 0.030nm. For AFM image analysis, scanning probe processor software (SPIP from Image Metrology, Hørsholm, DK) was employed. The obtained images were used to evaluate the surface roughness, protrusion height, and % metal-to-hydride transformation in the nanofilms.
4.5 Diffusion Model
The diffusion of hydrogen of a concentration C, representing MgH2 formation, can be described by the parabolic partial differential equation with the Laplace operator in cylindrical coordinates:
2 2
2 2
1
C C C C
t D r r r z
∂ ∂ ∂ ∂
= + +
∂ ∂ ∂ ∂
25 The boundary conditions are
0,
C=C z=0 and r ≤150
C 0, z
∂ =
∂ z=0and 150< ≤r 250
0,
C= −250≤ <z 0 and r =250
0,
C = z= −250 and r ≤250
where C0 = 1.45x10⁻²¹ g/nm3 is the saturated concentration of MgH2 (layer size of 150nm), the initial concentration is C(r, z, 0)=0.0.
We solved the above equation using Matlab Partial Differential Equation Toolbox, which is based on the Finite Element Method (FEM).
Supporting Information
Supporting Information is available from the Wiley Online Library or from the author.
Acknowledgements
Work performed at OIST was supported by funding from the Okinawa Institute of Science and Technology Graduate University. The authors would like to thank Dr C. Cassidy and Dr K. Aranishi for their help with TEM and XPS measurements, respectively, and Dr J.
Vernieres for useful discussion and advice during the preparation and editing of the manuscript.
Received: ((will be filled in by the editorial staff)) Revised: ((will be filled in by the editorial staff)) Published online: ((will be filled in by the editorial staff))
References
[1] K. Jeon, H.R. Moon, A. M. Ruminski, B. Jiang, C. Kisielowski, R. Bardhan, J. J. Urban, Nat. Mater. 2011, 10, 286.
[2] R.A. Varin, T. Czujko, Z.S. Wronski, Nanomaterials for Solid State Hydrogen Storage, Springer, New York, USA 2009, p. 8.
26
[3] M. Dorhnheim, S. Doppiu, G. Barkhordarian, U. Boesenberg, T. Klassen, O. Gutfleisch, R.
Bormann, Scr. Mater. 2007, 56, 841.
[4] J.F. Stampfer, C.E. Holley, J.F. Shuttle, J. Am. Chem. Soc. 1960, 82, 3504.
[5] Y. Jia, L. Cheng, N. Pan, J. Zou, G. Lu, X. Yao, Adv. Energy Mater. 2011, 1, 387.
[6] G. Xia, Y. Tan, X. Chen, D. Sun, Z. Guo, H. Liu, L. Ouyang, M. Zhu, X. Yu, Adv. Mater.
2015, 27, 5981.
[7] A. Borgschulte, M. Bielmann, A. Züttel, G. Barkhordarian, M. Dornheim, R. Bormann, Appl. Surf. Sci. 2008, 254, 2377.
[8] C. Chen, S.J. Splinter, T. Do, N.S. McIntyre, Surf. Sci. 1997, 382, L652.
[9] T. Do, S.J. Splinter, C. Chen, N.S. McIntyre, Surf Sci. 1997, 387, 192.
[10] A.S. Pedersen, Bj. Vigeholm, J. Kjøller, B. Larsen, Int. J. Hydrogen Energy 1987, 12, 765.
[11] V. Fournier, P. Marcus and I. Olefjord, Surf. Interface Anal. 2002, 34, 494.
[12] T. Ito, A. Kawanami, K. Toi, T. Shirakawa, T. Tokuda, J. Phys. Chem. 1988, 92, 3910.
[13] H. Kobayashi, M. Yamaguchi, T. Ito, J. Phys. Chem. 1990, 94, 7206.
[14] C.-J. Chung, S. Lee, J. R. Groves, E. N. Brower, R. Sinclair, B. M. Clemens, Phys. Rev.
Lett. 2012, 108, 106102
[15] G. Wu, J. Zhang, Y. Wu, Q. Li, K. Chou, X. Bao, J. Alloys Compd. 2009, 480, 788.
[16] P. Spatz, H. Aebischer, A. / Krozer, L. Schlapbach, Z. Phys. Chem. 1993, 181, 393.
[17] R.J. Westerwaal , C.P. Broedersz, R. Gremaud, M. Slaman, A. Borgschulte, W.
Lohstroh, K.G. Tschersich, H.P. Fleischhauer, B. Dam, R. Griessen, Thin Solid Films 2008, 516, 4351.
[18] J. Rydén, B. Hjörvarsson, T. Ericsson, E. Karlsson, A. Krozer, B. Kasemo, J. Less- Common Met. 1989, 152, 295.
[19] P.S. Rudman, J. Appl. Phys. 1979, 50, 7195.
[20] G. Friedlmeier, M. Groll, J. Alloys Compd. 1997, 253-254, 550.
[21] F Tang, T Parker, H-F Li, G-C Wang, T-M Lu, Nanotechnology 2008, 19, 465706.
[22] J. Qu, Y. Liu, G. Xin, J. Zheng, X. Li, Dalton Trans. 2014, 43, 5908.
[23] L. P.A. Mooij, A. Baldi, C. Boelsma, K. Shen, M. Wagemaker, Y. Pivak, H. Schreuders, R. Griessen, B. Dam, Adv. Energy Mater. 2011, 1, 754.
[24] P. Hjort, A. Krozer, B. Kasemo, J. Alloys Compd. 1996, 237, 74.
[25] A.S. Ingason, S. Olafsson, Thin Solid Films 2006, 515, 708.
[26] B. Vigeholm, J. Kjøller, B. Larsen, J. Less-Common. Met. 1980, 74, 341.
27
[27] S. Kumar, V. Singh, C. Cassidy, C. Pursell, C. Nivargi, B. Clemens, M. Sowwan, J.
Catalysis 2016, 337, 14.
[28] C.-J. Chung, C. Nivargi, B. Clemens, Phys. Chem. Chem. Phys. 2015, 17, 28977.
[29] K. Sköld, G. Nelin, Solid State Commun. 1996, 4, 303.
[30] K. Sköld, G. Nelin, J. Phys. Chem. Solids 1967, 28, 2369.
[31] S. Hong, T.S. Rahman, Phys. Rev. B 2007, 75, 155405.
[32] B.D. Adams, A. Chen, Mat. Today 2011, 14, 282.
[33] R. Kelekar, H. Giffard, S.T. Kelly, B.M. Clemens, J. Appl. Phys. 2007, 101, 114311.
[34] P. Grammatikopoulos, S. Steinhauer, J. Vernieres, V. Singh, M. Sowwan, Advances in Physics: X 2016, 1, 81.
[35] J. Zhao, E. Baibuz, J. Vernieres, P. Grammatikopoulos, V. Jansson, M. Nagel, S.
Steinhauer, M. Sowwan, A. Kuronen, K. Nordlund, F. Djurabekova, ACS Nano 2016, 10, 4684.
[36] J. Vernieres, S. Steinhauer, J. Zhao, A. Chapelle, P. Menini, N. Dufour, R. E. Diaz, K.
Nordlund, F. Djurabekova, P. Grammatikopoulos, M. Sowwan, Adv. Funct. Mater. 2017, 27, 1605328.
[37] B.D. Cullity, S.R. Stock, Elements of X-ray diffraction, Pearson Education Limited, Essex, UK 2014, p. 305.
[38] D. Milcius, J. Grbović-Novaković, R. Zostautienė, M. Lelis, D. Girdzevicius, M.
Urbonavicius, J. Alloys Compd. 2015, 647, 790.
[39] O. Friedrichs, J.C. Sánchez-López, C. López-Cartes, M. Dornheim, T. Klassen, R.
Bormann, A. Fernández, Appl. Surf. Sci. 2006, 252, 2334.
[40] I.J.T. Jensen, A. Thøgersen, O.M. Løvvik, H. Schreuders, B. Dam, S. Diplas, Int. J.
Hydrogen Energy 2013, 38, 10704.
[41] N.C. Halder, J. Alonso, W.E. Swartz, Z. Naturforsch. 1975, 30, 1485.
[42] O. Friedrichs, L. Kolodziejczyk, J.C. Sánchez-López, C. López-Cartés, A. Fernández, J.
Alloys Compd. 2007, 434-435, 721.
[43] K. Yoshimura, Y. Yamada, M. Okada, Surf. Sci. 2004, 566-568, 751.
[44] A. Fischer, H. Köstler, L. Schlapbach, J. Less-Common Met. 1991, 172-174, 808.
[45] S.J. Splinter, N.S. McIntyre, W.N. Lennard, K. Griffiths, G. Palumbo, J. Surf. Sci. 1993, 292, 130.
[46] C. Fotea, J. Callaway, M.R. Alexander, Surf. Interface Anal. 2006, 38, 1363.
[47] H. Jin, T. Xiong, Y. Li, X. Xu, M. Li, Y. Wang, Chem. Comm. 2014, 50, 12637.
[48] J.K. Nørskov, F. Besenbacher, J. Less-Common Met. 1987, 130, 475.
28
[49] V.P. Zhdanov, A. Krozer, B. Kasemo, Phys. Rev. B 1993, 47, 11044.
[50] K. Nogita, X. Q. Tran, T. Yamamoto, E. Tanaka, S. D. McDonald, C.M. Gourlay, K.
Yasuda, S. Matsumura, Sci. Rep. 2015, 5, 8450.
[51] X. Yao, Z.H. Zhu, H.M. Cheng, G.Q. Liu, J. Mat. Res. 2008, 23, 336.
[52] E. David, J. Acht. Mats. Manu. Engg. 2007, 20, 87.
[53] J. Renner, H. Grabke, Z. Metallkd. 1978, 69, 639.
[54] C.M. Stander, Z. Phys. Chem. N F 1977, 104, 229.
[55] C.J. Simensen, J. Anal. Chem. 1980, 302, 398.
[56] H.T. Uchida, S. Wagner, M. Hamm, J. Kürschner, R. Kirchheim, B. Hjörvarsson, A.
Pundt, Acta Mater. 2015, 85, 279.
[57] P. Spatz, H.A. Aebischer, A. Krozer, and L. Schlapbach, Z. Phys. Chem. 1993, 181, 393.
[58] P.E. Blochl, Phys. Rev. B 1994, 50, 17953.
[59] G. Kresse, D. Joubert, Phys. Rev. B 1999, 59, 1758.
29
Figure 1. Schematic summary of hydrogenation mechanism of a surface-oxidized Mg film through Pd NP nanoportals.
30
Figure 2. Interlayer distances at and near the Pd(H)-Mg, Pd(H)-MgO, and PdH-MgH2 interfaces, respectively, (a-c-e), and corresponding energy barriers for hydrogen diffusion perpendicular to the interface, (b-d-f). Assuming full hydrogenation of the overlaid Pd NPs, a comparison between the barriers reveals that hydrogenation may be prohibited through the native oxide, and significantly suppressed through previously formed MgH2 domains (g).
31
Figure 3. Diffusion barriers along directions parallel to the interface. (a) One layer below the interface. (b) In the bulk Mg matrix, away from the interface. (c) Schematic representation of
“easy” directions for hydrogen diffusion, as indicated by diffusion barrier values.
32
Figure 4: Hydride nanodomains grow with hydrogen flux through active Pd nanoportals.
Depending on Mg film thickness, domains appear hemispherical (a) or cylindrical (b) in thick or thin films, respectively.
33
Figure 5. Corresponding XPS spectra of (a) Mg 2p, (b) Mg 1s, and (c) O 1s of as-prepared (top) and hydrogenated (bottom) films, indicating the phase transition. Upon hydrogen exposure, transformation to MgH2 and easy formation of oxide/hydroxide layers on the surfaces of both films in ambient atmosphere are indicated.
34
Figure 6. (a) AFM images showing the growth of MgH2 nanodomains as a function of hydrogen exposure time for both samples. (b) At any given time, the metal-to-hydride conversion is relatively higher for the pristine sample, compared with the air-exposed sample.
(c) For both samples, nearly circular hydride nanodomains grow radially with time, which can be fitted with the classical growth law (D ~ tm, m = 0.2-0.25).
35
Figure 7. (a) Extent of hydrogenation after 10 and 300 minutes in air-exposed films of different thicknesses (namely, 25, 100, and 250nm). All the films have comparable Pd NP coverage (ca. 22%), and were hydrogenated under similar conditions (1bar H2 pressure, at 298K). (b) Corresponding protrusion heights of the hydride nanodomains after 10 and 300 minutes, respectively.
36
Figure 8. (a) Preparation of TEM lamella using FIB, showing the cross-section of a 250nm columnar hydrogenated Mg film; the growth of hydride domains is visible. (b) Corresponding SEM image showing the spatial distribution of hydride nanodomains inside the film, with an average distance of ~0.8µm. (c) Dimensions of a hydride nanodomain under TEM: depth
~110nm, lateral size ~260nm, and protrusion height ~50nm. (d) Diffusion model based on Fick’s second law, predicting the hemispherical growth of hydride nanodomains with time.
Using the proposed model, the apparent diffusion coefficient of hydrogen in a 250nm film is estimated to be DHfilm≈ 8 ×10-18 m2s-1.
37
Pd nanoparticles deposited on Mg films locally inhibit their oxidation, enabling hydrogen diffusion through the developed interface, as demonstrated by Density Functional Theory calculations. This unique nanoportal configuration enables direct observation of distinct hydride domains, thus allowing the investigation of hydrogen flux into Mg films and the determination of the apparent diffusion coefficient, with a view to hydrogen storage applications.
Hydrogen Storage
Sushant Kumar, Theodore Pavloudis, Vidyadhar Singh, Hoa Nguyen, Stephan Steinhauer, Christopher Pursell, Bruce Clemens, Joseph Kioseoglou, Panagiotis Grammatikopoulos, and Mukhles Sowwan*
Hydrogen Flux Through Size Selected Pd Nanoparticles into Underlying Mg Nanofilms
38
Copyright WILEY-VCH Verlag GmbH & Co. KGaA, 69469 Weinheim, Germany, 2016.
Supporting Information
Hydrogen Flux Through Size Selected Pd Nanoparticles into Underlying Mg Nanofilms Sushant Kumar, Theodore Pavloudis, Vidyadhar Singh, Hoa Nguyen, Stephan Steinhauer, Christopher Pursell, Bruce Clemens, Joseph Kioseoglou, Panagiotis Grammatikopoulos, and Mukhles Sowwan*
39
Table I. Lattice Parameters hexagonal Mg
P63/mmc hexagonal Pd P63/mmc
cubic Pd 3 Fm m
α (Å) 3.195 2.767 3.941
c (Å) 5.165 4.630 -
Table II. Cohesive energy per atom (in eV) unstrained strained cubic Pd 5.22 3.60 hexagonal Pd 5.19 4.99
Figure S1: During the Pd/Mg interface relaxations, a reconstruction of the initially cubic Pd (space group:Fm m3 225) near the interface can be observed, due to strain induced by the underlying Mg structure. Pd relaxes to a hexagonal structure, similar to that of Mg (space group: P63/mmc 194). The resulting lattice parameters and respective unit cells of hexagonal Mg, hexagonal Pd, and cubic Pd are presented in Table I and the schematic below, respectively. The energy difference between the hexagonal and cubic Pd is 0.03eV per atom.
The landscape changes dramatically when the strain arising from the accommodation on the interface is applied: the energy difference per atom between the cubic and hexagonal structures becomes ~1.39eV and the hexagonal structure is by far the preferable one. The energies per atom for the two structures in their unstrained and strained forms are shown in Table II.
40
Figure S2: Energy barrier for the diffusion of a hydrogen atom in immediate proximity to a Pd atom in an alloyed Pd0.125Mg0.875 interface. Soft landing of Pd NPs on Mg surface is unlikely to lead to formation of any interfacial Pd-Mg alloy; moreover, in our nanoportal configuration, the total amount of Pd is very low. However, we investigated the effect of potential alloying near the Pd/Mg interface. Even in Pd/Mg films grown by conventional magnetron sputtering, interdiffusion occurs only within a depth of 5 nm;[S1] in our case, there should be limited, if any, intermixing at depth of 1-2 monolayers. Considering Pd-Mg alloys grown by various techniques, amorphous Pd-Mg phases were commonly identified.[S1-S2] This was also confirmed by our DFT investigations, where the alloyed area was amorphized whenever more than one monolayer of Pd-Mg alloy was considered at the interface. A variety of Mg-rich crystal structures were identified in literature, such as fcc-Mg6Pd, hexagonal Mg3Pd, and Mg5Pd2; however, the phase diagram[S3] revealed that the Mg structure is retained up to about13at.% Pd. Therefore, we considered one monolayer of 12.5% Pd in the Mg hexagonal structure at the Pd-Mg interfacial area. It is evident that the crystalline layer of Pd0.125Mg0.875 decreases the energy barrier compared to the sharp Pd/Mg interface by 0.11eV, as the hydrogen atom needs to overcome a barrier of 0.79eV to penetrate into the Mg region.
Hence, it is concluded that a single crystalline monolayer of Pd0.125Mg0.875 alloy leads to a reduction of 12.2% on the energy barrier for the hydrogen diffusion. An almost linear dependence of the diffusion barrier on the Pd concentration is implied.
[S1] K. Yoshimura, S. Nakano, S. Uchinashi, S. Yamaura, H. Kimura, and A. Inoue, Meas.
Sci. Technol. 18 (2007) 3335-3338
[S2] D. J. Jones, J. Roziere, L.E. Aleandri, B. Bogdanovic, and S.C. Huckett, Chem. Mater.
4(3), (1992) 620-625
[S3] J. Makongo, Y. Prots, U. Burkhardt, R. Niewa, C. Kudla, and G. Kreiner, Phil. Mag, 86(03-05) (2005) 427-433