九州大学学術情報リポジトリ
Kyushu University Institutional Repository
新 Al6061-T6 アルミニウム合金の疲労き裂伝ぱ速度 ばらつきにおける Mg誘起加工硬化の役割
サムソル, ファイザル ビン アニス
http://hdl.handle.net/2324/1807021
出版情報:Kyushu University, 2016, 博士(工学), 課程博士 バージョン:
権利関係:
The role of magnesium-induced work hardening on the fatigue crack growth rate scatter in new Al6061-T6
aluminum alloy
A dissertation submitted to the faculty of engineering Graduate school, Kyushu University, Japan
For the degree of doctor of philosophy
presented by
SAMSOL FAIZAL BIN ANIS
March 2017
i
Contents
Abstract ………... iv
List of Tables ………. viii
List of Figures ………... ix
List of Abbreviations ………... xv
Nomenclature ……… xvi
Chapter 1 GENERAL INTRODUCTION 1.1 Motivation ………. ... 1
1.2 Purpose of the research ………... 3
1.3 Thesis outline ……… 4
1.4 References ………. 8
1.5 Tables and figures ………. 11
Chapter 2 Effect of Excess Magnesium on Growth Behavior of Microstructurally Large Fatigue Crack in Precipitation- Hardened Aluminum Alloy 2.1 Introduction ………... 12
ii
2.2 Experimental Procedure ……… 14
2.2.1 Material ……….... 14
2.2.2 Tensile and fatigue tests ……….. 15
2.2.3 Fractographic analysis ………. 16
2.3 Experimental Results ……… 18
2.3.1 Tensile tests ………. 18
2.3.2 Fatigue tests ………. 19
2.3.2.1 S-N curves and fatigue limit characteristics ………… 19
2.3.2.2 Fatigue crack growth behavior on specimen surface … 20
2.3.3 Fractographic investigation ………. 20
2.4 Discussion ……… 24
2.5 Conclusions ………... 33
2.6 References ……… 34
2.7 Tables and figures ……… 41
Chapter 3 An Examination Method for the Interaction Effect of Fatigue Crack 3.1 Introduction ……….. 66
3.2 Stress distribution of a single crack ……….. 68
3.3 Method of solution ………. 79
3.4 Results and discussion ……… 82
3.5 Conclusions ……… 85
3.6 References ………. 86
3.7 Tables and figures ………. 90
iii Chapter 4 Influence of Excess Mg on Fatigue Crack Growth Rate Scatter
4.1 Introduction ……….. 108
4.2 Material characterization ……….. 110
4.3 Experimental Procedure ………... 111
4.3.1 Fatigue test ……… 111
4.3.2 Analysis of fatigue crack growth rate on specimen surface .... 112
4.4 Results and discussion ………. 114
4.4.1 Tensile tests and fatigue tests ……… 114
4.4.2 Fatigue crack growth rate scatter ……….. 115
4.5 Conclusions ……….. 117
4.6 References ……… 118
4.7 Tables and figures ……… 121
Chapter 5 GENERAL CONCLUSIONS 5.1 Conclusions ………... 132
Acknowledgements ………... 135
iv
Abstract
Aluminum alloys 6061 are commonly used in automotive industry because of their corrosion resistance, light weight, high strength, good weldability, and reasonable fatigue resistance. However, there is still the need for improvement of their fatigue properties such as fatigue limit and life. Actually, Al6061-T6 alloys do not have a distinct fatigue limit, and this has prompted investigations of the fatigue behavior of Al6061-T6 alloys with the purpose of establishing a distinct fatigue limit.
For instance, the importance of excess magnesium (Mg) on non-propagating fatigue cracks in Al6061-T6-based alloys has been drawn attention to create the fatigue limit in terms of strain aging.
Although previous studies have indicated a positive effect of excess Mg with regard to the fatigue limit, the behavior of the fatigue crack propagation has not been sufficiently investigated. In addition, Al6061-T6 alloys are also characterized by large scatters of their fatigue life and fatigue crack growth rate (FCGR) compared to steel. Therefore, an understanding of the effect of excess Mg on fatigue crack propagation in a precipitation-hardened Al alloy is actually crucial to developing a design strategy for achieving less scatter fatigue properties of Al alloys.
Hence, the effects of Mg on the propagation characteristics of fatigue cracks in newly developed precipitation-hardened Al6061 alloys containing zirconium (Zr)
v and excess Mg were examined. The main goal of this research is to investigate the advantages of newly developed Al6061-T6 alloys. As a first task, the growth behavior of the microstructurally large cracks was investigated by rotating bending fatigue tests conducted at room temperature, and replication technique with an optical microscope was used to measure the crack growth in the Al alloys. Through analyses of the crack propagation on the surfaces of the alloy specimens, the effects of the excess Mg on the fatigue crack propagation were found to promote the occurrence of Mode I fatigue crack and to decelerate the growth of microstructurally large cracks. These facts suggest that the dynamic strain aging (DSA) of Mg induces the formation of fatigue striation. The findings were supported by the striation ratios analyses in the fatigue crack propagation region.
To extend the investigation, the fractographic observations were used to determine the influence of the excess Mg on the fatigue striations morphology, which represents a Mode I fatigue crack growth. The analysis of striation spacing using the central limit theorem was utilized to investigate the effect of the excess Mg on the fatigue crack growth rate. Moreover, the surfaces roughness at the region of fatigue striations were analyzed using 3D scanning electron microscope (SEM) images to examine the development of the fatigue striation profile. The results found that the excess Mg promotes a shallow fatigue striation profile and this is believed to be due to the uneasy dislocation glides during crack growth, attributed to the DSA effect. In addition, the profile development of fatigue striations in the two investigated Al alloys produces peak-to-valley matching rather than symmetrical matching. Based on these findings, reasonable model of the strain-aging-induced Mode I fatigue crack growth in the Al alloys was proposed. The investigation on the
vi crack growth behavior of Al alloys is important to enhance an understanding of underlying factor affecting the scatter in FCGR.
It is well known that the presence of multiple surface cracks on the structural components has a significant effect on the fatigue life and FCGR scatter because of the influence of fatigue crack interaction. Thus, understanding the interaction effect of fatigue cracks is important because the crack interaction influences the fatigue crack growth behavior, which is affecting the scatter in FCGR. The FCGR is increased by the presence of adjacent crack in the stress amplification region. In contrast, the FCGR is decreased when the adjacent crack is located in the stress shielding region. By analyzing the stress distribution around a single crack and various results from the available literature on stress intensity factors of two cracks interaction, an estimation method is introduced to evaluate the crack interaction between two cracks in a variety of positions subjected to tension under mode I loading condition. The approximate procedure for estimating the crack interaction in arbitrary position is not limited to the case of two-dimension, but also included the case of three-dimension.
Afterwards, the influence of excess Mg on FCGR scatter is examined. To investigate the FCGR scatter, the rotating bending fatigue tests were carried out at constant amplitude loading by using smooth specimen at room temperature.
Observations of the crack growth behavior and measurements of fatigue crack length were performed using microscope and replica technique. According to the fatigue crack growth, the evolution process consists of two periods, namely microstructurally small crack and microstructurally large crack. The scatter of FCGR of microstructurally small cracks can be affected by material surface conditions such as microstructure dimension, surface roughness, and defects. While,
vii in the case of microstructurally large crack, the scatter of FCGR is influenced by material properties, in which the acceleration and deceleration of FCGR is associated with the fatigue resistance of the material. Since the scatter analysis of crack growth rate usually involves a high cost of laboratory experiment due to the use a large number of the test specimens, a method is suggested to evaluate the FCGR scatter using a limited number of the test specimen. The FCGR scatter is examined by considering the crack interaction effects of two surface cracks. From the result of coefficient of variation, it was found that the influence of excess Mg in Al6061-T6 alloy promotes a small scatter on fatigue crack growth rate and easier to generate stable Mode I crack compared to the Al6061-Zr alloy.
viii
List of Tables
Table 2.1 Chemical composition of the precipitation-hardened Al alloys (wt%)
Table 2.2 Mechanical properties of the precipitation-hardened Al alloys Table 3.1 Comparison of two-dimensional crack interaction factor with the
exact results for two collinear cracks in an infinite body (Fig. 3.11(a)) which is subjected to a uniaxial tension
Table 3.2 Comparison of three-dimensional crack interaction factor with the exact results for two collinear cracks (𝑎2⁄𝑎1 = 1) in an infinite medium (Fig. 3.11(b)) which is subjected to a uniaxial tension Table 4.1 Chemical composition of the precipitation-hardened Al alloys (wt%) Table 4.2 Grain size, work hardening exponent and tensile strength of the
precipitate-hardened Al alloys
ix
List of Figures
Figure 1.1 Example of car components are made by aluminum alloys [13]
Figure 1.2 Fatigue crack at a control arm [14]
Figure 2.1 Microstructure of the precipitation-hardened: (a) Al6061-Zr alloy, and (b) Al6061-Zr-Mg alloy
Figure 2.2 Sample geometries (all units in mm): (a) tensile tests, and (b) rotating bending fatigue tests
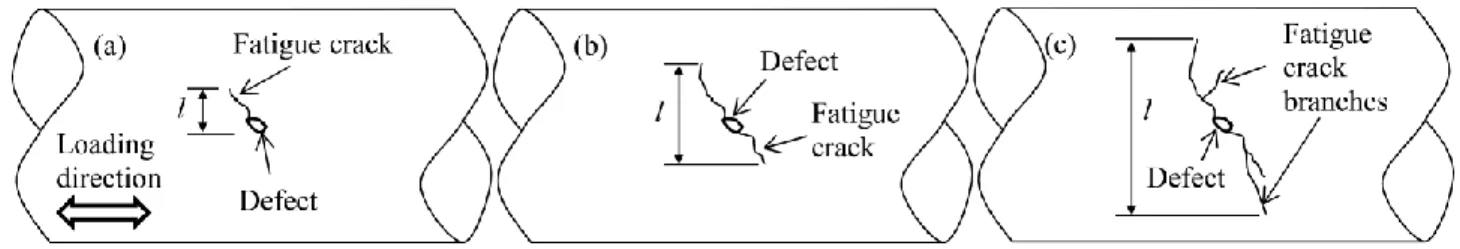
Figure 2.3 Schematic illustrations of crack length measurement: (a) crack initiation at early stage, (b) crack initiation and propagation, and (c) crack propagation with branches
Figure 2.4 SEM images of the fatigue fracture surfaces: (a) magnified image of fatigue crack initiation site, (b) seven regions of fatigue striation evaluation, and (c) size of observation area for each region
Figure 2.5 SEM images of the matching area in Al6061-Zr-Mg alloy: (a) viewed from different side of fracture surface at 3500 μm from crack origin, (b) magnified image of fatigue striation
Figure 2.6 Tensile test results of the precipitation-hardened Al alloys: (a) stress- strain curve, and (b) magnified image of the serration
x Figure 2.7 S-N curves of the Al alloys
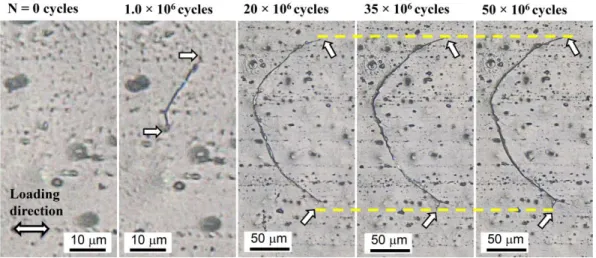
Figure 2.8 Fatigue crack length plotted against number of cycles. These curves indicate fatigue crack non-propagation in the Al6061-Zr-Mg alloy Figure 2.9 The micrographs of non-propagating crack in Al6061-Zr-Mg alloys Figure 2.10 Crack length as a function of number of cycles at the stress amplitude
of 200 MPa
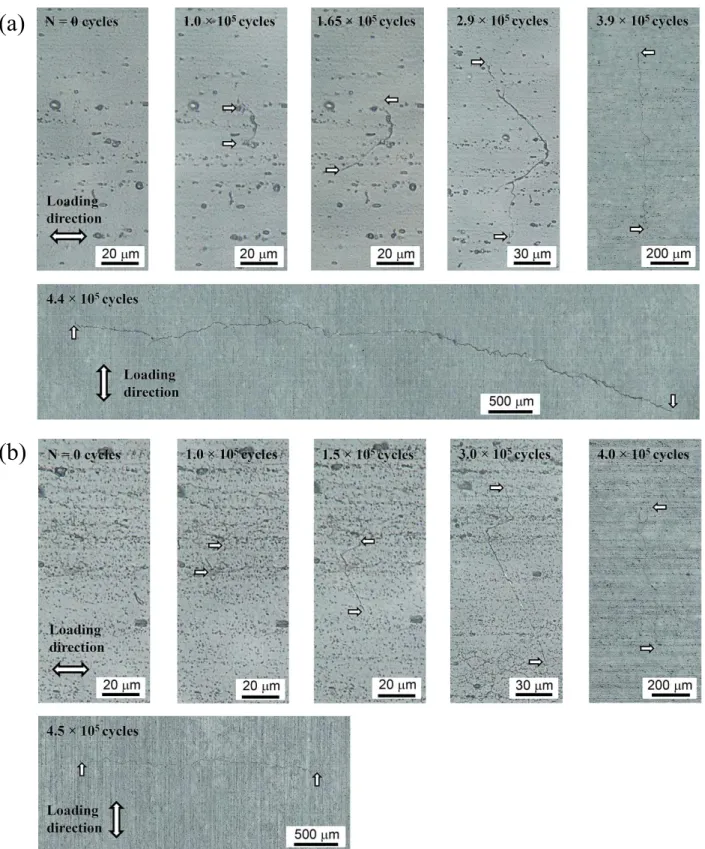
Figure 2.11 Fatigue crack growth behavior of the main cracks were observed by plastic replica technique: (a) Al6061-Zr alloy, and (b) Al6061-Zr-Mg alloy
Figure 2.12 Fracture surfaces with different striation spacing at 4500 µm from crack initiation site: (a) Al6061-Zr alloy, and (b) Al6061-Zr-Mg alloy Figure 2.13 Investigation on the striation spacing of the two Al alloys, which
correspond to the result in Fig. 2.10: (a) Striation spacing as a function of crack growth, and (b) comparison of striation spacing mean
Figure 2.14 Analysis of the striation spacing at 4000 µm from crack initiation site:
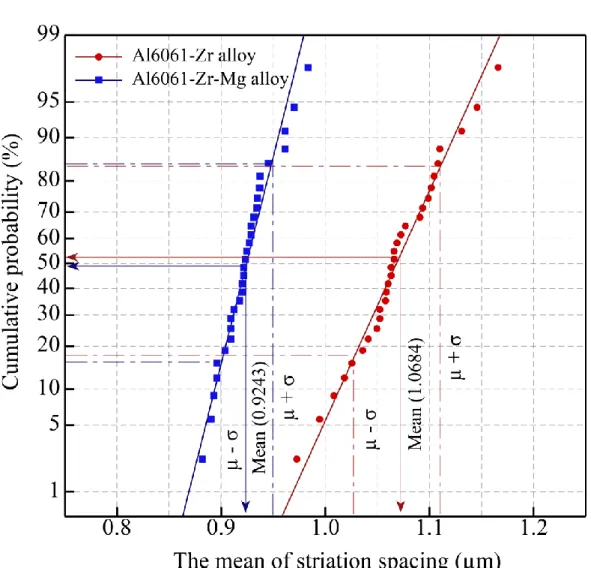
(a) Normal distribution, and (b) normal probability plot
Figure 2.15 Comparison of striation spacing distribution between the two Al alloys
Figure 2.16 Analysis of striation spacing of the two Al alloys: (a) Investigation on samples mean of the striation spacing at six different regions, and (b) comparison between population mean and sample mean of the striation spacing at 4000 µm from crack initiation site
xi Figure 2.17 Striation formation viewed from different side of fracture surface at 3500 μm from crack origin: (a) Al6061-Zr alloy, and (b) Al6061-Zr- Mg alloy
Figure 2.18 Striation ratio as a function of distance from the crack initiation site Figure 2.19 General view of fracture surfaces: (a) A schematic classification of
fracture surface, (b) fracture surface of Al6061-Zr alloy at 3500 µm from crack initiation site, (c) profile development of fracture surface, which correspond to the scanning line in Fig. 2.19(b), (d) fracture surface of Al6061-Zr-Mg alloy at 3500 µm from crack initiation site, and (e) profile development of fracture surface, which correspond to the scanning line in Fig. 2.19(d)
Figure 2.20 3D images of different fatigue striation development at 4000 μm from crack origin: (a) Al6061-Zr alloy, and (b) Al6061-Zr-Mg alloy Figure 2.21 Surface roughness analysis: (a) 2D SEM image of Al6061-Zr alloy,
(b) 2D SEM image of Al6061-Zr-Mg alloy, and (c) graphical roughness profiling
Figure 2.22 Schematic illustration of dislocation motion on the slip plane: (a) loading, and (b) unloading
Figure 2.23 Dislocation model of mode I fatigue crack growth mechanism in the precipitation hardened Al alloys: (a) Al6061-Zr alloy, and (b) Al6061-Zr-Mg alloy
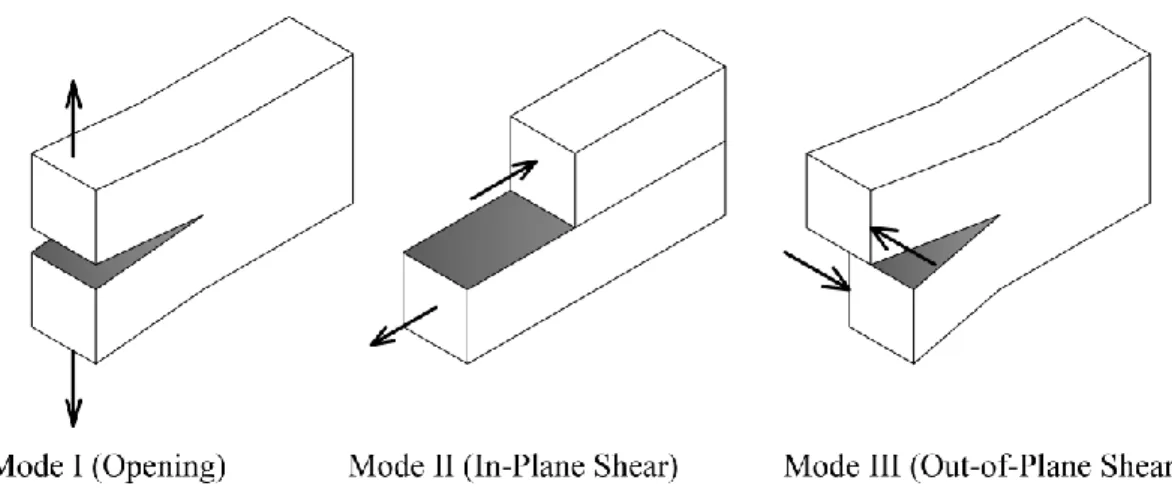
Figure 3.1 The three modes of loading that can be applied to a crack
Figure 3.2 The stress state ahead of the crack tip can be described by the coordinate axis
xii Figure 3.3 Analysis of a straight crack: (a) A crack in an infinite body loaded in
uniaxial tension, and (b) internal crack coordinate systems
Figure 3.4 Analysis of an inclined crack: (a) A crack in an infinite body where the remote stress is not perpendicular to the crack plane, and (b) stress state of an inclined crack
Figure 3.5 The stress component in the vicinity of the crack tip
Figure 3.6 Analysis of an inclined crack: (a) The stress state analysis using Cartesian coordinate system, and (b) stresses on an inclined plane Figure 3.7 The distribution of stress in the neighborhood of a crack
Figure 3.8 Investigation region of the stress distribution around a crack, which is indicated by the dotted boxes: (a) a straight crack, and (b) an inclined crack
Figure 3.9 Interaction of two cracks for two-dimensional crack in arbitrary position: (a) Infinite body under tension, and (b) geometry of the stress analysis
Figure 3.10 Interaction of two cracks for three-dimensional crack in arbitrary position under tension: (a) Infinite body, and (b) semi-infinite body Figure 3.11 Interaction of two cracks in the stress amplification region: (a) Before
coalescence, and (b) after coalescence
Figure 3.12 Interaction of two cracks in the stress shielding region: (a) At 480,000 cycles, and (b) at 500,000 cycles
Figure 3.13 Two-dimensional stress distribution of 𝜎𝑦⁄𝜎𝑜 in the vicinity of a straight crack
Figure 3.14 Two-dimensional stress distribution of 𝜎𝑦⁄𝜎𝑜 in the vicinity of an inclined crack at angle Ø = 15°
xiii Figure 3.15 Two-dimensional stress distribution of 𝜎𝑦⁄𝜎𝑜 in the vicinity of an
inclined crack at angle Ø = 30°
Figure 3.16 Two-dimensional stress distribution of 𝜎𝑦⁄𝜎𝑜 in the vicinity of an inclined crack at angle Ø = 45°
Figure 3.17 Two-dimensional stress distribution of 𝜎𝑦⁄𝜎𝑜 in the vicinity of an inclined crack at angle Ø = 60°
Figure 3.18 Two-dimensional stress distribution of 𝜎𝑦⁄𝜎𝑜 in the vicinity of an inclined crack at angle Ø = 75°
Figure 3.19 Comparison of the stress field of the mixed mode with the mode I using Westergaard function
Figure 3.20 Three-dimensional stress distribution of 𝜎𝑦⁄𝜎𝑜 in the vicinity of a straight crack
Figure 3.21 Two collinear cracks in an infinite body subjected to a uniform uniaxial tensile stress: (a) Two-dimensional case, and (b) three- dimensional case
Figure 3.22 Comparison of crack interaction and no interaction region between two-dimensional and three-dimensional cases
Figure 4.1 Backscatter electron (BSE) images of the grain size: (a) Al6061-Zr alloy, and (b) Al6061-Zr-Mg alloy
Figure 4.2 Tensile tests: (a) sample geometries (all units in mm), and (b) true stress-true strain curves
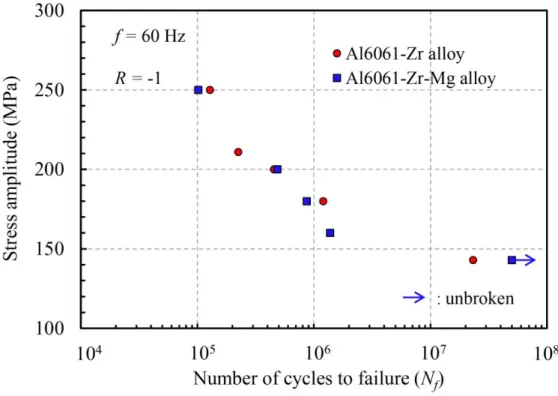
Figure 4.3 Rotating bending fatigue tests: (a) dimension of the fatigue specimen (all units in mm), and (b) S-N curves
Figure 4.4 Three-dimensional fatigue crack interaction diagram
xiv Figure 4.5 Fatigue crack growth curves at the stress amplitude of 200 MPa: (a)
Al6061-Zr alloy, and (b) Al6061-Zr-Mg alloy
Figure 4.6 Global fatigue crack growth rate at the stress amplitude of 200 MPa:
(a) Al6061-Zr alloy, and (b) Al6061-Zr-Mg alloy
Figure 4.7 Coefficient of variation of global fatigue crack growth rate obtained from 15 cracks in the three specimens: (a) Al6061-Zr alloy, and (b) Al6061-Zr-Mg alloy
Figure 4.8 Distribution of FCGR scatter: (a) Al6061-Zr alloy, and (b) Al6061- Zr-Mg alloy
Figure 4.9 Distribution of crack growth rate at each crack length: (a) Al6061-Zr alloy, and (b) Al6061-Zr-Mg alloy
Figure 4.10 Coefficient of variation of the crack growth rate at the stress amplitude of 200 MPa
xv
List of Abbreviations
3D - 3 Dimensional
DSA - Dynamic Strain Aging FCC - Face-Centered Cubic FCG - Fatigue Crack Growth FCGR - Fatigue Crack Growth Rate
Mg - Magnesium
SEM - Scanning Electron Microscope SIF - Stress Intensity Factor
Zr - Zirconium
xvi
Nomenclature
CI - Confidence interval 𝑥̅ - Mean of striation spacing
𝑍 - Value from the normal distribution for the selected confidence level
σ - Standard deviation of a sample n - Number of observation of a sample SR - Striation ratio
AS - Striation area AO - Observation area
Ra - Average roughness profile
Rz - Average maximum height of the roughness profile µx - Mean of striation spacing means
σx - Standard deviation for the mean of striation spacing distribution 𝜎𝑜 - Remote tensile stress
𝜎𝑦 - Stress in y direction
𝑍1 - Westergaard function for Mode I
xvii 𝑍2 - Westergaard function for Mode II
𝜏∞ - Remote shear stress to the crack plane 𝑎𝑜 - Half crack length for an inclined crack 𝑎 - Half crack length for a straight crack
∆𝐴 - Cross section area
𝐹𝑦, 𝐹𝑥′, and 𝐹𝑦′ - Normal force in plane y, x’ and y’, respectively 𝑉𝑥𝑦′ - Shear force
𝜎𝑧 - Stress in z direction 𝑝𝑜 - Applied pressure
𝑊∅ - Stress 𝜎𝑦 in particular crack angle using Westergaard stress function
𝑊∅=0 - Stress 𝜎𝑦 for the case of Mode I crack using Westergaard stress function, in which the crack angle is zero degrees
l - Crack length
N - Number of cycles 𝐶𝑉 - Coefficient of variation S - Standard deviation µ - Mean value of data set
n - Average number of grains intersected by the crack fronts
d - Grain size
𝛾 - Interaction factor
F - Dimensionless Stress Intensity Factor
K’ - Stress Intensity Factor at a point on a crack for the case of multiple cracks
xviii Ko - Stress Intensity Factor at a point on a crack when the crack existed
alone
1
CHAPTER 1. GENERAL INTRODUCTION
1.1 Motivation
Failure is an aspect of engineering which deals with the analysis of engineering structure in order to produce a successful design, materials, and procedures. Fatigue failure is known as the largest cause of failure, and it has been estimated to contribute approximately 90% of all mechanical service failures [1].
Fatigue failures occur when the structure is subjected to repeated loads during their lifetime and the failure is unpredictable due to scatter characteristics. It is also resulting in high industrial costs owing to failure in many engineering components.
It is well known that in most cases, fatigue failure consists of two periods, crack initiation period and crack propagation period. Generally, material surface such as microstructure, surface roughness, corrosion and fretting fatigue damage [2] are playing important role in crack initiation period. Meanwhile, in crack propagation period, a crack tends to propagate perpendicular to the loading direction, and the fatigue crack growth rate (FCGR) depends on the crack growth resistance of the material, which is more influenced by stress state analysis [3]. An important characteristic of this period is the presence of fatigue striation formation that
2 represents Mode I fatigue crack growth [4]. The influence of material variables on crack propagation under Mode I has been subjecting of many research works [5-7].
However, it still has interest from the viewpoint of basic understanding and practical application because of the development of new materials.
Based on the current demand to reduce fuel consumption and CO2-emission, the introduction to automotive lightweight construction based on the use of modified or newly designed aluminum alloys is one of the best solution [8,9]. Reducing the vehicles weight is one of the effective ways for decreasing fuel consumption, in which the fuel consumption is decreased by the reducing the weight of the vehicle.
It has been reported that the fuel consumption decreases by 1 km/L for every 100 kg of weight reduction [10], and according to the European Commission, in 2005 a vehicle should be used only if the mean fuel consumption is 5 liters per 100 km [11].
Moreover, the European Commission has also announced a policy to reduce CO2
emissions down to 130g/km or less in 2012 and it was then followed by Japanese regulations to reduce CO2 emissions [10]. For this reason, lighter materials are being studied extensively, and aluminum alloys move forward to replace the steels.
Accordingly, Al6061-T6 alloy is one of the best solutions because of the requirements for the material properties now not only strength and formability, but also included excellent corrosion resistance and good weldability [10]. Currently, numerous innovative light-weight solutions have been developed by the European aluminum industry which is based on established and further improved aluminum alloys to meet the requirements of car design. The application of aluminum alloys in car parts has increased and not limited to door panels and hoods, but extends to engine blocks, power train parts, space frames, and other structural components [12,13]. Figure 1 shows few example of aluminum alloy product for advanced
3 automotive applications [14]. Meanwhile, Fig. 2 shows an example of car component which has major potential to fatigue failure [15]. Recently, aluminum alloys are being used for a wider variety of car models such as Audi A2, A8, BMW Z8, Jaguar, Honda NSX, Toyota Crown, Nissan Fuga and Subaru Legacy [10,14].
Even though Al6061-T6 alloys have good features such as excellent corrosion resistance, light weight, and good weldability, but, there is the need for improvement. It is known that Al6061-T6 alloys are characterized by less fatigue resistance, no fatigue limit, and large scatters in fatigue life and fatigue crack growth rate (FCGR) [16–18] compared to steel [19]. Therefore, fatigue behavior of this alloy has been subjected to numerous studies to improve fatigue material properties [20,21]. For instance, several researchers [22,23] have developed a new 6061-based alloy with an additional content of Mg, and they have successfully confirmed the ability to generate fatigue limit in face-centered cubic (FCC) metals via fatigue test and coaxing effect test. However, the effect of excess Mg on fatigue crack propagation behavior in the Al6061-T6 alloy has not been investigated sufficiently.
Therefore, this thesis presents few series of investigation on fatigue crack growth behavior of newly developed Al6061-T6 alloys, particularly for the microstructurally large fatigue crack.
1.2 Purpose of the research
The fatigue life can be divided into two stages; microstructurally small crack and microstructurally large crack [24]. The total fatigue life is the sum of the number cycles for fatigue crack propagation in these two regions. In the test performed on small specimens, the fatigue life is dominated by microstructurally small crack, and the scatter in the fatigue life and FCGR are strongly influenced by the fatigue crack
4 initiation period. However, in the tests conducted on large specimens and structures, the investigation on fatigue life and FCGR scatter of microstructurally large fatigue cracks have to be considered because the high percent of fatigue life is occupied by fatigue crack propagation period.
Therefore, the primary objective of this thesis is to examine the advantages of newly developed Al6061-T6 alloys. For this purpose, the fatigue mechanism is clarified, and a simple materials testing is proposed. At the first stage, the research works focus on fatigue crack growth mechanism to enhance an understanding of underlying factor affecting the scatter characteristics, and it is presented in chapter 2. The research work is then followed by introducing the approximate procedures for estimating the crack interaction, and it is described in chapter 3. The findings of the results in chapter 3 are used to evaluate the scatter of FCGR using a limited number of the test specimens, which is presented in chapter 4.
1.3 Thesis outline
The thesis consists of five chapters. All chapters are arranged in order to achieve the main theme and objectives of the research work. The thesis is organized as follows:
Chapter 1 describes a general introduction of the research work. The motivation of the research according to the current issues in engineering materials particularly in automotive industry, the main purpose of the research and the outline of the thesis are highlighted. Based on the current demand to reduce fuel consumption and CO2- emission, the introduction to automotive lightweight construction based on the use of newly designed aluminum alloys is one of the good choices. Accordingly,
5 Al6061-T6 alloy is one of the best solutions because of the requirements for the material properties now not only strength and formability but also included high corrosion resistance and good weldability. However, it is known that Al6061-T6 alloys are characterized by less fatigue resistance, no fatigue limit, and large scatters in the fatigue life and FCGR compared with the current automotive steel. Therefore, the development of new aluminum alloy is needed, and examination of the advantages of new alloy is compulsory.
Chapter 2 presents the experimental efforts. The research work deals with two types of newly developed precipitation-hardened Al6061-T6 alloys, denoted as Al6061- Zr alloy and Al6061-Zr-Mg alloy, and the difference between two alloys are the additional element of Zirconium (Zr) in both Al alloys and the presence of excess Magnesium (Mg) in the latter. The tensile tests were performed using a strain rate of 3×10⁻⁴ s-1 at room temperature to investigate the mechanical properties of newly developed Al6061-T6 alloy. The role of excess Mg to promote DSA phenomenon in Al6061-T6 alloy is noted. Furthermore, the fatigue tests were carried out at room temperature using an Ono-type rotating bending fatigue test machine, a stress ratio R of -1, and a frequency f of 60 Hz (sinusoidal waveform) to examine the different fatigue properties in two investigated Al alloys. The investigation is not only focused on the growth behavior of the microstructurally large fatigue cracks on the specimen surface, but also included the examination on the fracture surface. The replica technique with a microscope was used to observe the crack growth behavior on the specimen surface. Meanwhile, the fractographic features were examined using a scanning electron microscope (JEOL JSM IT300). The investigations on the fracture surface were found that the excess Mg in Al alloys promote the occurrence of Mode
6 I fatigue crack and decelerate the growth of microstructurally large cracks. These findings imply that the dynamic strain aging (DSA) due to the excess Mg induces the formation of fatigue striation and reduce the driving force of the crack propagation. The results were supported by the analysis of striation ratios on the fracture surfaces and striation spacing using the central limit theorem. Furthermore, in order to understand the striation ratio mechanism, the fractographic investigations were devoted to fatigue striation formation using 3D scanning electron microscope images. It was found that the excess Mg promotes a shallow fatigue striation profile, and it was believed to be due to the DSA effect. The finding implies that the Mg- induced work hardening will promote a large number of active slip systems, resulting in a more non-localized slip and a large area of striation formation is generated. As a consequence, the value of striation ratio was high, and this phenomenon probably induces a high stable Mode I crack growth in the Al6061-Zr- Mg alloy. Moreover, the fatigue striations morphology in the two investigated Al alloys produces peak-to-valley matching. Based on the findings of the study, this chapter proposes the reasonable model of the strain-aging-induced Mode I fatigue crack growth in the Al alloys. An understanding of the crack growth behavior of Al alloys is important for predicting the possible factors which influence the scatter in FCGR. Further study would be undertaken to examine the effects of DSA on the scatter characteristics of the two considered Al6061-T6 alloys.
Chapter 3 reports the investigation on the fatigue crack interaction. Stress distribution around a straight crack and an inclined crack were analyzed. Since the limited information about the crack interaction between two cracks in various positions from the available literature, an estimation method is proposed by
7 analyzing the stress distribution around a single crack to evaluate the crack interaction between two cracks in arbitrary position subjected to tension under mode I loading condition. To verify the accuracy of the present method, the results obtained by the present method are compared with the results from stress intensity factor (SIF) handbook for the simple problems involving two collinear cracks. It is found that the results of the present method are in good agreement with the exact solution from SIF handbook, for which the error is less than 4%. The results obtained show that the offset distance is an important parameter to determine the interaction between two cracks. By using the stress distribution in the vicinity of the crack tip of a two-dimensional and a three-dimensional crack, the interaction effects between two cracks in arbitrary position can be approximated.
Chapter 4 presents the influence of excess Mg on FCGR scatter. For this purpose, the rotating bending fatigue tests were performed at constant amplitude loading by using smooth specimen to investigate the scatter behavior of crack growth rate of the two considered Al alloys, in which they are denoted as Al6061-Zr alloy and Al6061-Zr-Mg alloy. In order to investigate the scatter characteristic of fatigue crack growth, statistical analysis is generally used, and it takes a lot of time and involves a high cost of laboratory experiment due to the use a large number of the test specimens. Hence, by considering the crack interaction effects of two surface cracks, a method is proposed to examine the FCGR scatter using a limited number of the test specimen. The secant method was used to calculate the crack growth rate at particular crack length. Furthermore, the coefficient of variation was used to evaluate the FCGR scatter in both Al alloys. The experimental results found that the influence of excess Mg promotes a small scatter on FCGR.
8 Chapter 5 summarizes the results obtained by the present studies, and all findings are described in the general conclusions.
1.4 References
[1] F.C. Campbell. Elements of metallurgy and engineering alloys. ASM International. 2008.
[2] J. Schijve. Fatigue of structures and materials. 2nd Edition. Springer. 2009.
[3] F.V. Antunes, A. Ramalho, J.M. Ferreira. Identification of fatigue crack propagation modes by means of roughness measurements. International Journal of Fatigue. 2000; 22: 781-788.
[4] A.J. McEvily. Metal failures: Mechanism, Analysis, Prevention. 2nd Edition.
Wiley. 2013.
[5] J. Petit, G. Henaff. Stage II intrinsic fatigue crack propagation. Scripta Metall.
1991; 25: 2683-2687.
[6] V.S.Deshpande, A.Needleman, E.Van der Giessen. Discrete dislocation modeling of fatigue crack propagation. Acta Materialia. 2002; 50: 831-846.
[7] Y.Xue, H. El Kadiri, M.F Horstemeyer, J.B. Jorbon, H. Weiland.
Micromechanisms of multistage fatigue crack growth in a high-strength aluminum alloy. Acta Materialia. 2007; 55: 1975-1984.
[8] G.S. Cole, A.M. Sherman. Lightweight Materials for Automotive Applications.
Materials Characterization. 1995; 35: 3–9.
9 [9] W.S. Miller, L. Zhuang, J. Bottema, A.J. Wittebrood, P. De Smet, A. Haszler, A. Vieregge. Recent development in aluminum alloys for the automotive industry. Materials Science and Engineering A. 2000; 280: 37–49.
[10] T. Sakurai. The latest trends in aluminum alloy sheets for automotive body panels. Kobelco Technology Review. 2008; 28: 22–28.
[11] I.N. Fridlyander, V.G. Sister, O.E. Grushko, V.V. Bestenev, L.M. Sheveleva, L.A. Ivanova. Aluminum alloys: Promising materials in the automotive industry. Metal Science and Heat Treatment. 2002; 44: 365–370.
[12] J. Hirsch. Automotive trends in aluminum – The European perspective.
Materials forum. 2004; 28: 15–23.
[13] J. Hirsch. Aluminum in innovative light-weight car design. Materials Transactions. 2011; 52: 818–824.
[14] J. Hirsh. Recent development in aluminum for automotive applications.
Transactions of Nonferrous Metals Society of China. 2014; 24: 1995–2002.
[15] L.B. Godefroid, G.L. Faria, L.C. Candido, S.C. Araujo. Fatigue failure of a welded automotive component. Procedia Materials Science. 2014; 3: 1902–
1907.
[16] R.C. Rice, J.L. Jackson, J. Bakuckas, S. Thompson. Metallic Materials Properties Development and Standardization (MMPDS) Handbook. NTIS Virginia Scientific Report. 2003.
[17] Aluminum Company of America. Alcoa Structural Handbook. Alcoa, Pittsburgh. 1960.
[18] M. Goto, N. Kawagoishi, H. Nisitani, A. Miura. Statistical investigation of small crack growth rate in age-hardened Al alloy 6061-T6. Transactions of the JSME. 1996; 62–595: 671–677.
10 [19] S. Kalpakjian. Manufacturing Engineering and Technology. 3rd Edition.
Addison-Wesley Publishing Co. 1995.
[20] S.G. Irizalp, N. Saklakoglu. High strength and high ductility behavior of 6061- T6 alloy after laser shock processing. Optics and Lasers in Engineering. 2016;
77: 183–190.
[21] A. Salimianrizi, E. Foroozmehr, M. Badrossamay, H. Farrokhpour. Effect of laser shock peening on surface properties and residual stress of Al6061-T6.
Optics and Lasers in Engineering. 2016; 77: 112–117.
[22] T. Shikama, Y. Takahashi, L. Zeng, S. Yoshihara, T. Aiura, K. Higashida, H.
Noguchi. Distinct fatigue crack propagation limit of new precipitation- hardened aluminum alloy. Scripta Materialia. 2012; 67: 49–52.
[23] L. Zeng, T. Shikama, T. Yoshimasa, S. Yoshihara, T. Aiura, H. Noguchi.
Fatigue limit of new precipitation-hardened aluminum alloy with distinct fatigue crack propagation limit. International Journal of Fatigue. 2012; 44: 32–
40.
[24] T. Omura, M. Koyama, Y. Hamano, K. Tsuzaki, H. Noguchi. Generalized evaluation method for determining transition crack length for microstructurally small to microstructurally large fatigue crack growth: Experimental definition, facilitation, and validation. International Journal of Fatigue. 2017; 95: 38–44.
11 1.5 Tables and figures
Fig. 1.1. Example of car components are made by aluminum alloys [13].
Fig. 1.2. Fatigue crack at a control arm [14].
12
CHAPTER 2.
Effect of Excess Magnesium on Growth Behavior of Microstructurally Large Fatigue Crack in Precipitation-Hardened Aluminum Alloy
2.1 Introduction
Precipitation-hardened Al alloys such as Al6061-T6 alloys are widely used for automotive parts and aircraft structures because of their corrosion resistance, light weight, high strength, good weldability, and reasonable fatigue resistance [1,2].
However, there is still the need for improvement of their fatigue limit and life.
Actually, Al6061-T6 alloys do not have a distinct fatigue limit [3] and are also characterized by large scatters of their fatigue life and fatigue crack growth rate (FCGR) [4,5] compared to steel [6]. This has prompted investigations of the fatigue behavior of Al6061-T6 alloys with the purpose of establishing a distinct fatigue limit.
For instance, the importance of excess Mg on non-propagating fatigue cracks in Al6061-T6-based alloys has been drawn attention to create the fatigue limit in terms of strain aging [7,8]. Therefore, an understanding of the effect of excess Mg on
13 fatigue crack propagation in a precipitation-hardened Al alloy is actually crucial to developing a design strategy for achieving high fatigue-resistant Al alloys.
Although previous studies have indicated a positive effect of excess Mg with regard to the fatigue limit, the behavior of the fatigue crack propagation has not been sufficiently investigated, which plays an important role as rate-controlling in the fatigue failure of engineering materials [9]. Considering the criticality of the fatigue life scatter of precipitation-hardened Al alloys, it is necessary to clarify the effect of excess Mg on the fatigue crack propagation to determine the underlying factors that cause the scatter. The concept of a microstructurally small crack [10] was originally introduced based on the effects of the microstructure of the material and the fact that there is little scatter of the fatigue crack growth behavior of microstructurally large cracks in most materials. The boundary between a microstructurally small crack and a microstructurally large crack is usually several times the grain size [11]. However, Al6061-T6 alloys are well known [5] to exhibit a large scatter of their fatigue crack propagation life, even in case of a microstructurally large crack and the fatigue crack path is zigzagged.
To clarify the behavior of a microstructurally large crack in the present study, the characteristics of the fatigue striation in the propagation region was considered to be a primary factor. The basic mechanism of the fatigue striation involves the activation of two alternative slip systems at the crack tip was presented by Neumann [12], in which the first slip step is limited by the work hardening of the activated slip plane [12–14]. The second glide plane will be activated if the maximum tensile stress is reached, and the crack propagation behavior represents a Mode I fatigue crack growth [15,16]. It is thought that dynamic strain aging (DSA) affects the fatigue crack propagation behavior of an Al6061-T6-based alloy.
14 The aim of the present study was to clarify the effect of excess Mg on the behavior of crack propagation in Al6061-T6 alloys, which is an important part as controlling factor in engineering design viewpoint. The effect of DSA on the Mode I crack growth in Al6061-T6 alloys was also investigated fractographically in the propagation region. The analysis of the effect of localized plastic deformation on striation formation was not limited to the striation spacing, but also included the ease of striation development. By investigating the profile development of a fatigue striation, the mechanism of the Mode I crack growth was then explained based on observation.
2.2 Experimental Procedure
2.2.1 Material
This study considered two newly developed precipitation-hardened Al6061- T6-based alloys, the chemical compositions of which are given in Table 2.1. The major distinctions of the two alloys, termed Al6061-Zr alloy and Al6061-Zr-Mg alloy, from ordinary Al6061-T6 alloys are the additional presence of Zirconium (Zr) in both alloys and the presence of excess Magnesium (Mg) in the latter. The excess Mg was used to promote DSA [17–20] which has been reported to assist non- propagation of a fatigue crack in the infinite life regime. Accordingly, a distinct fatigue limit exhibited in the precipitation-hardened Al alloy with excess Mg [7,8].
Shikama et al. [7] reported that the strengths of the Al6061-Mg alloys decreased with increasing content of excess Mg. Therefore, Zr was further added to the Al6061 alloys to improve their tensile strength by decreasing the grain size [21–24].
15 In fabrication stage, billets of the alloys with a diameter of approximately 155 mm were prepared by semi-continuous casting. Homogenization treatment was then performed on the billets at 823 K for 14,400 s. The billets were thereafter extruded to form the round bars with a diameter of 23 mm at 773 K. The extruded round bars were then solution-treated in an air furnace at 813 K for 3,600 s and immediately water-quenched. Finally, T6 aging was performed [25,26] at 463 K for 14,400 s. Fig. 2.1 shows the microstructures of the Al6061-Zr and Al6061-Zr-Mg alloys. Many defects were observed on the surfaces of the alloy specimens, which include voids, inclusions, and pores. The sizes of the defects in both alloys were almost the same, having diameters of roughly 1 - 5 µm.
2.2.2 Tensile and fatigue tests
Plate specimens of the alloys with gauge dimensions of 4 mm wide, 1 mm thick and 30 mm long were used for tensile tests (see Fig. 2.2(a)). The tensile tests were performed using a strain rate of 3×10⁻⁴ s-1 at room temperature. Meanwhile, rotating bending fatigue tests were conducted using specimens with the geometry shown in Fig. 2.2(b). To eliminate the work hardened layer, all the specimens were mechanically polished and subsequently electropolished at 30 V and 323 K in a solution containing 2% gelatin, 1.2% oxalic acid dehydrate, and 96.8% phosphoric acid with a concentration of 85%.
The fatigue tests were conducted at room temperature using an Ono-type rotating bending fatigue test machine, a stress ratio, R of -1, and a frequency, f of 60 Hz. The replica technique was used to observe the fatigue crack behavior on the specimen surface. The crack length was observed by a microscope. Figure 2.3 is a schematic illustration of the measurement of the crack length. The crack length
16 measurement was classified into three categories, namely, crack initiation, crack propagation, and crack growth with branches. The crack length measurement data was used to plot a graph of crack length versus the number of cycles.
2.2.3 Fractographic analysis
The fractographic features were observed using a scanning electron microscope (JEOL JSM IT300). The striation spacing was measured in six different regions, located at about 2000, 2500, 3000, 3500, 4000, and 4500 µm, respectively, from the initiation site of the main crack. Figure 2.4(a) shows a magnified image of the crack initiation site. The initiation point was identified by tracking the direction of the fatigue crack propagation. The presence of a gouge mark was one of the indicators used to determine the crack origin [27]. The average striation spacing was then determined from about twenty striations measured in each selected region.
In addition, the analysis of striation spacing is expanded using the central limit theorem to determine an approximate value of the population mean. In this study, we define the sample mean and the population mean as the value of striation spacing mean and the true value of striation spacing, respectively. It was done in the region of 4000 µm from the crack origin. The central limit theorem states that the distribution of the sample mean tends toward a normal distribution and its standard deviation shrinks when the sample size increases or the samples contain relatively large numbers of observations [28]. In other words, based on the central limit theorem, the sample means become close to the population mean by analyzing a sufficient number of data. Hence, three hundred data with thirty sample sets which contain ten observation data of striations spacing in each Al alloy are examined. The sampling means were rounded up to four decimal places for analysis, and the normal
17 probability plot is then used to assess the normality of the data set [29]. Moreover, the range of the sample mean of striation spacing is calculated using confidence interval (CI) equation as follows:
𝐶𝐼 = 𝑥̅ ± 𝑍 𝜎
√𝑛 (2.1) Where 𝑥̅ is the mean of striation spacing, Z is the value from the normal distribution for the selected confidence level (for a 95% confidence level, Z = 1.96), σ is the standard deviation of a sample, and nis the number of observation of a sample.
To investigate the behavior of the Mode I crack, we evaluated the striation ratios for both Al alloys using measurements at seven different regions located between 500 and 3500 µm from the crack initiation site, as shown in Fig. 2.4(b).
Figure 2.4(c) shows the size of the examination area in each region. The striation ratio SR was calculated as follows:
𝑆
𝑅=
𝐴𝑆𝐴𝑂 (2.2) Where AS is the striation area and AO is the observation area. The observation area was always normal to the electron beam position to prevent inaccuracy in the measurement of the striation spacing and striation area.
Moreover, the fatigue striation morphology of two sides of fracture surface was investigated to determine whether peak-to-peak or peak-to-valley matching.
The matching position was made by selecting two reference points that have the matching signs on both sides of the fracture surface, denoted as P1, P2 and V1, V2 as shown in Figs. 2.5(a)(i) and (ii), respectively. For instance, the peak point P1 in Fig. 2.5(a)(i) corresponds to the valley point V1 in Fig. 2.5(ii). In order to reduce error, two reference points should be selected from different side of fracture surface to confirm the exact location and prevent any inaccuracy due to rotation images. The
18 matching area of fatigue striation was identified by measuring the distance between the two reference points and selected corner of a rectangular area. Figs. 2.5(b)(i) and (ii) show magnified images of the matching area of fatigue striation in Al6061-Zr- Mg alloy. The matching location was then determined by using the same distance between a reference point and selected point.
Furthermore, the roughness profiles of the fracture surface were analyzed using 3D scanning electron microscope (SEM) images. Three SEM images of each Al alloy were obtained by tilting the specimen plane at +5°, 0°, and -5°, respectively, 4000 µm from the crack initiation site. The 3D fracture surface was then constructed automatically using the image processing program called as MeX [30]. To analyze the surface roughness at the formation of striations, the roughness parameters, namely, the average roughness profile Ra and the average maximum height of the roughness profile Rz [31], were examined using the MeX program, which is compliant with ISO 4287:1997 [30]. The implications of the results with regard to striation formation as well as the fatigue mechanism are discussed below.
2.3 Experimental Results
2.3.1 Tensile tests
Figure 2.6(a) shows the results of the tensile tests. As can be observed, the Al6061-Zr alloy has a smooth stress-strain curve. In contrast, there are serrations on the stress-strain curve of the Al6061-Zr-Mg alloy. The magnified image in Fig.
2.6(b), clearly shows the occurrence of serrations. Table 2.2 lists the differences between the mechanical properties of the two types of precipitation-hardened Al alloys.
19 2.3.2 Fatigue tests
2.3.2.1 S-N curves and fatigue limit characteristics
Figure 2.7 shows the graphs of the stress amplitude versus the number of cycles to failure (S-N) of the two types of precipitation-hardened Al alloys. At the finite life regime, Al6061-Zr alloy does not have a fatigue limit, which indicates the occurrence of failure, even after 107 cycles. In contrast, despite the additional Zr content, the fatigue strength of Al6061-Zr-Mg alloy is similar to those determined by previous studies [7,8], with a distinct fatigue limit. This phenomenon is attributed to the effect of strain aging, which strengthens the material around the front of the crack tip. Fig. 2.8 shows three non-propagating cracks at a stress amplitude of 143 MPa, and Fig. 2.9 depicts an example of a non-propagating crack in Al6061-Zr-Mg alloy. The above findings reveal the ability of Al6061-Zr-Mg alloy to resist the growth of a small crack.
It was also observed that the fatigue cracks easily coalesced at high stress amplitudes of about 250 MPa due to the ease of crack initiation. However, many non-propagating cracks occurred at lower stress amplitudes, especially in Al6061- Zr-Mg alloy, owing to the strengthening mechanism in front of the crack tip. This phenomenon was in good agreement with the previous experimental results [32], in which the Vickers hardness was increased by the effect of DSA. Hence, to examine the FCGR with the purpose of minimizing crack coalescence and non-propagating cracks, we focused on a stress amplitude of 200 MPa and investigated the propagation-mode characteristics.
20 2.3.2.2 Fatigue crack growth behavior on specimen surface
The fatigue cracks were initiated at defects on the specimen surface due to the high stress concentrations induced by the defects. The fatigue cracks in Al6061- Zr-Mg alloy were generally initiated earlier than those in the Al6061-Zr alloy and also grew slower after 2×10⁵ cycles, particularly for the main crack as shown in Fig.
2.10. The different tendencies of the crack growth behavior in both Al alloys can be observed from Fig. 2.11. For a more detailed investigation of the Mode I fatigue crack growth behavior, we observed the fracture surfaces using an SEM.
2.3.3 Fractographic investigation
The growth of a microstructurally large fatigue crack involves alternating plastic deformations along two symmetrical slip systems. By fractographic observations, the Mode I fatigue crack growth could be examined based on the formation of fatigue striations on the fracture surfaces and the well-known mechanism for describing the formation of striations, namely, the successive blunting and resharpening of the crack tips [33,34]. Nevertheless, the development of the fatigue striation profile varies with the type of material and is affected by cyclic deformation.
Figure 2.12 compares the fatigue striation spacing of the two Al alloys at 4500 µm from the crack initiation site. The striation spacing of each Al alloy is also plotted as a function of the distance from the crack origin in Fig. 2.13(a). The striation spacing is strongly related to the FCGR [35–37], with the examination of the fatigue striations revealing that the FCGR in Al6061-Zr-Mg alloy propagates about 10% slower than that in the Al6061-Zr alloy, as shown in Fig. 2.13(b). This finding is in good agreement with that of a previous study that utilized specimens
21 with drilled holes, in which the retardation of fatigue crack growth in Al alloys with excess Mg is strongly influenced by local strain hardening around the crack tip [38].
It was reported that the enhancement of strain hardening in the Al alloys with excess Mg can be attributed to its strong strain-aging capability. In addition, by considering thirty sample sets which contain ten observation data of striation spacing for each sample, Fig. 2.14 shows the result of striation spacing analysis at 4000 µm from the crack initiation site in the two Al alloys. The mean of striation spacing means µx and standard deviation for the mean of striation spacing distribution σx are shown in the normal distribution graph in Fig. 2.14(a). The average striation spacing for Al6061- Zr alloy was calculated to be 1.07 µm, while the corresponding value for Al6061- Zr-Mg alloy was calculated to be 0.92 µm. It implies that the FCGR in Al6061-Zr alloy is faster than that in Al6061-Zr-Mg alloy. Figure 2.14(b) shows the probability plot of two Al alloys correspond to the normal distribution graphs in Fig. 2.14(a). It is important to note that, the data of the mean striation spacing in both Al alloys are approximately symmetrical or normally distributed with almost fifty percent of the distribution data is located to the left of the mean and another fifty percent data is distributed to the right of the mean. Besides, nearly sixty-eight percent data of the means striation spacing are distributed within one standard deviation of the mean.
Thus, it can be concluded that three hundred data of striations spacing are enough for the present analysis to make the results consistent with the normal distribution.
According to the central limit theorem, by increasing the number of observations, the mean value of the sample means will not significantly change, but the shape of the bell curve will be narrower. Besides, an analysis result of striation spacing distribution in Fig. 2.15 shows that the striation spacing of Al6061-Zr alloy has a higher standard deviation compared to Al6061-Zr-Mg alloy, which indicates that the
22 data of striation spacing spread out from the mean value. Furthermore, the overlapping regions of two normal distributions in Fig. 2.15 indicates the probability of the same striation spacing or same FCGR between the two Al alloys. Moreover, Fig. 2.16(b) compares the value of population mean and the sample mean of the striation spacing at 4000 µm from crack initiation site. By considering 95 percent of confidence level, which refers to the percentage of the sample mean that can be expected to include the population mean, the true value of the sample mean of striation spacing for Al6061-Zr alloy lies between 1.0152 µm and 1.0936 µm, while the corresponding value for Al6061-Zr-Mg alloy lies between 0.9152 µm and 0.9518 µm as shown in Fig. 2.16(b). The result shows that the mean value of the population of the two considered Al alloys falls within the range of sample mean. Figure 2.17 further shows the SEM photographs of two matching areas on different sides of the fracture surfaces of Al6061-Zr and Al6061-Zr-Mg alloys, indicated by the boxes and arrows. By careful observation, we found that the striation formation in both Al alloys exhibited peak-to-valley matching, as shown in Figs. 2.17(a) and (b). The striation profile in Al6061-Zr alloy is more distinct than that in Al6061-Zr-Mg alloy.
The formation of peak-to-valley matching can also be seen clearly in the observation in Fig. 2.5.
To extend the investigation, we also examined striation areas in both Al alloys. For this purpose, the striation ratios were analyzed to determine the effect of excess Mg in generating the Mode I crack in the propagation region. Based on the topography observation, which are shown in Fig. 2.18, it was found that Al6061-Zr- Mg alloy more easily generated Mode I crack with a larger fatigue striation formation area compared to Al6061-Zr alloy.
23 In addition, Fig. 2.19 show overview of the fracture surface in both Al alloys.
Generally, fracture surface can be classified into four types, namely striation, slant surface, smooth surface, and dimple, in which they are illustrated in the schematic as 1, 2, 3 and 4 respectively (see Fig. 2.19(a)). The development of stable crack growth can be influenced by the slant crack. It was believed that the strain localization can have a significant influence in determining the crack growth behavior of Al alloys. For Al6061-Zr-Mg alloy, in the presence of a high local stress ahead of a crack tip, further damage accumulates as a result of local plastic deformation is limited by the work hardening characteristics of the matrix. However, for a low work hardening material such as Al6061-Zr alloy, the presence of damage zone at a sufficiently high local stress at the crack tip may lead to a localized work- softened zone which results in a strain localization and shear or slant crack [39]. Figs.
2.19(b) and 2.19(d) compare slant crack area in Al6061-Zr alloy and Al6061-Zr-Mg alloy, respectively. In general, this phenomenon induces a local mixed-mode at the crack front even only a pure remote mode I loading is applied, and it may lead instability in crack growth. Moreover, in the absent of striation, fractography observations found that the smooth surface is a dominant area on the fracture surface.
It was believed that crack front interacts with particles or grain boundaries in the matrix structure cause deflections of the crack front from the straight growth direction resulting in heterogeneity and smooth of the crack surface. In some cases, the fracture surface is smooth and almost flat as shown in Fig. 2.19(c). Flat fracture is dangerous in practice because it is associated with a high velocity of crack growth [40]. This enables the stresses to be maintained at high level and encouraging the fast propagation to continue. Since the locations of these types of fracture surface are random, they may induce the scatter in FCGR. Furthermore, dimples were
24 observed in some areas on the fracture surface, indicating ductile fracture and rapid crack propagation mechanism. Dimples pattern was confirmed by observing two sides of fracture surfaces, in which the fracture surfaces demonstrate valley-to-valley matching. Fig. 2.19(e) shows the profile development of fatigue striation. The striations are characterized by the ripples pattern [41], and the fracture surface is generally perpendicular to the loading direction.
To investigate the profile development during the propagation of the Mode I crack, the formation of fatigue striation in Al6061-Zr-Mg alloy was examined by comparing the surface roughness with that of Al6061-Zr alloy. Fig. 2.20 compares the 3D SEM images of the fatigue striation formation in the two Al alloys. From the surface roughness analysis shown in Fig. 2.21, it can be seen that the profile development of the fatigue striation in Al6061-Zr-Mg alloy is comparatively lower than that for Al6061-Zr alloy. The roughness measures Ra and Rz for Al6061-Zr-Mg alloy were determined to be 17.4 and 70.0 nm, respectively, while the corresponding values for Al6061-Zr alloy were determined to be 19.5 and 111.2 nm. This indicates that the fatigue striations in Al6061-Zr alloy were deeper than those in the Al6061- Zr-Mg alloy. Based on these findings, we propose different mechanisms of the fatigue crack propagation in the two precipitation-hardened Al alloys with different Mg contents. These are discussed in the next section.
2.4 Discussion
First, it should be noted that the addition of excess Mg produces a serrated flow, as shown in Fig. 2.6. The serrated flow is attributed to the DSA caused by the excess Mg [42–44]. Moreover, unlike previous results in the absence of Zr [7], the tensile strength of Al6061-Zr-Mg alloy is almost equal to that of the Al6061-Zr alloy,
25 in which the difference is about 5%. This is because of the suppression of grain- coarsening by the added Zr, as indicated by the light micrographs in Fig. 2.1.
Accordingly, the fatigue limit of Al6061-Zr-Mg alloy is also comparable to that of Al6061-Zr alloy. Here, we note an important feature of the S-N relationship for Al6061-Zr alloy, namely, the occurrence of failure after 107 cycles, as indicated in Fig. 2.7. In contrast, Al6061-Zr-Mg alloy does not fail, even after 5×10⁷ cycles. This attribute of the latter alloy is afforded by the excess Mg and has been previously observed [7]. The difference between the fatigue lives at the fatigue limit of the two Al alloys stems from the occurrence of fatigue crack non-propagation in Al6061-Zr- Mg alloy, as shown in Figs. 2.8 and 2.9. The detailed mechanism of the fatigue crack non-propagation, which is related to the existence of DSA, has been discussed in previous works [7,8]. In the present study, we focused on the microstructurally large fatigue cracks in the newly developed Al alloys rather than on the microstructurally small cracks, which were confirmed not to propagate at the fatigue limit.
Through examination of the specimen surface, the crack in Al6061-Zr-Mg alloy was observed to propagate more slowly than that in Al6061-Zr alloy. This trend becomes more distinct with increasing crack length, as depicted in Fig. 2.10. The different tendencies of the crack growth behaviors can be clearly observed from the main cracks in Fig. 2.11. In fact, the clear striations which represent Mode I fatigue crack growth were observed when the FCGR of Al6061-Zr-Mg alloy was significantly lower than that of the Al6061-Zr alloy. Furthermore, as shown in Fig.
2.12, the slower crack growth rate in Al6061-Zr-Mg alloy was supported locally by the smaller striation spacing compared to the case of Al6061-Zr alloy. By determining the average striation spacing in the six propagation regions indicated in Figs. 2.13(a) and (b), the growth of the cracks in Al6061-Zr-Mg alloy was found to
26 be 10% slower than that in Al6061-Zr alloy if the FCGR was strongly influenced by the striation spacing [34–36] or one striation was formed in one cycle. However, the investigation on the fatigue crack growth behavior in the present study is based on;
(i) crack growth behavior on the specimen surface, (ii) discrete data on the number of cycles, and (iii) a limited number of specimens. Problems (i) and (ii) have been discussed from the fractography analysis on the fracture surface. However, problem (iii) remain, and it can be solved using the central limit theorem analysis. It is important to note here that the result in Fig. 2.13 corresponds to the finding in Fig.
2.10, in which the result is referring to the mean value of the sample based on the limited number of the test specimen. Therefore, the analysis of striation spacing is expanded in order to solve the problem (iii) using the central limit theorem to determine an approximate value of the population mean, in which the result can be more useful in terms of material properties. There are two points noteworthy to be considered from the result shown in Fig. 2.14 and Fig.2.15. Firstly, the average striation spacing in Al6061-Zr-Mg alloy was lower than that in Al6061-Zr alloy, which indicates that the slower FCGR in Al6061-Zr-Mg alloy compared to Al6061- Zr alloy. Secondly, it is shown that the distribution of striation spacing data in Al6061-Zr alloy more dispersion than those in Al6061-Zr-Mg alloy. It implies that there was wider variation in the striation spacing data in the Al6061-Zr alloy than in the Al6061-Zr-Mg alloy, which might be attributed to the unstable crack growth behavior in Al6061-Zr alloy compared to Al6061-Zr-Mg alloy because of less tendency in generating Mode I crack. This finding is supported by the result in Fig.
2.18, in which the excess Mg in the Al alloy affects the crack growth mode. The authors believed that the Mg-induced work hardening will promote a large number of active slip systems, resulting in a more non-localized slip and a large area of
27 striation formation is generated [45]. As a consequence, this phenomenon probably induces a high stable Mode I crack growth in Al6061-Zr-Mg alloy. The retardation of the FCGR in Al6061-Zr-Mg alloy might be also due to the high tendency in generating striation formation, as indicated in Fig. 2.18. Besides, by comparing the mean value of the population with sample mean in the two considered Al alloys as shown in Fig. 2.16(b), it could be concluded that the result of Fig. 2.16(a), which represents the finding in Fig. 2.13 is reliable to describe the different material properties of the two Al alloys.
Based on the above findings, the effect of DSA on the microstructurally large cracks was examined locally by investigating the fatigue striation morphology. The DSA is induced by the interaction between solute Mg and the matrix dislocations in Al6061-Zr-Mg alloy, resulting in greater resistance to plastic deformation. In other words, the mobility of the dislocations during crack growth is restricted by the DSA effect. This condition easily generates a pair of alternating slips with many slip traces in Al6061-Zr-Mg alloy. The high deformation resistance of Al6061-Zr-Mg alloy also results in a smaller crack tip opening displacement during the blunting process, and hence a smaller striation spacing compared to Al6061-Zr alloy (an example is shown in Fig. 2.12). In addition, Al6061-Zr alloy has a deeper striation profile compared to Al6061-Zr-Mg alloy, believed to be caused by the greater work hardening of the latter alloy.
Three reasonable mechanisms are thought to generally affect the work hardening of the present Al alloys: (i) dislocation-dislocation interaction, (ii) dislocation-precipitate interaction, and (iii) dislocation-solute Mg interaction. It is considered that mechanism (i) significantly affects the Al-Mg alloy, in which the excess Mg content raises the dislocation density [46]. Hence, Al6061-Zr-Mg alloy
![Fig. 1.1. Example of car components are made by aluminum alloys [13].](https://thumb-ap.123doks.com/thumbv2/123deta/9921432.1921210/31.893.164.752.174.501/fig-example-car-components-aluminum-alloys.webp)