Introduction
Spatial experiences using virtual reality (VR) have attracted much attention because they provide experiences extremely close to reality. Indeed, 2016 was designated the “Year of Virtual Reality.” Its use has been advanced in many fields, and it is expected to have more practical applications in the future.
Previous research, however, has also reported some negative effects of VR. VR experiences occa- sionally cause a kind of motion sickness for users.
Previous studies have termed these negative effects
“VR sickness.” Potel (1998) and Nakagawa et al (1998) overviewed these effects and the present situa- tion of the studies. According to these reports, the general symptoms of VR sickness include pallor, nau- sea, vomiting, salivation, headache, and general discomfort. Moreover, Ono et al (2004) reported that VR sickness is likely to occur in people in their twen- ties, women, those on an empty stomach, and individuals who easily become lightheaded or tired. In addition, males were only mildly affected after approximately ten minutes of VR, while females reported that VR sickness tended to increase with time. Kolasinski (1995) reported that women were more susceptible to VR sickness, as were Asians in
comparison with other races. Ono et al (2005) reported a high correlation between visual weariness and VR sickness. Visual weariness increases when VR sick- ness is observed. However, blood pressure and pulse measurements revealed that while short VR experi- ences did not influence these indicators, an analysis of heart rate showed that a three-dimensional image dis- played on a screen generated a nervous condition.
Yokoi et al (2013) also reported that VR space experi- ences triggered a pleasant mood; however, they also initiated sensitive moods, a type of nervous condition in some cases. Kimura et al (1996) studied the physio- logical effects of VR with the aim of reducing stress among cancer patients. While VR was shown to be effective in reducing pain and stress, VR sickness was also reported to cause stress.
These negative effects of VR are regarded as physiologically problematic and thus have given rise to research on the topic. This study predicted that not only VR sickness but also stress occurs during VR experiences. Hence, we focused on psychological stress during VR experiences. Although cortisol, nor- epinephrine, and salivary amylase activity have mainly been used as stress indices, chromogranin A (CgA) in saliva has attracted attention as a new stress index.
Yamaguchi (2007) reported that CgA is the protein of
RESEARCH ON HUMAN PSYCHOLOGICAL STRESS USING SALIVARY CHROMOGRANIN A IN VIRTUAL REALITY
Azusa YOKOI ・ Yoshikuni EDAGAWA ・ Miho SAITO
Abstract
This study compares psychological stress during a virtual reality (VR) and real room experience. We chose the level of chromogranin A (CgA) in saliva as the physiological stress index. A mood evaluation was also con- ducted to investigate the presence of psychological stress. The target spaces were a room of an ordinary house (real room) and the same room reproduced in VR. The VR experience was associated with lower rates of “fresh” and “feel down” moods and higher rates of “unsettled” and “sensitive” moods than the real room experience, sug- gesting that stress may have been generated during the VR experience. Moreover, there was a significant trend toward higher CgA values in saliva in the VR than in the real room experience. We found, however, a notable and significant trend toward higher CgA values among females than males during the VR experience. These results suggest that gender differences may be an important factor in stress levels during VR experiences.
Keywords: Interior space, Psychological stress, Virtual Reality, Real room, Salivary Chromogranin A, Mood evaluation
the secretory from the chromaffin cells and sympa- thetic nervous system, and the use of CgA in saliva has the advantage of not requiring blood or urine col- lections. Nakane (1999) also reported that CgA in saliva increases at an earlier stage of stress than corti- sol, so is expected to create a novel biochemical index for stress and a more precise evaluation of human feel- ings. These findings thus suggest that CgA in saliva can serve as a high-sensitivity psychosomatic stress index. For these reasons, we chose the CgA level in saliva as the physiological stress index for this study.
We adopted a general use of VR technology in interior space, because such applications are expected to have practical applications in the future. We conducted mood evaluations to investigate the presence of psy- chological stress during VR experiences while consequently measuring CgA in saliva. Because no previous research has yet considered stress generation during VR experience from the perspective of physio- logical and psychological indexes, we chose to incorporate this into our study. Furthermore, following up on previous research on gender differences in VR sickness, we also examined gender differences in psy- chological stress in this research. Our findings will offer useful results for reducing the physiological problems of VR experiences.
Experiment
Subjects. This study had a total of 8 subjects, of whom 4 were females and 4 were male, between the age of 21 and 26 years (average age, 22.38 years, SD
= 1.69).
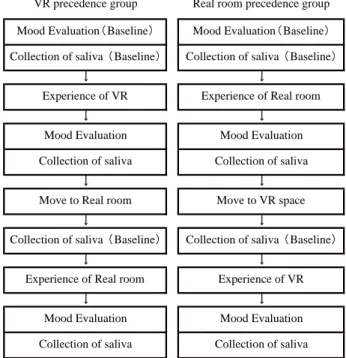
Procedures. The experimental protocol is illus- trated in Figure 1. The influence of space experience (real room and VR space) was taken into consider- ation. Two groups were investigated: one that had previously experienced VR (the “VR precedence group”) and another that had previously experienced the real room (the “real room precedence group”), Subjects were randomly assigned to each group, but in a gender ratio of 1:1. Mood evaluation and saliva col- lection were performed on each subject during the VR and real room experiences. Subjects were able to walk freely and were able to travel inside the targeted space before saliva collection and mood evaluation. Experi- mental time for each subject was approximately two minutes for VR and five minutes for the real room;
however, no time limit was imposed. Baseline values were established at the beginning of each trial. The mood evaluation was conducted at the beginning of the experiment, while the saliva collection was per- formed before the experiences of each space. Subjects were asked about VR sickness after the VR experience in the self-enumeration section. Den et al (2007) reported that CgA levels were low throughout the day and high upon awakening and late at night. All the experiments were conducted between 1 and 5 pm.
This research was approved by the academic research ethical review committee of Waseda University (Approval No.2011-159).
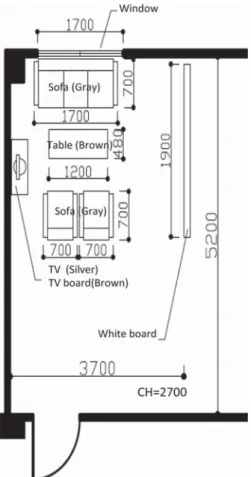
Target space. The target spaces were a basic room of an ordinary house and the same room reproduced in VR. The subjects took approximately ten minutes to walk to each of the sites, which were created by cor- doning off a corner of the laboratory with a white board. However, subjects were told to evaluate the tar- get space using a white board that other parts of the room might not enter in subjects’ view. The room con- tained furniture including a sofa, table, and television.
The floor plan of the target space is shown in Figure 2.
VR system. The VR system used in this study cre- ated an image that enabled corporal vision through binocular disparity. We used 3dsMax by Autodesk to recreate the real room using computer graphics. Ome- gaSpace3.1.2 from the Solidray Institute was used to
Collection of saliva Mood Evaluation
VR precedence group Mood Evaluation Baseline
Experience of VR
Real room precedence group Mood Evaluation Baseline
Experience of Real room
Mood Evaluation Collection of saliva Baseline Collection of saliva Baseline
Collection of saliva Baseline
Experience of Real room
Mood Evaluation Collection of saliva Collection of saliva
Collection of saliva Move to Real room
Mood Evaluation Move to VR space
Collection of saliva Baseline
Experience of VR
Figure 1. Experimental protocol.
render the image; this was a time-division system with a resolution of 1024 × 768 pixels and a three-dimen- sional scenography frequency of 120 Hz. The image was projected onto an L-shaped screen comprising two panels and two “Sight 3D U27” (luminescence
light flux 2700 lm) projectors, along with a rear pro- jection system for the front screen and a front projection system for the floor screen. The front and floor screens were 2000 mm high and 2667 mm wide.
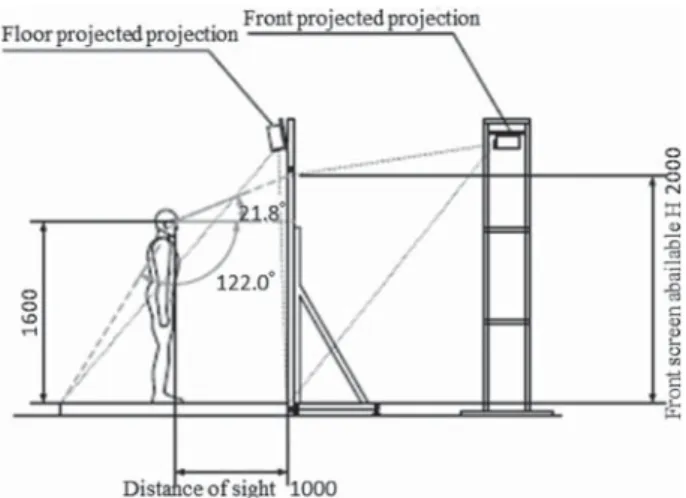
Moreover, the study enabled corporal vision in response to the images by equipping subjects with 3D glasses from NVIDIA’s “3D Vision” kit. The lights in the experiment room were switched off and subjects were given approximately thirty minutes to adapt to the darkness while receiving directions from the researchers before putting on the 3D glasses for the VR experience. Subjects stood in the center of the room; a position about 1000 mm and with a standing viewpoint of about 1600 mm was determined. The viewing angle to the screen was about 106 degrees;
the perpendicular viewing angle was about 22 degrees for the upper parts of the image, and 90 degrees or more for the lower parts. The CG image used in the study is shown in Figure 3. The viewing angle, view- point distance, and a screen size are shown in Figures 4 and 5. A photograph of the VR system is shown in Figure 6. Subjects received instruction on the opera- tion of a wireless gamepad, which they used to move around inside the image, and they were allowed to familiarize themselves with the VR space for several minutes before the investigation. Subjects were allowed to move freely around inside the image using the gamepad and could also move freely into the mov- able region on the actual floor screen.
Figure 2. Floor plan of the object space.
Figure 3. CG image used in this study.
Physiological indicator. CgA and protein concen- trations in saliva were measured for each participant.
The saliva collection kit (made by Yanaihara Institute Inc.) contained a test tube and two cotton swabs were used. Mathematical analysis of the measurements was provided by the Yanaihara Research Institute. For saliva collection, participants held the cotton in their mouths for two minutes before experiences for each space; measurements from these samples were consid- ered the baseline values. Saliva was then extracted during experiences in each space using the same pro- cedure. The CgA level from this sample was assigned a numerical value (“CgA value”) reflecting the CgA concentration divided by protein concentration.
Mood evaluation. Evaluation words were chosen by considering their appropriateness for stress evalua- tion. We referred to the Profile of Mood States (POMS) and previous studies such as Saito (2005) and Miura et al (2008) for our mood evaluation scale, and we identified several mood evaluation words appropri- ate for the stress evaluation in this research. Fifteen words were selected (pleasant/calm/irritated/fresh/
dark/relaxed/safe/easy/disgust/feel down/fine/positive/
unsettled/sensitive/tired), and a seven-point scale (very much applied/considerably applied/little applied/not applied/not little applied /not considerably applied/not very much applied) was imposed. Moreover, subjects were instructed to take the mood evaluation at the start Figure 4. A level viewing angle, viewpoint distance,
and a screen size.
Figure 5. A perpendicular viewing angle, viewpoint distance, and a screen size.
Figure 6. Photograph of the VR system.
of the experiment as a baseline measurement, and retake it during their experiences in each space. The results were computed to determine any changes from the baseline value.
Analysis of the results. The date varied and did not assume a normal distribution; therefore a nonparamet- ric test was conducted for statistical analysis. The Wilcoxon rank sum test with a mark was performed to measure the CgA value in saliva, mood rating scale values for VR and real rooms, and gender differences in CgA values in saliva. The Mann-Whitney U test was performed to examine gender differences in mood.
Results
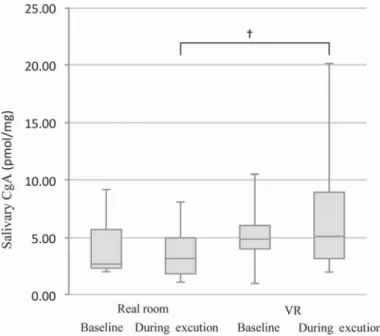
Salivary CgA in the real room and VR space. The median CgA saliva values in each space are shown in Figure 7 by box-and-whisker plots. The CgA value in saliva for the VR space was higher than that for the real room. Moreover, CgA values in saliva during the real room experiences tended to be lower than the baseline values for the real room experiences on the whole. On the other hand, CgA values in saliva during VR experiences were higher than the baseline for the VR experiences on the whole. Furthermore, the range of measurements during VR experiences reflected higher overall values than those taken during the real
room experiences. These results indicate that individ- ual differences strongly influence the stress resulting from VR experiences. To statistically examine the dif- ferences in CgA values in saliva in each space, the Wilcoxon rank sum test with a mark was conducted on the baseline and experience values for each space.
There was a significant trend between the values extracted during the experiences in each space (Z = 1.68, p < .1).
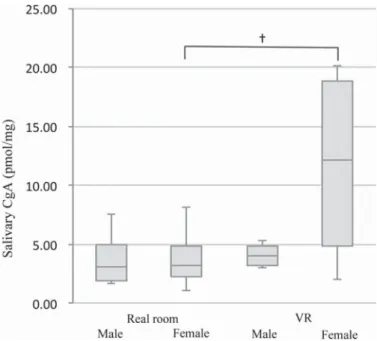
Salivary CgA by gender. Gender differences can be determined on the basis of previous research on stress in VR spaces. For this analysis, subjects were divided by gender. Figure 8 shows the median CgA saliva values by gender with box-and-whisker plots.
To compare the values for the VR and real room experiences, baseline values were omitted from this figure. While the CgA values for saliva were almost the same for both genders during the real room experi- ence, CgA values for saliva during the VR experience were notably higher for female participants. The Wil- coxon rank sum test with a mark was conducted on the VR and real room experience values for each gender to analyze gender differences. Although no significant difference was identified between the CgA values in saliva for the VR and real room experience among males, a significant trend was identified between the VR and real room experience by females (Z = 1.83, p
< .1).
Figure 7. Box-and-whisker plots for the CgA values in each space. The top and the bottom of the whisker indicate the maximum and the minimum values, respectively. The top and the bottom of the box represent the third and the first quartile, respectively. The line in the box shows the median. The dagger shows the sig- nificant trends ( p< .1) identified using the Wilcoxon rank sum test.
Mood evaluation in the real room and VR space.
Variations in mood between the baseline value and during-experience values in each space were calcu- lated. The median of the variation from the baseline value is summarized in Table 1, and the average value of the variation is summarized in Figure 9. Although most of the mood evaluation values during the real room experience tended to be higher than those during the VR experience, reports of “pleasant,”“unsettled,” and “sensitive” moods were found to be higher during VR experiences. For statistical examination of the mood evaluation value differences for each space, the Wilcoxon rank sum test with a mark was conducted on the variation. A significant difference was identified for “fresh” (Z = 2.06, p < .05) and “feel down” (Z = 2.26, p < .05) moods, and a significant trend was iden- tified for “unsettled” (Z = 1.86, p < .1) and “sensitive” (Z = 1.66, p < .1) moods. The VR experience was associated with a lower rate of “fresh” and “feel down” moods and a greater rate of “unsettled” and
“sensitive” moods. It was thus considered difficult to obtain a “fresh” feeling from the VR, as opposed to from the real room experience. Subjects who had experienced the VR space indicated that it was diffi- cult to sense natural light (which was present in the real room) and that it was difficult to experience feel-
ings as intensely during the VR experience as during the real room experience. Moreover, although values for “pleasant” were higher and values for “feel down” were lower during the VR experience than during the real room experience because of the ability of interest- ing tools, values related to physical stress, such as
“unsettled” and “sensitive,” were negatively influ- enced. It is possible that unrealistic and unfamiliar actions during the VR experience, such as wearing 3D glasses, operating a game pad controller, and moving in a dark room, were responsible for these results.
Mood evaluations by gender. The median for vari- ation in mood evaluation for each space by gender is shown in Table 2. The average values by gender for variation in mood evaluation in the VR space are shown in Figure 10. Although no statistically signifi- cant differences by gender were found by the Mann- Whitney U test on mood values, females tended to report lower rates of “calm,” “fresh,” and “relaxed” feelings than males, while males tended to experience higher rates of “irritated,”“unsettled,” and “sensitive” feelings.
Correlation between CgA level and mood evalua- tion. To examine the correlation between CgA level and mood evaluation, a correlation test was conducted.
No statistically significant difference was found between CgA level and mood evaluation.
Figure 8. Gender-based box-and-whisker plots for the CgA value in each space. To compare the values for VR and real room experiences, baseline values were omitted from this figure. The top and the bottom of the whis- ker indicate the maximum and the minimum values, respectively. The top and the bottom of the box represent the third and the first quartile, respectively. The line in the box shows the median. The dagger shows the significant trends (p< .1) identified using the Wilcoxon rank sum test.
Figure 9. Average mood evaluation variation between the baseline values and the values reported during the experiences in each space. The asterisks and the daggers show the significant differences or trends (p< .1, *p< .05) identified in the Wil- coxon rank sum test.
Figure 10. Gender-based average mood evaluation varia- tion between the baseline values and the values reported during the experiences in VR space.
No statistically significant difference was found by the Mann-Whitney U test.
Table 2.
Gender-based median of mood evaluation variation from the baseline value for each space.
Real room VR
Male Female Male Female
Pleasant 0.5 0.5 1.0 0.5
Calm 0.5 ‑0.5 0.5 0.0
Irritated 0.5 ‑1.0 0.5 ‑1.0
Fresh 1.0 ‑0.5 ‑0.5 ‑1.0
Dark 0.5 0.5 0.5 ‑0.5
Relaxed ‑0.5 1.0 0.0 ‑1.0
Safe 0.0 0.5 ‑0.5 ‑0.5
Easy 0.0 ‑0.5 0.0 ‑0.5
Disgust 0.5 0.0 1.0 0.0
Feel down 1.0 0.0 0.0 ‑0.5
Fine 0.0 0.0 ‑0.5 ‑0.5
Positive ‑0.5 0.5 ‑1.0 0.5
Unsettled 1.5 ‑1.5 1.5 0.0
Sensitive 0.0 0.0 1.0 ‑0.5
Tired ‑0.5 0.5 ‑0.5 0.0
Table 1.
Median of mood evaluation variation from the baseline value for each space.
Real room VR
Pleasant 0.5 0.5
Calm 0.0 0.0
Irritated ‑0.5 ‑0.5
Fresh 0.0 ‑1.0
Dark 0.5 0.0
Relaxed 0.0 ‑0.5
Safe 0.0 ‑0.5
Easy 0.0 0.0
Disgust 0.0 0.5
Feel down 0.5 0.0
Fine 0.0 ‑0.5
Positive 0.0 ‑0.5
Unsettled 0.0 1.0
Sensitive 0.0 0.0
Tired 0.0 0.0
Discussion
This study focused on stress occurring during VR experiences. In the results, we found that salivary CgA levels were marginally higher during the VR experi- ence than during the real room experience, and salivary CgA levels were also marginally higher for females than for males. Furthermore, unsettled and sensitive moods increased and fresh and feel down moods decreased during the VR experience.
A significant difference was identified for fresh and feel down moods, which tended to be lower dur- ing the VR experience, and a significant trend was likewise identified for unsettled and sensitive moods, which tended to be higher during the VR experience.
On the other hand, the results of the statistical exami- nation of the CgA value in saliva were no more than significant trends. These results suggested that the VR experience triggered psychological effects but did not significantly affect physiological stress. Yokoi et al (2013) asserted that VR spaces trigger pleasant moods, but one’s first experience with a virtual space causes a nervous condition. In this research, most of the sub- jects had experienced virtual space for the first time.
An unfamiliar VR operation and experience room were considered to have affected the mood evaluation in this research. Although no significance gender dif- ferences emerged for mood evaluation, we can assert that calm, fresh, and relaxed moods were less common for females than for males. One possible reason was that unlike the males in the study, the females were unaccustomed to using a wireless gamepad. A differ- ence observed while the participants operated the gamepad prior to the experiment was that the males tended to become accustomed to operating the game- pad before any of participants (females and males) mentioned whether they knew how to use a wireless gamepad. The results also showed that irritated, unset- tled, and sensitive moods increased in males. These results also suggested that most males were accus- tomed to using a wireless gamepad while playing video games. However, the response of the VR content using the wireless gamepad was slow compared with ordinary video games; thus, it was possible that the male subjects were also overwhelmed. Conversely, the significant differences in CgA values in saliva in females between the VR and real room experiences demonstrated an interesting result: Previous research-
ers, such as Ono et al (2004) and Kolasinski (1995) found that females were more prone to VR sickness than males. Kimura (1996) reported an increased heart rate in subjects who experienced heavy VR sickness.
These results are also considered to be related for stress; however, the self-enumeration methods used in this research for VR sickness following the VR experi- ence indicated that none of these subjects reported severe VR sickness. On the other hand, Ono et al (2004) reported that females’ VR sickness tended to increase with the amount of time spent inside the VR space, and Ono et al (2005) reported that short VR experiences do not influence blood pressure and pulse, which are related to the sympathetic nervous system.
The shorter VR experience (no longer than ten min- utes) in this study may explain why the difference in females’ CgA value between the VR and real room experiences failed to reach statistical significance.
However, it appears that there is a need for further consideration of gender differences in stress genera- tion during VR experiences.
This research also has some limitations. The VR system and model of the interior space in this research was only one instance of such a contrast, so provides only the possibility of limited interpretation. Also, the small number of participants might have affected the results in this research. Therefore, more case studies must be conducted and further examination is needed of psychological stress and mood during VR experi- e n c e s , t a k i n g g e n d e r d i f f e r e n c e s i n t o f u l l consideration. Moreover, further research is needed toward identifying factors for refining VR space to reduce psychological stress.
Conclusions
This study used CgA in saliva as a psychological stress index along with a mood evaluation of eight subjects. After comparing the data obtained from the VR room and real room, a significant trend was observed in the CgA values of saliva in the VR and real room experiences. Moreover, after a comparison of the data obtained from gender differences, a signifi- cant difference was observed for females in the CgA values in saliva between the VR and real room experi- ence, while no significant difference was found in males. Furthermore, rates of unsettled and sensitive moods were higher, and rates of fresh and feel down moods were lower, during the VR experience.
References
Den, R., Toda, M., Nagasawa, S., Kitamura, K., & Morimoto, K. (2007). Circadian rhythm of human salivary chromo- granin A. Biomedical Research, 28(1), 57-60.
Kimura, M., Ohsuga, M., Okamura, H., & Oyama, H. (1996). A basic study on human stress reduction using Virtual Real- ity technology. IEICE technical report. Multimedia and virtual environment, 96(82), 89-96. (in Japanese with Eng- lish abstract)
Kolasinski, M. (1995). Simulator sickness in Virtual Environ- ments. United States army research institute for the behavioral and social sciences technical report, 1027 Miura, K., & Saito, M. (2008). Effects of fragrance-color com-
bination during recovery after stress loading: using CgA for stress parameter. Aroma Research, 36(9), 362-366. (in Japanese with English abstract)
Nakagawa, C., & Ohsuga, M. (1998). The present situation of the studies in VE-sickness and its close field. Journal of the Virtual Reality society of Japan, 3(2), 31-39. (in Japa- nese with English abstract)
Nakane, H. (1999). Salivary chromogranin A as index of psy- chological stress response. R&D Review of Toyota CRDL, Toyota Central R&D Labs., Inc., 34(3), 17-22. (in Japanese with English abstract)
Ono K., Yoshizawa, N., & Hirate, K. (2004). Preliminary con- siderations on the impression evalulation and VR sickness with different properties of subjects: Basic studies on the presentation and evaluation of residential environment with the VR technique Part 1. Journal of environmental engineering (Transactions of AIJ), (583), 65-71. (in Japa- nese with English abstract)
Ono, K., Oyama, Y., Yoshizawa, N., Sano, N., & Hirate, K.
(2005). Considerations on VR sickness for weariness and physiological responses: Basic studies on the presentation and evaluation of indoor environment with VR technique Part 2. Journal of environmental engineering (Transactions of AIJ), (594), 77-83. (in Japanese with English abstract) Potel, M. (1998). Motion sick in cyberspace, Computer Graph-
ics and Applications, IEEE, 18, 16-21. doi:10.1109/
38.637264
Saito, M.(2005). Psychological and physiological effects of the combination of fragrance and color. Aroma Research, 21(6), 82-87. (in Japanese with English abstract)
Yamaguchi, M. (2007). Stress evaluation using a biomarker in saliva. Folia pharmacologica japonica, 129, 80-84. doi:
10.1254/fpj.129.80 (in Japanese)
Yokoi, A., & Saito, M. (2013). A study of evaluation on psycho- logical effects of virtual reality in a residential environment:
The evaluation of Kansei on the VR system for simulation of a residential environment using a large screen. Journal of environmental engineering (Transactions of AIJ), 78(683), 1-7. (in Japanese with English abstract)
Yokoyama, K., & Araki, S. (1994). Japanese version of POMS.
Kaneko Syobo. Tokyo.