Article
Resistivity Structure of the Hiyoriyama Cryptodome
at Kuttara Volcano, Hokkaido, Japan
Yoshihiko G
OTO*and Akira J
OHMORI** (Received March 1, 2012; Accepted March 15, 2013)Direct current (DC) electrical and controlled source audio-frequencymagnetotelluric (CSAMT) surveys were performed over the Hiyoriyama Cryptodome in Kuttara Volcano, Hokkaido, Japan. Both surveys were performed on the same surveyline across the cryptodome in a NE‒SW orientation. Two-dimensional joint inversion of the DC electrical and CSAMT data revealed the underground resistivitystructure at depths less than 400 m beneath the cryptodome. The resistivitystructure suggests that the cryptodome comprises a dacite intrusion of 150 m wide and 80 m thick (20-50 Ω・ m), and overlying pyroclastic deposits that are 10-30 m thick (>100 Ω・m). The dacite intrusion is underlain bya convex-shaped, low-resistivitylayer (<5 Ω・m) that is interpreted to be smectite-rich, altered pyroclastic deposits that have been subjected to low-temperature (<200℃) hydrothermal alteration. The low-resistivity layer is underlain by a slightlyhigher-resistivitylayer (10-30 Ω・m) that is interpreted to be altered pyroclastic deposits that were subjected to higher-temperature (> 200℃) hydrothermal alteration in a relatively deep, hot region near the conduit of the cryptodome.
Key words: resistivity structure, DC electrical method, CSAMT method, Hiyoriyama Cryptodome, Kuttara Volcano
1.Introduction
Resistivitysurveying provides valuable information on the underground geological structures of active volcanoes (e.g., Risk et al., 2003; Aizawa et al., 2008; Srigutomo et
al., 2008). We performed direct current (DC) electrical (for
details of the method, see Milsom, 2003) and controlled source audio-frequencymagnetotelluric (CSAMT) surveys (see Sandberg and Hohman, 1982) at the Hiyoriyama Cryptodome in Kuttara Volcano, southwestern Hokkaido, Japan, in order to investigate its internal structure. The cryptodome is inferred to have formed by the uplift of pre-existing pyroclastic deposits due to the intrusion of dacitic magma (Katsui et al., 1988), but its internal structures are poorlyconstrained. This paper presents the results of the resistivitysurveys and discusses the nature of subsurface geological structures beneath the cryptodome.
2.Hiyoriyama Cryptodome
The Hiyoriyama Cryptodome is located in the northern area of the Noboribetsu Geothermal Field, in the western part of Kuttara Volcano (Fig. 1). The volcano consists mainlyof an andesitic stratovolcano (summit at 549 m above sea level) with a small caldera at the summit (Lake Kuttara). The volcano evolved over the period 80-45 ka, involving earlysilicic explosive activityand subsequent
stratovolcano building associated with caldera collapse at 40 ka (Katsui et al., 1988; Yamagata, 1994; Moriizumi, 1998; Moriya, 2003).
The Noboribetsu Geothermal Field, which is inferred to have formed after the collapse of the caldera (Katsui et al., 1988), is approximately1 km wide (NE‒SW) and 1.5 km long (NW‒SE) (Fig. 1). The geologyof the Noboribetsu Geothermal Field consists mainlyof pyroclastic deposits erupted from Kuttara Volcano (mainlythe Kt-1 pyroclastic flow deposit; Moriizumi, 1998). The deposits are >200 m thick (NEDO, 1991) and consist of dacitic pumice clasts up to tens of centimeters in diameter.
The Hiyoriyama Cryptodome (Fig. 2) is elliptical in plan view, ranging in diameter from 350 m (NE‒SW) to 550 m (NW‒SE). In cross-section, it has a pyramidal form with steeplysloping sides (Fig. 2A). It rises 130 m above the surrounding area, with the highest point being 377 m above sea level. The surface of the cryptodome is covered with pyroclastic deposits (<15 m thick) that were uplifted by growth of the dome (Katsui et al., 1988). The cryptodome has an explosion crater (Hiyoriyama Summit Crater; Fig. 2B) at its summit. The crater is 40×95 m in area (elongate along a NW‒SE axis) and 20 m deep, and contains active fumaroles (Goto et al., 2011a, b) with a maximum tempera-ture of 134℃ (measured on 6 July2009). The slopes of the
590-0521, Japan.
Corresponding author: Yoshihiko Goto e-mail: [email protected] College of Environmental Technology, Graduate School
of Engineering, Muroran Institute of Technology, Mizumoto-cho 27-1, Muroran, Hokkaido 050-8585, Japan. Neo Science Co., Ltd., Tarui 4-2-30, Sennan, Osaka *
cryptodome are widely covered with dense vegetation, apart from the southeastern slope that has been severely eroded bypast phreatic eruptions from Oyunuma Lake (Fig. 2A). Fission-track dating indicates that the cryptodome formed at ca. 15 ka (Goto and Danhara, 2011).
The dacite intrusion beneath the Hiyoriyama Crypto-dome is exposed on the wall of the Hiyoriyama Summit Crater, and is massive with columnar joints spaced at intervals of 1. 0-1. 5 m. The dacite is generallyhydro-thermallyaltered, although fresh dacite occurs sporadically at the crater rim. The fresh dacite is greyand porphyritic, containing phenocrysts of plagioclase, quartz, hypersthene, and trace amounts of augite, opaque minerals, and horn-blende. The groundmass is granophyric, containing silica minerals, feldspars, and opaque minerals.
Geomorphological studies (Goto et al., 2011a) suggest that the growth of the Hiyoriyama Cryptodome caused damming of a river and the deposition of sediments behind the dam, resulting in the formation of a plain to the northeast of the dome (Hiyoriyama Plain; Fig. 2B). The Hiyoriyama Plain is semi-rectangular in plan view, being 300 m (NW‒SE)×800 m (NE‒SW) in size, and is covered by short bamboo and grasses. Drilling of the Hiyoriyama Plain (unpublished data) has revealed a 15-m-thick layer of peat underlain byfresh pyroclastic deposits (>6 m thick).
3.Resistivity surveys
The DC and CSAMT surveys were performed to obtain a continuous resistivitystructure at depths of up to 400 m beneath the Hiyoriyama Cryptodome. The two surveys were performed on the same surveyline, which crosses the Hiyoriyama Cryptodome in a NE‒SW orientation (Figs. 2B and 3). Given that the cryptodome is elongated in a NW‒SE orientation (Fig. 3), the feeder dyke that is the magma conduit beneath the dome is inferred to strike NW‒SE (Goto et al., 2011a). The NW‒SE-trending feeder dyke probably occurs below the summit of the cryptodome (location M6 in Fig. 3). The surveyline was oriented in such a wayas to obtain a resistivitysection perpendicular to the inferred feeder dyke.
3-1 DC electrical survey
The DC electrical surveywas performed using the ‘high-densityelectrical prospecting’ method (Matsuoka, 2005), which employs a number of electrodes that are laid out on the ground surface in an array. In this method, a transmitter injects electrical currents to a pair of current electrodes, and the electric potential is measured using a pair of potential electrodes. The distance between the current electrodes and the potential electrodes dictates the depth of measurement. The resistivitystructure is usually obtained bytwo-dimensional (2D) inversion using the
Fig. 1. Location map of the Hiyoriyama Cryptodome (yellow area) in the Noboribetsu Geothermal Field, lying in the western part of Kuttara Volcano, southwestern Hokkaido, Japan. Also shown is the location of the surveyline for the DC electrical and CSAMT surveys (red line). The points marked A and B are the ends of the grounded-wire (dipole source) of the transmitter for the CSAMT survey(blue line). Topographic contour interval is 10 m.
finite element method.
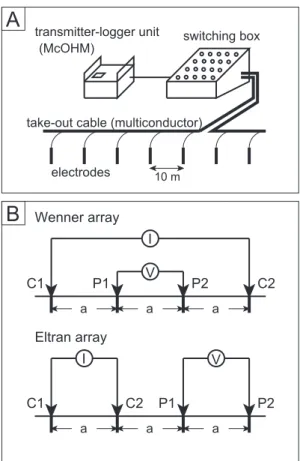
The DC electrical surveywas carried out using a high-resolution electrical exploration system consisting of a transmitter-logger unit (McOHM Model-2115; Oyo Corpo-ration), a switching box, take-out cables, and electrodes (Fig. 4A). The transmitter‒logger unit comprises a trans-mitter with 400 Vp-p output voltage and a data logger with resolution of 20 µV, powered bya 12 V car battery. The electrodes were connected to the transmitter‒logger unit via the switching box and take-out cables. The specifica-tions of the electrical surveysystem are listed in Table 1. The surveyline was 700 m long and oriented N35° E, passing over the summit of the Hiyoriyama Cryptodome (Fig. 3). The electrode configurations used were the Wenner and Eltran arrays (Fig. 4B), both of which are character-ized byregular intervals of electrodes. We employed these arrays because the Wenner array is sensitive to horizontal structures, whereas the Eltran arrayis sensitive to vertical structures. The electrodes were set on the surveyline at regular intervals of 10 m in the horizontal, using a transit and Global Positioning System (GPS). The number of
electrodes was 71.
Measurements were carried out from 20 to 21 May2011 (Fig. 5). During the measurements, two current electrodes (C1 and C2 in Fig. 4B) and two potential electrodes (P1 and P2 in Fig. 4B) were selected from the 71 electrodes. The transmitter‒logger unit injected 20-50 mA electrical currents into the current electrodes, while electric potential was measured at the potential electrodes. A total of 1610 datasets were obtained bychanging the sites and intervals of measuring electrodes using the switching box (Fig. 5). The distances between the measuring electrodes ranged from 10 to 230 m.
3-2 CSAMT survey
The CSAMT surveywas performed following the ‘scalar CSAMT’ method (Matsuoka, 2005), wherebya transmitter injects electrical currents into the ground at audio (and near-audio) frequencies via a grounded-wire (dipole source), while a receiver records the electric field parallel to the grounded-wire and records the magnetic field perpendicular to the grounded-wire. The resistivity structure is usuallyobtained by2D inversion using the finite element method, based on magnetotelluric (MT) theory.
Fig. 2. (A) Photograph of the Hiyoriyama Cryptodome viewed from the south. (B) Oblique, three-dimen-sional, digital terrain model (DTM) of the Hiyoriyama Cryptodome viewed from the south (after Goto et al., 2011a), showing the surveyline for the DC electrical and CSAMT surveys (red line).
Fig. 3. Topographic map of the Hiyoriyama Cryptodome, showing the surveyline for the DC electrical and CSAMT surveys (red line). Receiver stations (blue circles; M1‒M11) for the CSAMT surveyare also shown. The surveyline is 700 m long and oriented N35° E, passing over the summit of the cryptodome. Receiver station M6 is located at the summit of the cryptodome.
The CSAMT surveywas carried out using a high-resolution electromagnetic system (Geo-SEM; Neoscience Co. Ltd) consisting of a transmitter and a receiver, both of which are synchronized by GPS (Fig. 6). The transmitter (Fig. 7A) consists of a transformer, a rectifier, a switching circuit, a GPS clock, and a generator. A grounded-wire, 1.1 km long with 30 electrodes at each termination, was connected to the transmitter (Fig. 6). The receiver (Fig. 7B) consisted of an amplifier, a filter, a data logger, a GPS clock, and sensors. The sensors consist of a pair of electrodes and a coil. The transmitter and receiver were synchronized by a high-precision quartz clock system using GPS with an accuracyof 1×10‒6sec. The
specifica-tions of the Geo-SEM system are listed in Table 1, and
further details of the system can be found in Johmori et al. (2010).
The transmitter was positioned 3. 5 km WNW of the Hiyoriyama Cryptodome, with its 1.1-km-long grounded-wire oriented N35° E (Fig. 1). The receiver stations were distributed along the same surveyline as that used for the DC electrical survey(Fig. 1). The distance between the transmitter and receiver stations was 3.5 km. The survey line was 700 m long and was also oriented N35° E (i.e., parallel to the grounded-wire), passing over the summit of the Hiyoriyama Cryptodome (M1‒M11; Fig. 3). The 11 receiver stations (M1‒M11) were horizontallyspaced at regular intervals of 60-70 m, using a transit and GPS.
The CSAMT surveywas performed from 22 to 24 May 2011. The transmitter injected 1-8 A electrical currents
Fig. 4. (A) Schematic of the electrical exploration system used for the DC electrical survey. The system consists of a transmitter‒logger unit (McOHM), a switching box, take-out cables (multiconductor cables), and 71 electrodes connected to the take-out cables. (B) Schematic of the electrode configuration (Wenner and Eltran arrays) used for the DC electrical survey. C1 and C2 are current electrodes; P1 and P2 are potential electrodes. V is the voltage difference between P1 and P2 due to a current (I) flowing between C1 and C2.
Fig. 5. Photograph of the DC electrical surveyin the field using a transmitter‒logger unit (McOHM) and a switch-ing box, which is connected to 71 electrodes via take-out cables. The surveyinvolved changing the sites and intervals of the electrodes using the switching box. Table 1. Specifications of the exploration systems used
for the DC electrical (McOHM) and CSAMT surveys (Geo SEM).
into the ground at frequencies of 1, 2, 4, 8, 16, 32, 64, 128, 256, 512, 1024, 2048, 4096, and 8192 Hz, and another series at frequencies of 20, 40, 80, 160, 320, 640, 1280, 2560, and 5120 Hz, in order to minimize the noise related to the commerciallyused frequencyof 50 Hz and its higher harmonics. The receiver recorded the electric field parallel to the grounded-wire, and the magnetic field perpendicular to the grounded-wire. The measuring time at each receiver station was 1 hour (2 minutes at 8192 Hz, 8 minutes at 1 Hz). The CSAMT data were processed using a band-pass filter and Fourier-transform, to remove noise. The number of sampling waves was >400,000 at 8192 Hz or >300 at 1 Hz. The apparent resistivityand phase were then calculated from the electric and magnetic fields. Meas-urement errors for the apparent resistivityand phase cannot be calculated as the CSAMT data was treated as a single data to maximize the frequencyresolution (see Johmori et al., 2010).
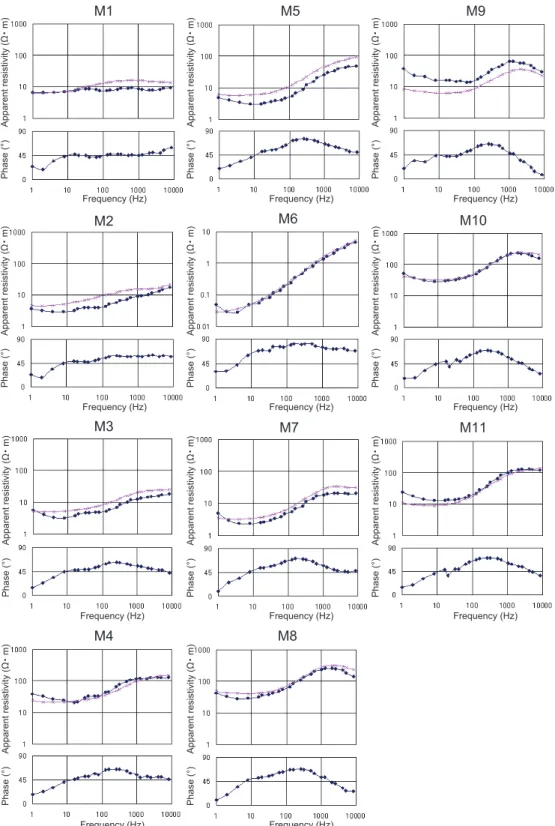
Fig. 8 shows the apparent resistivityand phase angles at all receiver stations. The CSAMT data are inferred to have been measured mainlyin a far-field region, beyond the near-field region, because (1) the phase angles range from 9° to 30° at 1 Hz (e.g., 20.4° at M5 station, 30° at M6, and 9.3° at M7), with no angles of 0°; and (2) the apparent resistivitydoes not show abrupt V-shaped decreasing and increasing trends (i.e., a ‘notch’ or ‘transition zone’; Hishida and Takasugi, 1998) at low frequencies. Below 10 Hz, the apparent resistivityshows a gentle increase with decreas-ing frequency, whereas the phase angle shows a gentle decrease. This finding mayindicate the presence of a high-resistivitybodybeneath a low-resistivitybody, and/or a minor influence on the CSAMT data of the near-field effect. Therefore, it is possible that the CSAMT data are slightlyinfluenced bythe near-field effect. Even if this is
the case, we infer that the near-field effect has no marked influence on the modeling of resistivitystructure at the depths of interest (down to 400 m), given the relation between this depth and the distance between the trans-mitter and receiver stations (3.5 km, which is 8.8 times larger than the depth of 400 m) (cf. Sandberg and Hohmann, 1982).
4.Data analysis
Two-dimensional joint analysis of the DC and CSAMT data was performed to obtain a continuous resistivity structure at depths of up to 400 m beneath the Hiyoriyama Cryptodome. The joint analysis was complicated by the fact that the DC electrical data and the CSAMT data have
Fig. 6. Schematic of the electromagnetic system (Geo-SEM) used for the CSAMT survey. The grounded-wire for the transmitter is 1. 1 km long and has 30 electrodes at each termination. The receiver has sensors consisting of a pair of electrodes and a coil. The distance between the grounded-wire and receiver stations is 3.5 km.
Fig. 7. Photographs of the transmitter (A) and receiver (B) of the electromagnetic system (Geo-SEM) used for the CSAMT survey. The white coil (as shown in B) is 72 cm long.
Fig. 8. Apparent resistivityand phase angles of CSAMT field data (blue lines). Calculated results of 2D inversion for the apparent resistivity(RMS=0.08) are also shown (red lines). Location numbers (M1-11) correspond to those shown in Fig. 3.
different sensitivities to the three-dimensional structure. In this study, the joint analysis was attempted using seesaw-like calculations of repeated 2D inversions of these data (Fig. 9).
The analytical methods applied to the DC electrical data and the CSAMT data were taken from Sasaki (1981) and Sasaki (1986), respectively. The algorithm of Sasaki (1981) is a 2D inversion using a finite element method for DC electrical surveys, whereas the algorithm of Sasaki (1986) is a 2D inversion using a finite element method for MT surveys. The mesh size of the finite element method for DC data analysis was 5 m (element size, 5×5 m), while that for CSAMT data analysis was 10 m (element size, 10 × 10 m). Each inversion block (i. e., the unit used to calculate resistivityby2D inversion; Sasaki, 1986) con-sisted of four elements. In the joint analysis, the 5-m-mesh DC resistivitydata were interpolated and used as an initial model for the 10-m-mesh CSAMT data analysis; con-versely, the 10-m-mesh CSAMT data were interpolated and used as an initial model for the 5-m-mesh DC data
analysis.
While the CSAMT data consisted of apparent resistivity and phase angles, the 2D inversions were performed using the apparent resistivityonly(cf. Sasaki, 1986). Phase angles were not used in the 2D inversions. Static shift for the CSAMT data was reduced bythe 2D inversions. Even if a near-surface resistivity-anomaly was present, it was detected bythe DC electrical data and incorporated into the CSAMT analytical model. Topographic effects for the DC and CSAMT data were reduced bythe 2D inversions. High-resolution, aerial, laser-scanner mapping data (Goto
et al., 2011a) were used to produce topographic models for
the 2D inversions.
The calculation process involved the following five steps (Fig. 9). (1) A resistivitystructure was calculated by 2D inversion of the CSAMT data, setting a uniform resistivity(3 Ω・m) as the initial model. The value of 3 Ω・ m was based on the verylow resistivityin the Noboribetsu Geothermal Field (Goto and Johmori, 2011). (2) A resistivitystructure was calculated by2D inversion of the DC electrical data, setting the result of the 2D inversion of the CSAMT data as the initial model. (3) A resistivity structure was calculated by2D inversion of the CSAMT data, setting the result of the 2D inversion of the DC electrical data as the initial model. (4) A resistivity structure was calculated by2D inversion of the DC electrical data, setting the result of the 2D inversion of the CSAMT data as the initial model. (5) Root mean square (RMS) values were calculated from the field data and from the results of steps (3) and (4). The RMS value (δ) is defined as δ=[Σ{ln (ρaf) ‒ ln (ρac) }2/n]1/2, where ρaf is
the field measurement (apparent resistivity) and ρac is the
calculated result. An RMS value equal to zero means that the calculated result perfectlymatches the field data. RMS values were calculated separatelyfor the CSAMT data and the DC electrical data.
If the RMS values exceeded 0.2, steps (3) and (4) were repeated. If the RMS values were lower than 0. 2, the calculated result was accepted as the resistivitythat satisfies both the CSAMT and DC electrical data. In this study, steps (3) and (4) were repeated four times, yielding RMS values of 0.08 (at step 3) and 0.19 (at step 4). Fig. 10A and B shows the calculated results of 2D joint inversion when steps (3) and (4) were repeated three times (RMS=0.09 at step 3; RMS=0.26 at step 4), whereas Fig. 10C and D shows the calculated results when steps (3) and (4) were repeated four times (RMS=0.08 at step 3, RMS =0.19 at step 4). Fig. 8 compares the CSAMT field data (apparent resistivity) with the calculated result at step (3) (RMS=0.08), while Fig. 11 compares the DC electrical field data (apparent resistivity) with the calculated result at step (4) (RMS=0.19).
Before accepting the calculated result (Fig. 10D), we tested an alternative 2D joint analysis, employing both apparent resistivityand phase angles in the algorithm of
Fig. 9. Flow chart of the procedure for 2D joint inversion of the DC electrical and CSAMT data.
Fig. 11. Comparison of the DC electrical field data (apparent resistivity; A1: Wenner array; B1: Eltran array) and cal-culated results of the 2D inversion (A2: Wenner array; B2: Eltran array) (RMS=0.19).
Fig. 10. Process of 2D joint inversion of the DC electrical and CSAMT data. (A) and (B) Calculated results of 2D joint inversion for three repetitions of steps (3) and (4) (see Fig. 9) (RMS=0.09 at step 3; RMS=0.26 at step 4). (C) and (D) Calculated results of 2D joint inversion for four repetitions of steps (3) and (4) (RMS =0.08 at step 3, RMS=0.19 at step 4). Small dots in (A) - (D) indicate the distributions of the centers of inversion blocks.
Fig. 12. Resistivity section beneath the Hiyoriyama Cryptodome (A) and its geological interpretation (B). Zone A is interpreted to represent fresh (unaltered) pyroclastic deposits erupted from Kuttara Volcano. Zone A at the Hiyoriyama Cryptodome (10-30 m thick; above zone B) is interpreted to be pyroclastic deposits uplifted by growth of the cryptodome. Zone B (150 m wide, 80 m thick) is interpreted as the dacite intrusion of the cryptodome. Zone C is interpreted as altered pyroclastic deposits containing abundant conductive clay minerals, such as smectite, formed by low-temperature (<200℃) hydrothermal alteration in the region between the cold ground surface and deeper, hotter regions. Zone D is interpreted as altered pyroclastic deposits that have been subjected to higher-temperature (>200℃) hydrothermal alteration in a deeper, hotter region near the conduit of the Hiyoriyama Cryptodome. The location of the feeder dyke is estimated from the topographic features of the Hiyoriyama Cryptodome.
depth (Cagniard, 1953) and the Bostick depth (Murakami, 1987). The skin depth is defined as the depth at which the amplitude of electromagnetic waves decrease to 1/e (e is the base of the natural logarithm). The Bostick depth is defined as 1/ 2 of the skin depth, and is considered to represent a more accurate depth of penetration than the skin depth. The skin depth calculated from the frequency of electric currents for the deepest layer (1 Hz) and from its apparent resistivity(3-5 Ω・m) for the CSAMT data, yields a penetration depth of 866-1120 m, whereas the Bostick depth calculated from the same data yields a penetration depth of 612-792 m. Given that the topographyalong the surveyline varies in elevation from 225 to 350 m and has relativelysteep slopes, we conservativelyestimate the depth of penetration to be about 400 m below the ground surface.
5.Results and discussion
Processing of the DC electrical and CSAMT data revealed the subsurface resistivitystructure at depths of less than 400 m beneath the Hiyoriyama Cryptodome (Fig. 12A). The resistivitystructure is divided into four zones based on the resistivityvalues (A‒D in Fig. 12B). In general, the resistivityof rocks and sediments is lowered bythe presence of conductive minerals (e. g., smectite-series clays), thermal water in pores and fractures, and high temperatures (e. g., Risk et al., 2003). Geological interpretations of the four zones (A‒D in Fig. 12B) are provided as follows.
Zone A (resistivityof > 100 Ω・m) extends sub-horizontallyalong the ground surface and is 〜100 m thick beneath the Hiyoriyama Plain, and 10-30 m thick at the Hiyoriyama Cryptodome. Because the surface geology in this area consists of pyroclastic deposits erupted from Kuttara Volcano at ca. 40 ka (mainlythe Kt-1 pyroclastic flow deposit), zone A is interpreted to represent these deposits. The high resistivityof this zone suggests that the deposits are fresh and unaltered. Zone A at the Hiyoriyama Cryptodome (10-30 m thick; above zone B) is interpreted to be pyroclastic deposits uplifted by growth of the cryptodome.
Zone B (20-50 Ω・m) is located below the Hiyoriyama
Zone C occurs 100-200 m below the cryptodome and is characterized byverylow resistivity(<5 Ω・m). This zone is 〜100 m thick, convex-shaped, and is conspicuous in the resistivitysection. The convex shape is symmetrical with respect to a vertical line passing through the summit of the cryptodome. The top of the convex body appears to fade out, with the zone being discontinuous at the vertical line. Possible interpretations of zone C include: (1) altered pyroclastic deposits containing abundant conductive clay minerals, such as smectite; (2) pyroclastic deposits containing thermal water in pores and fractures; and (3) high-temperature pyroclastic deposits. We favor interpretation (1) because interpretations (2) and (3) cannot readilyexplain the convex geometryof the zone. We infer that the convex-shaped geometryreflects the distribution of the stabilityfield of smectite (<200℃; Hyndman et al., 1997; Aizawa et al., 2009; Aizawa, 2010; Lee et al., 2010). The fade-out at the top of the convex bodycould be attributed to the instabilityof smectite (which occurs at temperatures of > 200℃) due to the ascent of high-temperature fluids along the feeder dyke beneath the dome. Zone C is therefore interpreted as altered pyroclastic deposits subjected to low-temperature (< 200℃) hydrothermal alteration in the region between the cold ground surface and deeper, hotter regions. Zone C is rich in clayminerals and mayform an impermeable ‘sealing zone’ (Aizawa et al., 2009; Aizawa, 2010) below fresh, permeable pyroclastic deposits (zone A).
Zone D occurs beneath zone C (150-400 m below the ground surface) and shows higher resistivity(10-30 Ω・m). The oval shape of zone D remains uncertain, as the resistivityresolution at this depth is insufficient to reliably constrain its outline. A possible interpretation of zone D is altered pyroclastic deposits containing fewer conductive clayminerals than in zone C (e.g., it maycontain chlorite rather than smectite). The higher resistivitycan potentially be attributed to the higher temperature of the zone, which means that smectite is unstable (> 200℃). A higher temperature is plausible because zone D is deeper than zone C, and located closer to the inferred feeder dyke of the dome. Zone D is therefore interpreted as altered pyroclastic deposits that have been subjected to
higher-temperature (>200℃) hydrothermal alteration in a deeper, hotter region near the conduit of the Hiyoriyama Crypto-dome.
6.Conclusions
DC electrical and CSAMT surveys have revealed the sub-surface resistivitystructure at depths shallower than 400 m beneath the Hiyoriyama Cryptodome. The resistivity struc-ture suggests that the cryptodome comprises a dacite intru-sion (150 m wide, 80 m thick) and overlying pyroclastic deposits (10-30 m thick). The dacite intrusion is underlain byhydrothermallyaltered pyroclastic deposits (>300 m) that are divided into two zones based on the assemblage of alteration minerals. The upper zone contains abundant conductive clayminerals such as smectite that formed by low-temperature alteration, whereas the lower zone contains fewer conductive clayminerals and formed byhigher-temperature alteration in a deeper, hotter region near the conduit of the cryptodome.
Acknowledgments
This research was sponsored bythe Ministryof Edu-cation, Culture, Sports, Science and Technologyof Japan (MEXT), and was financiallysupported bythe Muroran Institute of Technology. We thank N. Johmori, T. Kondou and T. Takahashi (Neo Science Co. Ltd) for help in the field. S. Kameyama (Tanaka Consultant Co. Ltd) is thanked for providing topographic data for the Hiyoriyama Crypto-dome. Comments byK. Aizawa (Universityof Tokyo), an anonymous referee and T. Watanabe (University of Toyama) significantly improved the manuscript.
References
Aizawa, K. (2010) Groundwater flow beneath volcanoes inferred from electric self-potential and magnetotellurics.
Bull. Volcanol. Soc. Japan, 55, 251-259. (in Japanese)
Aizawa, K., Ogawa, Y., Hashimoto, T., Koyama, T., Kanda, W., Yamaya, Y., Mishina, M. and Kagiyama, T. (2008) Shallow resistivitystructure of Asama volcano and its implications for magma ascent process in the 2004 eruption.
J. Volcanol. Geotherm. Res. 173, 165-177.
Aizawa, K., Ogawa, Y. and Ishido, T. (2009) Groundwater flow and hydrothermal systems within volcanic edifices: Deliniation byelectric self-potential and magnetotellurics.
J. Geophys. Res., 114, doi: B0120810.1029/2008jb005910.
Cagniard, I. (1953) Basic theoryof the magnetotelluric method of geophysical prospecting. Geophysics, 18, 605-635.
Goto, Y. and Danhara, T. (2011) Zircon fission-track dating of the Hiyoriyama Cryptodome at Kuttara Volcano, south-western Hokkaido, Japan. Bull. Volcanol. Soc. Japan, 56, 19-23.
Goto, Y. and Johmori, A. (2011) Controlled source audio-frequencymagnetotelluric (CSAMT) and time domain electromagnetic (TDEM) resistivitymeasurements at
Noboribetsu Geothermal Field, Kuttara Volcano, Hokkaido, Japan. Bull. Volcanol. Soc. Japan, 56, 153-160.
Goto, Y., Matsuzuka, S. and Kameyama, S. (2011a) Three-dimensional digital mapping of Noboribetsu Geothermal Field, Kuttara Volcano, Hokkaido, Japan, using helicopter-borne high-resolution laser scanner. Bull. Volcanol. Soc.
Japan, 56, 127-135.
Goto, Y., Sasaki, H., Toriguchi, Y. and Hatakeyama, A. (2011b) Phreatic explosion after AD 1663 at the Hiyori-yama Cryptodome, Kuttara Volcano, southwestern Hokkaido, Japan. Bull. Volcanol. Soc. Japan, 56, 147-152.
Hishida, H. and Takasugi, S. (1998) The CSAMT method. In
Handbook for geophysical exploration (Societyof
tion Geophysics of Japan ed.), 322-325, Societyof Explora-tion Geophysics of Japan. (in Japanese)
Hyndman, R.D., Yamano, M. and Oleskevich, D.A. (1997) The seismogenic zone of subduction thrust faults. Island
Arc, 6, 244-260.
Johmori, A., Mitsuhata, Y., Nishimura, S., Johmori, N., Kondou, T. and Takahashi, T. (2010) Development of a deep electromagnetic exploration instrument with high frequencyspectrum resolution using GPS synchronization.
Jour. Japan Soc. Engin. Geol., 51, 62-72. (in Japanese with
English abstract)
Katsui, Y., Yokoyama, I., Okada, H., Abiko, T. and Muto, H. (1988) Kuttara (Hiyoriyama), its volcanic geology, history of eruption, present state of activity and prevention of disasters. Committee for Prevention and Disasters of Hokkaido, Sapporo, 99p. (in Japanese)
Lee, J.O., Kang, I.M. and Cho, W.J. (2010) Smectite alteration and its influence of the barrier properties of smectite clay for a repository. Applied Clay Science, 47, 99-104. Matsuoka, T. (2005) Dictionary of exploration geophysics.
Societyof Exploration Geophysics of Japan ed., Aichi Shuppan, Tokyo, 279p. (in Japanese)
Milsom, J. (2003) Field Geophysics. John Wileyand Sons, Ltd, England, 232p.
Moriizumi, M. (1998) The growth historyof the Kuttara volcanic group. Bull. Volcanol. Soc. Japan, 43, 95-111. (in Japanese with English abstract)
Moriya, I. (2003) Kuttara Volcano. In Regional
Geomorphol-ogy of the Japanese Islands, vol. 2, GeomorpholGeomorphol-ogy of Hokkaido (Koaze T., Nogami, M., Ono, Y. and Hirakawa.
K. eds.), 279-281, University of Tokyo Press, Tokyo. (in Japanese)
Murakami, Y. (1987) Bostic inversion. Butsuri-Tansa, 40, 282-291.
NEDO (New Energyand Industrial TechnologyDevelopment Organization) (1991) Noboribetsu, Report of promotional exploration for geothermal research, No. 22. NEDO, Tokyo, 845p. (in Japanese)
Risk, G.F., Caldwell, T.G. and Bibby, H.M. (2003) Tensor time domain electromagnetic resistivitymeasurements at Ngatamariki geothermal field, New Zealand. J. Volcanol.
Geotherm. Res. 127, 33-54.
Sandberg, S. and Hohmann, G. (1982) Controlled-source audio-magnetotellurics in geothermal exploration. Geophysics, 47,
後藤芳彦・城森 明 北海道南西部クッタラ火山,日和山潜在ドームの比抵抗構造探査を行い,日和山潜在ドームの内部構造(深 度<400 m)を解明した.探査は高密度電気探査法および CSAMT 探査法を用い,ドームを北東-南西方向に 横断する測線上で行った.測線長は 700 m で,受信点は高密度電気探査 71 電極,CSAMT 探査 11 測点を等 間隔に配置した.データ解析は高密度電気探査および CSAMT 探査データの 2D ジョイント解析で行った. 日和山潜在ドームは,幅 150 m 高さ 80 m のデイサイト貫入岩体 (20-50 Ω・m) と,貫入岩体を覆う厚さ 10-30 m の火砕堆積物 (>100 Ω・m) からなる.デイサイト貫入岩体の直下には,ハの字型の低比抵抗領域 (<10 Ω・ m) が存在し,スメクタイトに富む低温 (<200℃) の熱水変質帯であると考えられる.この低比抵抗領域の 直下には中比抵抗領域 (10-30 Ω・m) が存在し,ドームの供給岩脈(火道)に沿って形成された高温 (>200℃) の熱水変質帯であると考えられる.