Investigating Village Socio-economic
Conditions in Cambodia : The case of Rattan
Handicraft Village of Tor Tea, Siem Reap (荒井
勝彦教授 退職記念号)
著者
Aye Chan Pwint
journal or
publication title
Journal of Economics, Kumamoto Gakuen
University
volume
22
number
1-2
page range
145-166
year
2015-10-31
URL
http://id.nii.ac.jp/1113/00000727/
(The case of Rattan Handicraft Village of Tor Tea, Siem Reap)*
Aye chan pwint
Abstract
This study has two main objectives, (1) Measuring extent of poverty, and (2) Examining the possibility of generating employment and income opportunities for promoting socio-economic condition of Tor Tea village, Siem Reap province, Cambodia. Section 1 introduces the general features of Tor Tea village. The limitation of survey work and the general social conditions of village people are discussed in section 2 and 3 respectively. Section 4 briefly explains the general economic conditions of village people. Section 5 examines the extent of poverty and section 6 investigates the conditions of Rattan Handicraft Micro Business. Finally, findings and suggestions are provided in section 7. This study could verify that (a) 78% of village people and Rattan Handicraft (RH)producers are poor particularly due to shortage of demand, poor market and business knowledge, (b) 78.5% of village people make their living on less than $1.25 a day, (c) the extent of poverty in Tor Tea village is much higher than the national poverty ratio (30.10%) and rural poverty ratio (34.70%), (d) RH producers cannot sustain their economic and social life based on RH alone, (e)Although RH producers have enough experience(RH producers generally have 26 years of experience in producing RH) and acceptable skill level, they decide the amount of production based on order quantity rather than product price and demand situation in Siem Reap city center or from souvenir shops, (f) RH producers are producing at their own paces and no one considers establishing rattan production as a business, (g) RH producers do not think much about the cost and return as well as the profit margin, as they are not very business
*) The author is greatly indebted to Professor Dr. Maung Maung Lwin, Kumamoto Gakuen University for valuable guidance and comments, Mr. Yamakawa Takahiro and students of Angkor University for their cooperation. The author also would like to express my sincere thanks to Dr. Jeffrey Stewart Morrow, Associate Professor, Prefectural University of Kumamoto.
minded, (h) Local government, individuals and international organization should encourage and provide financial support as well as all-weather roads in order to promote demand from tourists.
Introduction
Poverty is as old as mankind and much older than the Adam Smith’s Wealth of Nations (1776) and of course, the formation of development economics in modern human society. Poverty has been remaining as one of the most difficult problems to be solved among development economists and policy makers for centuries. Recently, poverty has becomes a worldwide problem because it can be found both developing and industrially developed high income nations.
The developed country type poverty has been growing rapidly as a result of long-lasted economic downturn aggravated by global financial crisis starting from Lehman Shock of 15th
September 2008. Poverty problems in some developed OECD and EU member countries are becoming as serious as in low income countries of the underdeveloped world. Undoubtedly, it is a signal lacking appropriate poverty reduction policies and actions which directly address the remote rural areas of developing and least developing countries as well as sustainable development strategies for the developed world. In this juncture, it is worthy to introduce the words of Mahbub ul Haq, World Bank’s Director of Policy Planning. He stated that “The basic problem of development should be redefined as a selective attack on the worst form of poverty.
Development goals must be defined in terms of the progressive reduction and eventual elimination of malnutrition, disease, illiteracy, squalor, unemployment and inequalities.” In order to achieve Mahbub ul Haq’s development goal and Millennium Development Goal of halving poverty by year 2015, studying more about the development problem of developed world as well as the poverty problems of poor countries under the process of globalization is required. Moreover, it is widely known that, poverty related basic information and data on poor rural areas of the world is still extremely lacking comparatively due to the absence of peace, tranquility, expertise and financial assistance.
Tea village by conducting survey work under the guidance of Angkor University Research Center for Economic Development and with the help of students from Angkor University. This paper has two main objectives, (1) Measuring extent of poverty, and (2) Examining the possibility of generating employment and income opportunities for promoting socio-economic condition of Tor Tea village, Siem Reap province, Cambodia. Section 1 introduces the general features of Tor Tea village. The limitation of survey work and the general social conditions of village people are discussed in section 2 and 3 respectively. Section 4 briefly explains the general economic conditions of village people. Section 5 examines the extent of poverty and section 6 investigates the conditions of Rattan Handicraft Micro Business. Finally, findings and suggestions are provided in section 7.
Section 1. General Features of Tor Tea Village
In this section, population structure, estimated working labor force, age dependency ratio and daily socio-economic lives of village people in general are explored as background knowledge in order to reexamine in the analysis of compiled data.
Before conducting survey the author visited Tor Tea village and then conducted interviews under the supervision of Professor Dr Maung Maung lwin (Kumamoto Gakuen University), Mr. Yamakawa Takahiro (Kumamoto Gakuen University), Angkor University Research Center for Economic Development (AURCED) and with the help of students from Angkor University during the end of March 2012. It is worthy to note that, this study attempt to verify the social and economic condition of Tor Tea village not only from income and expenditure aspects, but also living infrastructure, poverty condition, maternal and child health condition of village people. The contents of our survey questionnaire tried to focus socio-economic condition of RH producers from the multidimensional aspects of education, experience and skill, production decision, price decision, demand and supply potential, livestock and property, etc.
Tor Tea village is located on the north of Siem Reap city belongs to Krabei Real commune which comprises 12 villages. It is located 9 kilometers away from city center, 16 kilometers from Angkor Wat and 13 kilometers from Angkor University. The population of Tor Tea village is about 460 and the number of males and females are 217 and 224 respectively. The village has 97 households with an average family size of about 4.7. It has total land area of 51
hectares and 33 hectares is used for rice growing, 3 hectares for vegetable and 15 hectares for housing. Tor Tea village doesn’t have primary school or health care center for village people.
Map1. Location of Tor Tea village
Source: By Author.
In this survey, the author used the complete survey instead of sample survey method. In other words, we made interviews of all the household of Tor Tea village. However, during the survey period, 4 of the households could not have interviews for unavoidable reason. In this village, 58 households (62.4%) producing rattan handicraft (RH) and 85 were born and grew up in this village. The village has 97 households (18 male respondents, 75 female respondents) and sex ratio is 1.03. The average age of Tor Tea village is 27.39 years and estimated working labor force ( age between 15 to 60) is 64.62%.
West Brai Angkor Tom
Angkor Wat International Airport
National Road No.6
To Siem Reap Town
Angkor University Tor Tea
Table 1.General features of Tor Tea Village
Note: *Age between 15 to 60. Source: Compiled from survey data.
Section 2. Limitations of this study
The survey was conducted in Tor Tea village in March 2012. During survey, firstly, we came to notice that the information provided by the village head and findings on population, number of households and general occupation of village people is different. This is probably due to changing village economic life which is faster than the immediate past. Moreover, the number of household members who grow the vegetables, works in the construction site of Siem Reap City, and leave the village to work in Thailand is increasing. The income from family-based traditional RH micro business is largely reliant on the tourist industry and even on world financial crisis due to the outbreak of Lehman Shock in 2008. These made difficulties in estimation of daily or monthly household income. Although the village life-style is simple, we encountered some difficulties in asking about daily expenditures due to higher illiteracy rate among household heads. These problems would lead to the weakness in accuracy of survey result on household income and expenditure.
Availability of basic geographical, political, social and economic information on designated survey area in advance is extremely important for preparing survey questionnaire which address the fundamental objectives of the research. Needless to point that many developing countries are lacking basic village data due to insurgency problem. Although, the problem of landmines still remained in some rural areas of Cambodia, the villages under our study are
Particulars Unit of measures 1. Total number of households 97 Total population 460 2. Sample Size(Polulation) 441 3. Sample Size (household) 93 4. Survey Respondent (Male) 18 5. Survey Respondent (Female) 75 6. Sex Ratio 1.03 7. Average household size 4.74 8. Average Age 27.39 9. Estimated working labor force* 285 (64.62%)
10. Age dependency ratio 0.46 11. Distance from Siem Reap City Center 9 km 12. Distance from Angkor Wat 16 km
quite safe. However, as in other developing countries of Asia, the Tor Tea village under our survey is also lacking (1) village map related to location, land use, housing, establishments covering school, pagoda, health center, bazaar, community center etc. (2) population data such as distribution of age, sex, education, occupation and marital status etc., and (3) size and ownership patterns of agriculture land and crop patterns. Therefore, it is difficult to choose the appropriate random sampling method to save time and money. Accordingly, we finally decided to interview all household heads or house members who aware about rattan handicraft, village agriculture and family situation.
We prepared the questionnaire in English and survey team member of Angkor University’s Cambodian students used the Khmer language for interview. Of course, the English ability of students is good enough to understand the English questionnaire and orientation of survey work. It is worthy to note that language difficulties, high illiteracy rate, and understanding of different cultures are unavoidable fundamental problems in conducting village survey in developing countries. Moreover our indirect way of estimation and investigation for potentials of demand and supply as well as skill level would lead to weakening of research finding. However, we expect that above mentioned limitations of this study would not affect the concluding remarks much.
Section 3. Investigating General Social Conditions
As given in previous table 1, male - female ratio of Tor Tea village is about 1.03 and this is the same situation as in other villages of Cambodia due to the result of tragic Poll Pot regime, which lasted from 1975 to 1979. According to table 2, average age of respondents is about 27 years old, minimum age is 12 years old and maximum age is 76 years old. About 67% of respondents are married, 16% of respondents are single, 11% of respondents are widowed and 6% of respondents are divorced.
Table 3 represents the level of education (respondent) of Tor Tea village people. This table gives the impression that general level of education (respondent) in Tor Tea village is still low and it still has about 30% of village people are illiterate. 37% of respondents couldn’t receive an education but they can read and write only Khmer language. Only 6%, 7% and 1% of respondents received middle school education, high school education, and university education respectively and they can speak other languages. However, the children’s
education level of Tor Tea village should be judged differently. Of course the level of people income and amount of expenditure heavily depends on the educational level of the people.
Table 2. Age, Sex and Marital status (Respondent)
Source: Compiled from survey data.
Table 3. Level of education (Respondent)
Source: Compiled from survey data.
Particulars Unit of measures 1. Age distribution
Average age 27.39 years Minimum age 12years Maximum age 76years 2. Sex distribution Male 18 Female 75 3. Marital status Single 15 (16.13%) Married 62 (66.67%) Widow 10 (10.75%) Divorced 6 (6.45%)
Particulars Unit of measures 1. Education Level
Illiterate 28 (30.11%) Literate(Read & write) 34 (36.56%) Primary school 19 (20.43%) Middle school 5 (5.38%) High school 6 (6.45%) University 1 (1.08%) 2. Language ability
Speak mother tongue(Khmer) only 83 (89.25%) Speak other languages 10 (10.75%)
Section 4. Investigating Economic Conditions
4-1. Income and Expenditure
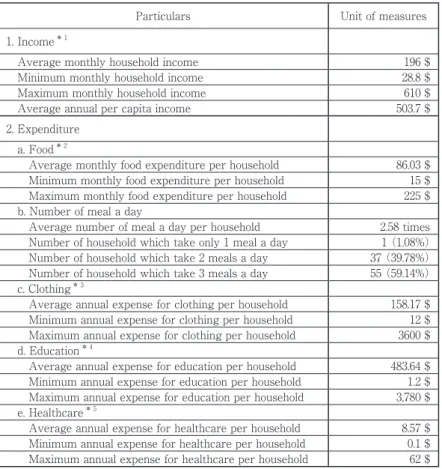
As given in table 4, average the monthly income is about 196 dollars, the minimum income is 28.8 dollars and the maximum income is 610 dollars. It is clear that the income differential among rich and poor is rather large because the maximum monthly income is 22 times higher than that of minimum income. Basing on the average family size of 4.7, we can easily calculate the daily income per capita of Tor Tea village, such as $1.39. This figure is a little higher than international poverty line of $1.25 a day. However, if we base on the minimum monthly income of the village, daily per capita income is about $0.2 and it is only one sixth of international poverty line. In order to escape from the lowest poverty line, the people of Tor Tea village must have an average monthly income about $176.3 per household.
Regarding the expenditure of the village, we divided it into 4 categories food, clothing, education, and healthcare. We also include the number of meals a day in our questionnaire. Average money expenditure on food per household is about $86.03 and it lead to the Engel’s coefficient of about 44%. This result means that nearly half of the income is spent on food in the Tor Tea village. The difference between Maximum and Minimum value of food expenditure is quite big probably due to difference in family size and income as well as inaccuracy of interview results particularly due to poor experience of village interviewees. Concerning the number of meal a day, more than 90% of respondent take meals 2 to 3 times a day.
For clothing expenditure, the annual expense is about $158.17 per household. Regarding education, the annual expenditure is about $483.64 ($40.3 per month). In the case of health care, the annual expense per household is about $8.57($0.7 per month). This pattern of expenditure on food, clothing, education and health care probably can be found in many villages of Asia.
Table 4. Income and Expenditure
Note: *1 Total Respondent is 87. *2 Total Respondent is 92. *3 Total Respondent is 82. *4 Total Respondent is 69. *5 Total Respondent is 82. Source: Compiled from survey data.
4-2. Livestock, Property, Savings and Debt
In order to estimate the economic condition of village people, we tried to include livestock (include cow, buffalo, chicken, duck, goat, pig) and property conditions (include TV, radio, cassette, video player, CD/DVD player, refrigerator, bicycle, bike) of every household.
Particulars Unit of measures
1. Income* 1
Average monthly household income 196 $
Minimum monthly household income 28.8 $
Maximum monthly household income 610 $
Average annual per capita income 503.7 $
2. Expenditure a. Food* 2
Average monthly food expenditure per household 86.03 $ Minimum monthly food expenditure per household 15 $ Maximum monthly food expenditure per household 225 $ b. Number of meal a day
Average number of meal a day per household 2.58 times Number of household which take only 1 meal a day 1 (1.08%) Number of household which take 2 meals a day 37 (39.78%) Number of household which take 3 meals a day 55 (59.14%) c. Clothing* 3
Average annual expense for clothing per household 158.17 $ Minimum annual expense for clothing per household 12 $ Maximum annual expense for clothing per household 3600 $ d. Education* 4
Average annual expense for education per household 483.64 $ Minimum annual expense for education per household 1.2 $ Maximum annual expense for education per household 3,780 $ e. Healthcare* 5
Average annual expense for healthcare per household 8.57 $ Minimum annual expense for healthcare per household 0.1 $ Maximum annual expense for healthcare per household 62 $
Table 5 represents livestock and property of village people. Regarding the average value of livestock and property is about $850 and $10,856 respectively. Minimum value of livestock is $4 and maximum value of livestock is $ 7,857. Minimum value of property is $145 and maximum value of property is $ 95,040. The differences between maximum and minimum value for the both, livestock and property are very large. This figure gives the impression that income and wealth differential among the villagers seem large.
Table 5. Livestock and property
Note: *1 Total Respondent is 53. *2 Total Respondent is 87.Source: Compiled from survey data.
Table 6. Savings and debt
Note: *1 Total Respondent is 85. *2 Total Respondent is 93. *3 Total Respondent is 93. Source: Compiled from survey data.
Particulars Unit of measures
1. Livestock * 1
Average value of Livestock 850 $
Minimum value of livestock 4 $
Maximum value of livestock 7,857 $
2. Property * 2
Average value of property 10,856 $
Minimum value of property 145 $
Maximum value of property 95,040 $
Particulars Unit of measures
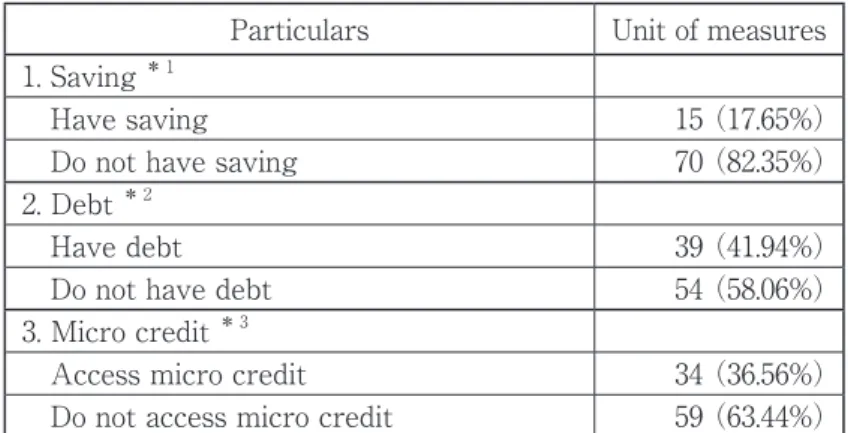
1. Saving * 1
Have saving 15 (17.65%)
Do not have saving 70 (82.35%)
2. Debt * 2
Have debt 39 (41.94%)
Do not have debt 54 (58.06%)
3. Micro credit * 3
Access micro credit 34 (36.56%)
The economic condition of villagers can be judged by using savings and debt data. Table 6 represents savings and debt condition of village people. According to this table, only 15 households (17.65%) have savings and other remaining 70 households (82.35%) do not have savings. Regarding debt condition, 39 households (41.94%) responded that they have debt and 34 households (36.56%) access micro credit. Almost all the villagers who have debt access the micro credit and only the remaining 5 households relied on informal money lenders. Although 54 households do not have debt, only 15 households can save in the village. Therefore, it is relevant to judge that the economic condition of villagers is not good enough.
Section5. Investigating Extent of Poverty
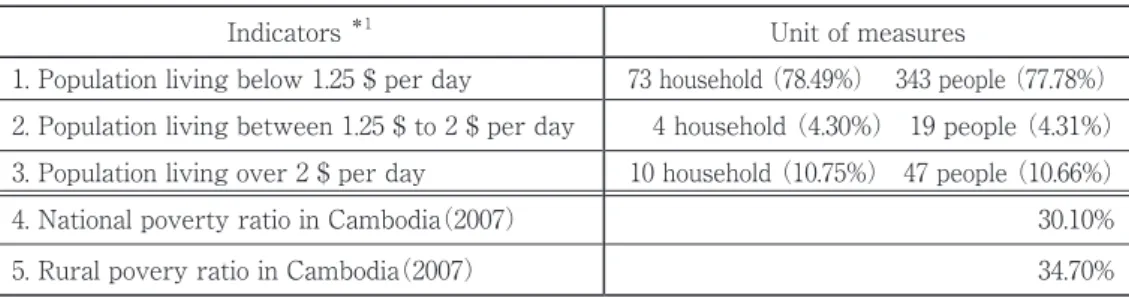
Table 7 attempts to verity the poverty condition of Tor Tea village. The village poverty condition can be measured based on international poverty line $1.25 a day of United Nations Development Programme. According to this yardstick, table 7 gives the impression that poverty condition of Tor Tea village is severe. For example, 73 households (78.49%) or about 343 people (77.78%) make their living on less than $1.25 per day. Moreover, 4 households (4.30%) or about 19 people (4.31%) make their livings on $1.25 to $2 per day. If we compare the national poverty ratio (30.10%) and rural poverty ratio (34.70%), the extent of poverty in Tor Tea village is much higher than the national average.
Table 7. Poverty condition
Note: *1 Total Respondent is 87. Source: Compiled from survey data.
Indicators *1 Unit of measures
1. Population living below 1.25 $ per day 73 household (78.49%) 343 people (77.78%) 2. Population living between 1.25 $ to 2 $ per day 4 household (4.30%) 19 people (4.31%) 3. Population living over 2 $ per day 10 household (10.75%) 47 people (10.66%) 4. National poverty ratio in Cambodia(2007) 30.10% 5. Rural povery ratio in Cambodia(2007) 34.70%
Section 6. Investigating Rattan Handicraft Micro Business
6-1. Experience and Skill
In order to investigate the possibility of generating employment and income of the village, we also designed our questionnaire to cover the factors experience and skill, type of occupation, labor employed, daily working hours, demand and supply potential etc. Practically, it is very difficult to measure the skill level of village people in producing rattan handicraft. However, we tried to measure the skill level by using questions such as (a) number of type of RH products, (b) ability of producing new type of RH, (c) the most expensive RH product can be produce, (d) year of experience.
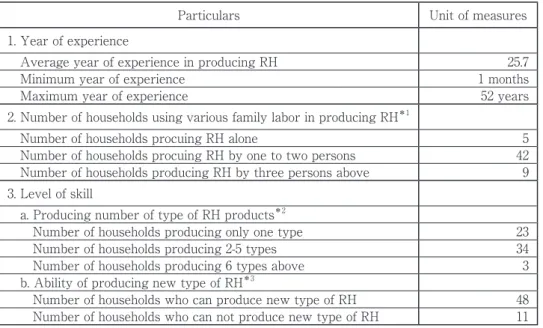
According to our survey results, RH producers generally have 26 years of experience in producing RH and maximum year of experience are 52. This is mainly because producing RH in Tor Tea village is a kind of village tradition, since after the Second World War, and we can also label that traditional family based micro RH business. Moreover, it is relevant to judge that RH producers of Tor Tea village have enough experience. As can be seen table 8, more than half of the RH producers are producing by using two and more labors, as RH is family business.
It’s needless to point out that measuring skill level in any types of business is difficult. Rattan handicraft traditional cottage industry in Tor Tea village is no exception. However, we attempt to measure the skill level by using years of experience in producing RH, types of products and ability of producing new type of RH. According to our survey results, more than half (56.7%) of the RH producers has been producing 2to5 types and more than 80% of RH producers can produce new types of RH if they can get the sample. Here, we can also judge that RH producers of Tor Tea village have acceptable skill level. Moreover, this finding can be considered as Tor Tea village’s has business potential.
Table 8. Experience and Skill
Note: *1 Total Respondent is 56. *2 Total Respondent is 60. *3 Total Respondent is 59. Source: Compiled from survey data.
6-2. Working hours and days
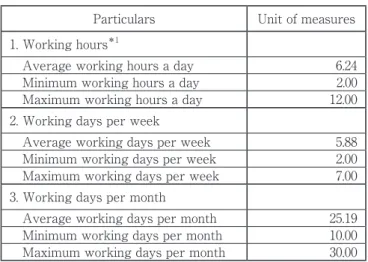
Table 9 provides information regarding working hours and days. According to table 9, average daily working hour is about 6.24 hours and it is shorter than the normal business working hours of 8 hours a day. And average working day per week is about 5.9 days which is much higher than the normal working days. It can be seen in the table, the average working day per month is 25.2%. However, we need to seriously consider the nature of traditional family based micro RH business. According to our findings during the survey periods, all the RH producers are married women and they are weaving the RH together with the childcare, cooking and washing. It is very difficult to calculate the actual daily working hours. Therefore, it is certain that the real working hours for RH is much lower than the hours mentioned by the respondents. As in other villages of developing countries, it is generally accepted that village people are under employed and have surplus labor.
Particulars Unit of measures 1. Year of experience
Average year of experience in producing RH 25.7 Minimum year of experience 1 months Maximum year of experience 52 years 2. Number of households using various family labor in producing RH*1
Number of households procuing RH alone 5 Number of households procuing RH by one to two persons 42 Number of households producing RH by three persons above 9 3. Level of skill
a. Producing number of type of RH products*2
Number of households producing only one type 23 Number of households producing 2-5 types 34 Number of households producing 6 types above 3 b. Ability of producing new type of RH*3
Number of households who can produce new type of RH 48 Number of households who can not produce new type of RH 11
Table 9. Working hour and day
Note: *1 Total Respondent is 59. Source: Compiled from survey data.
6-3. Production and price decision
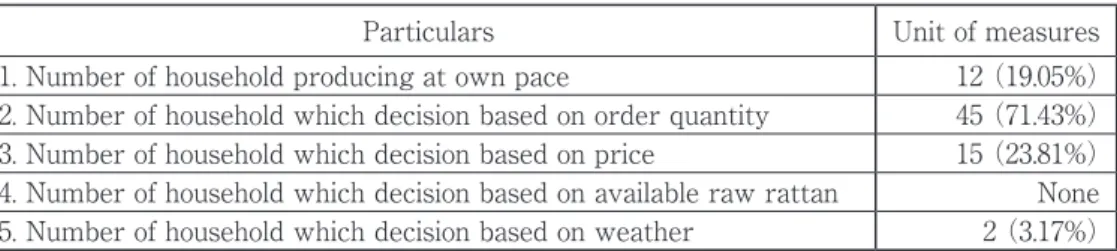
In order to investigate to the business potential of Tor Tea village, we also include the business decision question. More than half of the RH producers, 45 out of 63, response that they decide the amount of production based on order quantity rather than on product price and demand situation in the Siem Reap city center or souvenir shop around Angkor Wat. Moreover, 12 RH producers are producing at their own paces and no one considers availability of raw rattan which is facing shortages. As far as price decisions of RH producers are concerned, only 12 producers based on required raw material and required labor hours, and other remaining 51 producers (81%) sell their products at the price of paid by middleman. As mentioned in the table, none of the producers inquire the RH prices in Siem Reap city.
Particulars Unit of measures 1. Working hours*1
Average working hours a day 6.24 Minimum working hours a day 2.00 Maximum working hours a day 12.00 2. Working days per week
Average working days per week 5.88 Minimum working days per week 2.00 Maximum working days per week 7.00 3. Working days per month
Average working days per month 25.19 Minimum working days per month 10.00 Maximum working days per month 30.00
Table 10. Production decision
Note: Multiple-choice. *1 Total Respondent is 63. Source: Compiled from survey data.
Table 11. Price decision
Note: *1 Total Respondent is 63. Source: Compiled from survey data.
6-4. Labor requirement and distance to raw rattan source
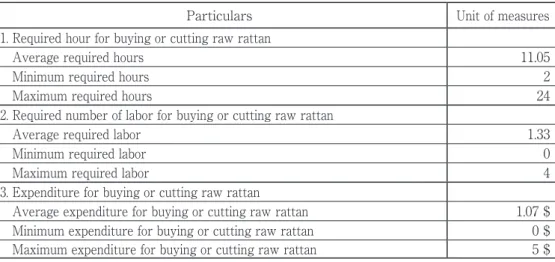
In this study, we also inquired about the labor requirement and distance to get the raw rattan for producing RH. As mentioned in table 12, required labor is about 1.3 and average required hours is about nearly half day ( 11.05 hours) as raw rattan reserved is declining due to the lack of systematic preserving or replanting rattan in Cambodia. Average required number of labor for buying or cutting raw rattan is about 2 people and the expenditure for buying or cutting raw rattan a bundle of rattan costs is about $ 1.07. It is expensive and time consuming compare to the product price of RH paid by middle man. According to our impression during survey period, we felt that village RH producers do not think much about cost and return as well as profit margin, as they are not very business minded. They are weaving and selling RH products as daily traditional routing rather than business.
Particulars Unit of measures 1. Number of household producing at own pace 12 (19.05%) 2. Number of household which decision based on order quantity 45 (71.43%) 3. Number of household which decision based on price 15 (23.81%) 4. Number of household which decision based on available raw rattan None 5. Number of household which decision based on weather 2 (3.17%)
Particulars Unit of measures 1. Number of household that respond price is based on required raw material and
required labor hour 12 (19.05%)
2. Number of household that respond price is based on the price paid by middleman 51 (80.95%) 3. Number of household that respond price is based on the prices in Siem Reap City None
Table 12. Labor requirement and distance to raw rattan source
Source: Compiled from survey data.
6-5. Potential of raw rattan reserve and change in rattan handicraft price
Table 13 gives the impression that RH producers are going to face raw rattan shortage problem soon. Because, 41 RH producers responded just enough and 11 responded facing shortage. It will be appropriate to consider about the preserving rattan forest and rattan plantation in order to solve the rattan shortage problem.
As can be seen in table 14, number of RH producers who respond the change in RH products price is only about 36 out of 63, about 75% (27 RH producers) of the total respondents replied that prices are not changing too much compared to last 2 to 3 years ago. If we look at the price differential between the retail village price and middle man price, and the retail village price and market price, the difference is about $1.58 and $1.79 respectively. If we consider the per capita income level of Tor Tea village, which is about $ 1.38, the price differential of $1.58 and $ 1.79 is large.
Particulars Unit of measures 1. Required hour for buying or cutting raw rattan
Average required hours 11.05 Minimum required hours 2 Maximum required hours 24 2. Required number of labor for buying or cutting raw rattan
Average required labor 1.33 Minimum required labor 0 Maximum required labor 4 3. Expenditure for buying or cutting raw rattan
Average expenditure for buying or cutting raw rattan 1.07 $ Minimum expenditure for buying or cutting raw rattan 0 $ Maximum expenditure for buying or cutting raw rattan 5 $
Table 13. Potential of raw rattan reserve
Note: *1 Total Respondent is 61. Source: Compiled from survey data.
Table 14. Change in rattan handicraft price
Note: *1 Total Respondent is 36. *2 Total Respondent is 53 and 37. Source: Compiled from survey data.
6-6. Potential of demand and supply
In order to estimate the future potential of RH business of Tor Tea village, we attempted to focus on demand and supply potential. According to our survey results, average monthly per household demand is $45.4 and total monthly village demand is about $2103.7. If we compare this figure to village income household data, we can find the big difference. The probable reason would be due to other income, such as from agriculture and husband income. Regarding the supply potential we tried to find (a) whether having enough capacity to produce if demand increase, (b) whether they have time, raw rattan and labor to produce if demand increase. According to survey results, only 22 producers (34.9%) have enough capacity to produce if demand increase. The remaining 41 producers (65.08%) have no capacity to produce even demand increase. If we examine the reason for having no capacity to produce, 21 producers have no time, 10 producers do not have raw rattan and 38
Particulars Unit of measures 1. Raw rattan reserve
Number of household which respond plenty 16 Number of household which respond just enough 41 Number of household which respond facing shortage 11 2. Number of household which buy raw rattan * 1 30 (49.18%)
Particulars Unit of measures 1. Change in product price (Compare to last 2 to 3 years ago)
Number of household that respond; *1
a. Prices are increasing 7 b. Prices are decreasing 2 c. Prices are changing not too much 27 2. General price differential * 2
Retail village price and middle man price (Average) 1.58 $ Retail village price and market price (Average) 1.79 $
producers do not have labor.
Table 15. Potential of demand
Source: Compiled from survey data.
Table 16. Supply Potential
Note: *1 Total Respondent is 63. *2 Multiple-choice. Source: Compiled from survey data.
6-7. Maternal, child health and living infrastructure
Socio-economic condition of the village can be judged by using not only income and expenditure, employment, demand and supply potential but also by the living infrastructure, maternal and child health. In this paper, we also tried to investigate the health condition and living standard of the village people. According to the table 17, about 73% of the village women access the hospital and clinic during the pregnancy and 62% give birth in hospital. However, the village still has 12 households in which children died under one year old and 71 households in which children died under 5 years old. Accordingly, the maternal and child health condition of the village is at a low level. This situation would be mainly because of low level of parent’s education. As mentioned above, the general level of education in Tor Tea village is still low and about 30% of village population are still illiterate.
According to the table 18, only 52 households (55.91%) have toilets particularly due to lack Particulars Unit of measures 1. Estimated monthly demand ( sale value)
Average demand per month per household 45.4 $ Minimum demand per month per household 5 $ Maximum demand per month per household 300 $ 2. Estimated monthly total demand for Toe Tea Village 2103.7 $
Particulars Unit of measures 1. Capacity of production: *1
Number of household which respond;
a. Have enough capacity to produce if demand increase 22 (34.92%) b. Have no capacity to produce even demand increase 41 (65.08%) Reason; * 2
Do not have time 21 (51.22%) Do not have raw rattan 10 (24.39%) Do not have labor 38 (92.68%)
of health knowledge and deep rooted tradition of the village. Regarding drinking water and electricity, 89 households (97.80%) have hand pump tubes wells and 90 households (96.77%) are using electricity. Moreover, 6 households (7.69%) have fixed phones and 77 households (98.72%) have cell phones. Although the village people are poor comparatively they can access water, electricity and phones as the result of support from international organizations and world NGO’s and NPO’s. We should keep in mind that the village of early 21st century is different from that of 19th and end of the 20th century. However, the development of paved asphalt main and linking road is still very poor. For example, although some of the villages of Siem Reap province have electricity lines, the village people do not use the electricity due to the high cost nature of electricity supply.
Table 17. Maternal and child health
Note: *1 Total Respondent is 81. Multiple-choice. *2 Total Respondent is 82. Multiple-choice.*3 Total Respondent is 83. Source: Compiled from survey data.
Particulars Unit of measures 1. Maternal health
Number of household which respond; a. How to take care during pregnancy? * 1
Hospital 52 (64.20%) Clinic 7 (8.64%) Never 24 (29.63%) b. Where did you give birth? * 2
Hospital 45 (54.88%) Clinic 6 (7.32%) At home 39 (47.56%) 2. Child health * 3
Number of household which died under 1 year old 12 (14.46%) Number of household which died under 5 years old 71 (85.54%)
Table 18. Living infrastructure
Note: Multiple-choice. *1 Total Respondent is 91. *2 Multiple-choice. *3 Total Respondent is 78. Multiple-choice. Source: Compiled from survey data.
Section 7. Findings and Suggestions
(a) Average monthly income of Tor Tea village is about 196 dollars, minimum income is 28.8 dollars, and maximum income is 610 dollars. It is clear that the income differential among rich and poor is rather large because maximum monthly income is 22 times higher than that of minimum income.
(b) Based on the average family size of 4.7, we can easily calculate the daily income per capita of Tor Tea village, such as $1.39. This figure is a little higher than international poverty line of $1.25 a day. However, if we base on the minimum monthly income of the village, daily per capita income is about $0.2 and it is only one sixth of international poverty line. In order to escape from the lowest poverty line, the people of Tor Tea village must have average monthly income about $176.3 per household.
(c) In Tor Tea village, 73 households (78.49%) or about 343 people (77.78%) make their living on less than $1.25 per day. Moreover, 4 households (4.30%) or about 19 people (4.31%) make their living on $1.25 to $2 per day. If we compare the national poverty ratio
Particulars Unit of measures 1. Toilet 52 (55.91%) 2. Drinking water * 1 Water supply 0 (0.00%) Well 2 (2.20%) River 0 (0.00%) Pond, Pool 0 (0.00%) Hand pump tube well 89 (97.80%) 3. Electronic * 2
Electricity 90 (96.77%) Generator 0 (0.00%) Battery 1 (1.08%) Candle 3 (3.23%) Buying from private generator 0 (0.00%) 4. Phone * 3
Fixed phone 6 (7.69%) Hand phone 77 (98.72%)
(30.10%) and rural poverty ratio (34.70%), the extent of poverty in Tor Tea village is much higher than the national average.
(d) The differences between maximum and minimum value for the livestock and property, are both very large. This figure gives the impression that income and wealth differential among the villagers seem large.
(e) Although RH producers have enough experience and acceptable skill level, they decide the amount of production based on order quantity rather than product price and demand situation in Siem Reap city center or souvenir shop.
(f) RH producers are producing at their own paces and no one considers establishing rattan production as a business. Moreover, they do not think much about cost and return as well as profit margin, as they are not very business minded.
(g) RH producers are going to face raw rattan shortage problem soon, because 41 RH producers responded just enough and 11 responded facing shortage. It will be appropriate to consider about the preserving rattan forest and rattan plantation in order to solve the rattan shortage problem.
(h) The maternal and child health condition of the village is at a low level. This situation would be mainly because of low level of parent’s education. General level of education in Tor Tea village is still low and it still has about 30% of village population who are illiterate.
(i) Although the village people are poor comparatively, they can access water, electricity and phone as the result of support from international organization and world NGO’s and NPO’s.
(j) Local government, individual, and international organizations should encourage and provide financial support as well as build all weather roads in order to promote demand from tourists.
References
Maung Maung Lwin. 2011. “Investigating Village Socio-economic Condition and Possibility of Poverty Reduction through Sample Survey (The Case of Rattan Handicraft Village of Siem Reap, Cambodia)”. Studies in Foreign Aff airs. 39(1). Kumamoto Gakuen University. pp.
63-86.
Maung Maung Lwin. Jeffrey Morrow. 2013. “ Generation of Employment and Income through English (The Case of Tourist industry in Siem Reap, Cambodia)”. Journal of economics, 19( 3,4). Kumamoto Gakuen University. pp. 93-137.
天川直子、2004、「カンボジア農村の収入と就労-コンポンスプー州の雨季米作村の事例-」、 『カンボジア新時代』、独立行政法人日本貿易振興機構アジア経済研究所。
石澤良昭監修・及川浩吉訳、2002、『カンボジアの農民-自然・社会・文化』、東京 : 風響社。 (原著 Jean Delvert.1961. Le Paysan Cambodgien. Paris Impr. nationale)
山川貴裕、2014、「カンボジアの農村における社会経済状況 : シェムリアップ州タットレイ村 の事例」、『経済論集』、熊本学園大学、第 20 巻、第 1-4 号、59-101 頁。