7he
.laDanese
foutvtalofIlsychonomic Science2009,VoL 28,No,1,2 16
Original
Article
Objective
estimation
of
the
by
Near-Infrared
state
of
content
understanding
Spectroscopy
(NIRS)i>
Nobutaka
ENDo,
MasayoshiNAGAI,and
Takatsune
KuMADA
IVbtional
Jnstitute
ofAdvanced
industrial
Science
and71gchnotog),
(AJST)*
Three experiments used near-lnfrared spectroscopy
(NIRS}
toexamine brainactivation inthefrontal cortex during comprehending and reporting thecontents of a story.
In
Experiment
1,theparticipantswere asked toview humorous comic strip stories under thefollowing two conditions:
comprehending and reporting the contents after the experiment
(report
conditionL and notreporting the contents
(non-report
condition). The changes ofOxy-Hb
concentrationin
the leftprefrontal region were higher in the report condition than in the non-report condttion. In
Experiments
2A
and2B
the participantswere asked toarrange sets of cards, according toeitherstory developrnent or shape comp]exity, without reporting
the
content Dfthe stery.The
changesof
Oxy-Hb
concentrationin
theleft
and right prefrontalregions werehigher
for
card arrangementsrelated to story development than for those related to shape comp]exity. When articulatory
suppression was used, activation inpart of
the
left
prefrontalregion was reduced. The anteriorportion of the
left
inferior
frontal
gyrus(around
BA47)
was consistently activated whenpartici-pants actively triedtounderstand content, regardless of the type ot task and memory load. We
suggest a new objective method, using
NIRS,
with which tomeasure thebrain
activity associatedwith trying tounderstand content.
Key
words: content unclerstanding, near-infrared spectroscopy, objective estimation
When
passing oninformation,
it
i$
important
todetermine whether the information has been
cor-rectly understood,
For
example,in
thefield
ofeduca-tion, teachers can adjust the amounts and/er levels
of
information
that
are appropriatebased
onstu-dents' understanding ifthey can cerreetly assess
each student's understanding.
Substantial
effortshave
been
devoted
to establishing techniquesfor
rneasuring how well people understand information.
i) This research was supported by the "Assistive
technologies to ensure safe and comfortable
lifesty]es
for
persons withdisabilities"
prograrn of theSpeciaL
Coordination
Funds
for
ting Science and Technology, 2004, from the
Ministry of Education,
Culture,
Sports,
Scjence
and
Technology
(MEXT),
Japan.
*
Corresponding
shouldbe
sent toNobutaka
higashi, Asaminami-ku, Hiroshima 731-3195
(e-mail:
[email protected]) or Masayoshi Nagai,National Institute of Advanced Industrial
Science
andTechnology,
Central
6,
1-I-1
Higashi, Tsukuba 3e5-8566
Ce-mail:
In
contrast, no methodhas
been
developed
toeva!u-ate how much effort isengaged in conducting that
task.
The
purpose of the present study was tosug-gestan objective rnethod toshow whether people are making efforts tounderstand content,
Currently, two methods are avai]able tomeasure
human
comprehension. One isthe subjective report.In
subjective reports, students or participants ratetheir own understanding level
(e.g.,
rating theircom-prehension using a
five-pojnt
scalefrom
"understoodcomplctely" to
"could
not understand at aU">.Al-though
this
method iscommonly used ina variety ofresearch areas, itsmain weakness isthat
it
isnotobjective.
For
example, some people may report thatthey understDod the rnateria] very well even when
they actually didnot understand itat all. Incontrast,
others may report that they did not understand the
material even when they really did. Itisnot
reason-ab]e to compare subjective rating scores between
individuals because criteria used in rating may
differ.
The
subjective reporting methodis
also notreliable when applied tochildren or people with
NII-Electronic Library Service
N.
ENDo,
M.
NAGA[,
andT.KuMADA:
Objective
Estirnation
ofUnderstanding
by
NIRS
3
niLive impairment, because it
is
rnore diMcultfor
them tomonitor theirown states of understanding
than
it
is
for
healthy
adults.Anotiner
popularmethod for measuring people's comprehension is
tests of content understanding.
This
rnethodin-volves asking people questions about thecontents of
a story or narrativ'e. This should providc a mere
obiective result, and
it
makesit
possiblefor
testscores tobe compared between individuals. This isa
reasonable method
by
whichto
eva]uate whetherpeop]e understand the pTovided material, However,
neither
this
method nor subjective rating can showhow much effort
is
expended toward the goal ofunderstanding
the
materiaLFor
example,tn
casesin
which subjective rating showed "complete]y
under-stood contents" and content-understanding test
showed
futl
marks,it
is
unclear whetherthe
personactually made any effort tounderstandi the material.
Ifthe contents were too easy, he/she might hardly
make an effort.
In
contrast,ii
the contents werediMcu]t
and were barely understood, helshe shouldhave
rnade rnore effort.[n
other casesin
which thesubjective rating shows "did not understand" and the
content-understandlng
test
showed a low score, itis
also unclear which was true:the person may
haye
activel'y triedtounderstand the content, but failed
(made
more effort), or he/she may not even havetriedtounderstand atall
{made
no efforO.Although
it
is
important foreducational purposes to determinewhether the content
has
been
correctly understood,objectively rneasuring
how
much effort isinvested
in
understanding or to what
degree
children orstu-dents arc trying to understand
is
alsoimportant
in
selecting the appropriate levelof materials to
maxi-mize
learning.
We developed a new way tomeasure brain activity
related
to
trying
to understand content usingnear-infrared
spectroscopy(NIRS).
NIRS
is
an opticalmethod that non-invasively estimates temporal
changes
in
concentrations ofOxy-hemoglobin
(Oxy-Hb), Deoxy-hemoglobin
(Deoxy-Hb),
andTota]-hemoglobin
(Total-Hb)
based on the amount ofab-sorbed near-infrared iight,using the modified
Lam-bert-Beer
Law.Using
the
relationshipbetween
neu-ral activity and regional cerebral
blood
fiow,
aNIRS
system shows activated
brain
regions whereconcen-trations of Oxy-Hb are observed
CVillringer
andDirnagl,
1995).
Brain
monitoringby
NIRS
has
sev-eral merits. The equipment iscompact, making it
easy tomeasure
brain
activity with fewer physica]limitations.
More
kinds
of tasks canbe
performedusing NIRS than with other brain imaging
tech-niques, such as
fMRI
andMEG.
Our main
purpose
was to specjfy brain regjonsinvolved
incontent understanding usingNIRS.
In
particular,
wefocused
on whether people activelytried tounderstand something. Ifthe state of trying
'
tounderstand can
be
evaluatedby
monitoringbrain
activity using
NIRS,
we can provide a new paradigmfor
measuringhuman
cognitive processesfor
neuro-science studies. This brain-imaging method has the
advantage of showing specific
brain
activity, whichcannot
be
determined
using subjective rating orun-derstanding tests.This method can provide
immedi-ate
feedback
on thebrain
aetivity required totry tounderstand content, which wilL for example, allow
teachers toselect appropriate materiaLs
for
theirstu-dents or rnake
it
possible
towarndrivers
who havelost
their
focus while driving.
We
used twokinds
of task toencourage people tounderstand content: testing of content
understand-ing and sequencing of story events by arranging
cards.
Although
therequirements of thesetwo tasksare essentially different,partjcipants inboth tasks
are required to actively try tounderstand the
con-tent, Ifthe specific
brain
activation associated withthe process of understanding can
be
consistentlyobserved regardless of
differences
in
thesetasks,this activation will be a usefu] index to evaluate people's states of understanding.
Experiment
1
In
Experirnent
1,
we used a comic strip $tory toinduce
brain
activity related totryingtounderstand. Wefocused
on the anterior prefrontalarea torecordbrainmeasurements,
because
pilot experimentsindi-cated a steady signal inthisarea.
Methods
Ftzzrticipants,
Thirteen
healthy
youngJapanese
4 The
Japanese
Journal
of PsychonomicScience
VoL
28,
No.
1
adults
(mean
age=22.4 years, SD=1.40, nine rnales,four females) who were nai'vc to the purpose of the
study participatedas paid volunteers.
All
ofpartici-pants were right-handed and had normal or
correct-ed-to-normal vision. Handeclness was determined
using the
Japanese
translated version of theEdin-burgh Handedness Inventory
(Oldfield,
1971).
Writ-ten
informed
consent was obtajnedfrom
all partici-pants.
Stimuli
and tasle.Six
shorthurnorous
comic strip stories were used as stimulL Each story conslsted'of a series ef fourframes.
Four of the six storiesin-cluded original and complete content, the logical
development of which involved an introduction,
de-velopment, turn,and conclusion
(i.e.,
standard storydeve]opment). Four ofthe series were equal interms
of theirunderstandability and
leve]
ofhumor,
based
on the results of priorratings by nine
participants
who did not participate inthisexperimenL In
con-trast,the remaining two series consisted of
four
frames that were randomly chosen from different
stories and consequently made no sense
(i.e.,
scram-bled
stories).Each
frame
of thc story was prcsentedfor 5 s inthe center oi a 22 inch cathede ray
tube
(CRT)
monitor(Iiyama
MA203DD),
so that the totalduration
ef each story was 20s. Participantsob-served the comic strip stories under the following
three conditions.
In
thefirst
condition(the
reportcondition), the normal stories were presented on the
CRT
monitor and participants wereinstructed
tounderstand why the stories were funny. After the
experiment, allof participantswere required togive
a titleto the stories and report the contents and
funn}r elements. In the second condition
(the
non-report condition), the normal stories were presented
and participants were
insi.ructed
to
observe thesto-ries
but
were notinstructed
toreport on theirunder-standing of them.
In
the thirdeondition(the
scram-bled
conditionL participants wereinstructed
to ob-serve the scrambled steries, which could not beun-derstood.
Two of thefour
normal stories wereran-domly assigned to the repert cendition and the other
two to the non-report condition.
Each
condition wasrepeatcd twice, and the order of the conditions was
counterbalanced across participants. Each trial
be-Experjment 1 Pre-time. Stimutatfon :10sec 20 sec lesec Rest30 sec 30 sec Experments 2A and 2B
Pre-time
Stimulation 60 secilOsec 30 sec
10 sec 40 seC loo'sec
Figure
1,
Experimental
schedule.gan with a 1O-srest before the stimulation, followed
by
thecemic strip presentationfor
20
s.Each
presen-tationwas followed by a 30-srest. The experimental
schedule
is
shownin
Figure
1,
Recording,
We
used a multichannel near-[nfraredspecLroscopy
<NIRS)
system(ETG-4eOO,
HitachiMedical
Corp.)
to
measurebrain
activity.Thel
NIRS
unit was operated at near-infrared wavelengths of
695 and 830 nm and was used
to
measure tem,poralchanges
in
concentrations ofOxy-Hb,
Deoxy-Hb,
andTotal-Hb.
We
used a pair of pro'beholders, eachconsisting of a
4
×4array.Sixteen
optodes(eight
emitting and eight detccting) constituted 24
chan-nels ineach probe. The distance
between
eachemit-tingand thecorresponding
detecting
optode was3.0
cm. The sarnpling rate foreach channel was apprexi-mately 10Hz.
Probes were
placed
on thetronta]
region of eachhemisphere
(Figure
2).
Cz
in
theinternational
10/20
system was set to align with the connecting
line
between the positionsat thesuperiQrlposterior
cor-ners of the arrays
(i.e.,
the emitterfor
the right probeand the detector for the leftprobe), and Fz was
aligned with the middle of the two connecting lines
between the positions at the superiorfanterior
cor-ners of
the
arrays andbetween
the
positionsatsupe-rior/seeond
from
anteriorintersections
of the arrays.Because particlpants'heads were not exactly the
sarne size, the
Fz
posjtiondiffered
slightly amongparticipants, The position of each column of emitters
or
detectors
in
the
arrays was paralle]tothe
midline of thebTain.
We
examined brain activation inChan-ne]s
1-7
inboth
hemispheres as the region ofin-tercst,according toresults
from
a pilot experiment.Data analysis. All ef thc tria]swith movement
Rest60
NII-Electronic Library Service
N
ENDo,
M,
NAGAi,
and T.KuMADA:Objective
Estimation of Understandingby
NIRS 5E・I
Emitter Detector
Channel
Figure 2. Pesitions of optodes p!aced
in
linewith the prefrontal regions
in
both
hemi-spheres.
The
distance
between
each emitter(indicated
by light gray squares) and thecorresponding detector
(indicated
by darkgray squares) was
3cm,
These emitters anddetectors
were placedin
probes with4
×4
arrays, NIRS responses at
Channels
1-7
in
both hcmtspheres were analyzed in
ment
1,
whereas those at all channels wereanalyzed
in
Experiments
2A
and2B.
Nasion anterior
wao-@ew@-@@@@
"@me.@m(Dma
@@@@
ss@"@ww@-@@@@
-@ma@m@wa
Fz,:
cz='
ewo-@ma@"CD@@@
m@wa@m@wa
@@@@
me(i})M@ee@-@@@@
-@ge@-ge:/s
H
posterior 3cm wam Iniono
artifacts, determined
by
steep changes in the timeseries of the concentration of
both
Oxy-I-Ib
andDe-oxy-Hb, were removed from the analysis, The raw
data
of Oxy-Hb and Deoxy-Hb from individualchan-nels were normalized,
because
the rawNIRS
data
were originally relative values and could not be
aver-aged
directly
across participants or channels.The
z-scores forthe normalized data could be averaged,regardless of the unit of measurernent
{Matsuda
andHjraki, 2006; Shimada and Hiraki, 2006;
Otsuka,
Nakato, Kanazawa, Yamaguchi, Watanabe, and
Kakigi,
2007).
The
g-scoresfor
changesin
Oxy-
andDeoxy-Hb during the task
(z-Hbt,.i,}
were calculatedas follows:
z-Hbta.k=
HbtaskJMean(Hbp,..t,.,)
.
SD(Hbpre-time)
Hbpre.tiine
andHbtask
representHb
data
in
the pre-timeand the task periods, respectively.
A
mean and aStandard
deviation
for
changesin
Oxy-
andDeoxy-Hb
in
the totalpre-time period were ca!culatedfor
each trjalin each channel, and the z-score o'feach
data point
in
Oxy-
andDeoxy-Hb
during
the taskperiod
in
each trialin
each channel was calculatedbased
on that trial'sand channel's mcan andstan-dard
deviation,
Prevlous
studies indicated that thehemodynamic
responses typicallylagged
behind
thestimulation by a few seconds. AdditionaUy, some
task-related
brain
activity should occur after the endof the comic strip presentation, Especially
in
thereport conditien,
it
was likelythat participant$ac-tivelytriedto remember the content of the story
after the presentation. Thus, we defined the comic
strip presentation
(20s)
as the stimulation period;both the stimulation and the rest
(30
s) periods wcredefined
as the task period; the last10s
of the re$tperiodwas
definedi
as the pre-taskperiodfor
the nextpresentation,
In
preparation forN'iRS
data
analysis,thee-scores of
Oxy-
andDeoxy-Hb
werefiltered
withtherunning average over 5.0sand calculated at each
point
in
the time seriesdata,
The
averaged z-scoresof Oxy- and
Deoxy-Hb
were calculated foreachchan-nel and each condition for individual participants.
The
data
were compared among the task conditionsusing repeated-measures analysis of variance
{ANOVA),
using theGreenhouse-Geisser
correction.These data calculation and statistical procedures
were also used toanalyze the results of
Experiment
2,
Results
andDiscussion
Al]participantscould reasonably provide a titleto
the cornic strip stories presented
in
the
reportcondi-tion,and they could a]so correctly recal] the
con-tents,
Accordingly,
we confirmed that theycorn-pletely understood why the stories were considered
humorous. A total
gf
five trials with movementartifacts were excluded
from
the analysis(1
trialin
the report condition, 1 in the scrarnbled condition, and 3
in
thenon-report condi,tion).Overall,
Oxy-Hb
concentrations inthe reportcon-ditiontended toincrease during and after thecomic
presentation
in
theleft
and right prefrontalregions(Channels
1and 4i,n
the lefthemisphere and3
and7
in
therighthemisphere;
Figure
3),
However,
no suchtrend was observed
in
the other two conditions.In
con-6
The
Japanese
JournaL
ofPsychonornic
Science
VoL
28,No.
1
A
Ch 18sm=Aas
UEgbt:tit TEme[se[] Ch4 ChS Ch2 Ch] 10 20 30 40 50 Time[se[1 5 o-560
O Ch6li
ll
'
i'"
/+t-tttttntL-"t1'
i /10 20 30 40 SO 60 Time[sec] Ch - Report uapha-- Non-reportiiii""i",-"t
Scrembled so-so
lo 2a 3o 4o se 6o Time[sec] 7 5e-so s o-5
la 2o 3o 4a so so o Tlme[se[]tt
tl
/1tt
tt
tt
tt
: :..,..,,..,,L..1",,
tl
!/'10
70 30 4D SO 60 Time[se[]:-so
//
//
//
//
//
////
/
t-t
i'//
//t/lo
2o 3o 4o so 6a Time[se[1 Ch1Bg
:T E:of:t
.5o
Time[secl Cb4 ChS 5 S; :'ll
l: D O :-h...l,....
I/ i'-5
-S
a lo 2o 3o 4a so 6o o lo 2o 3o Tlme [sec]Figure
3.
Time
course ofthe
averagedperiods
in
the(A)
left
and(B)
rightindicatcd between the vertical dash
Ch2 la Clt3
-5
2D ]a 4o so so o lo 2e 3D 4o so 6o Time[secl Tlme[sec] Ch6 Ch7 511 S 11 11 11 o. o 1 "'.-".es F' 11-
-s
6o o lo 2o 3o 4o so eo o lo 2o ]o 4o so 6e Tlrne [sec] Time [sec]
in
Oxy-Hb concentration during the pre-task and
Comic
strip stories werc presented during the40 50 Tlme[sec] change
hemispheres.
ed lines. tasktirneditiontended todecrease during the task period in
the
lcft
and right prefrontal regions(Channels
1
and4 in the lefthcmisphere and 3 and 7 inthe right
hemisphere;
Figure
4).
To
demonstrate
the
Lenden-cies of the actixration during each of thestlrnulation
and task periods,we analyzed
data
for
each periodseparately.
The mean z-score$ of
Oxy-
and Deoxy-Hbconcen-trations during the stimulatiQn
for
each channclwere subjected te two-way ANOVA with channel
and taskcondition as the main factors,For Oxy-Hb
concentratjons inthe lefthemisphere, the analysis
showed a significant interaction between channel
and task condition:
FC2.19,
26.29}=5.26,P<,Ol).
Inthe right hemisphere, none of the main effects or
possib]e interactions was significant. The channels
activated inthe report condition compared with the
other conditions are shown inTable 1. For
Deoxy-Hb concentrations, none of the rnain effects or
possi-ble
interactions
was significant ineither hemisphere.We also assessed the Hb concentration changes
during
the
task
period. ForOxy-Hb
concentrationsin the lefthemisphere, the analysis showed a
sig-nificant
interaction
between
channel and taskcondi-tion:
F(2.07,
24.87)=7.45,P<.O05.
Inthe righthemi-sphcre, a significant interactionwas found between channe! and task condition:
F{1,71,
20.49)=3.96,
P<
.05.
The channels activatedin
the report conditioncompared tothe other conditions were
found
in
both
hemisphcres
(Table
1). ForDeoxy-Hb
concentra-tions,none of the main effects or possib]e
interac-tions was significant ineither hemisphere,
The
left
and right prefrontal regions wereacti-vated when participantszctively tried t.ounderstand
the cornic $trip stories and to memorize their
acti-NII-Electronic Library Service
N.
ENDo,
M,
NAGAi,
andT.KuMADA:
Objectjve
Estimation
ofUnderstanding
by
NIRS
7
A
Ch 189eGv
ts2usSg Tlme[sec] Ch4 Ch2 ChS 10 2D 30 40 50 60 Tlme[sec] Tlme[sec] Tlme[sec] Ch3 Ch6Time[secl t Report ww Non-repert "i"i"-"i" Scrambled lo 2e 3o 4e so so Tlme [se[] Ch7 Time[sec]B
so Ch 1 8?eeu tsi8ss Time[sec] Ch4 Ch5 Ch2 10 20 30 40 SD EO Timelsec]Ch6 Ch3 TLme[sec]Ch7 5D seii'ii'/=
-S
-5
-5
-S
o lo 2o 3o 4o so so o la 2o 3o 4o so 6o o lo 2o 3o 4o soso o lo 2o 3o 4o so 6oTime[set] Time[se[] Tlme[sec] fime[se[1
Figure
4, Time course of the averaged changein
Deoxy-Hb
concentrationduring
thepre-task ancl taskperiods
in
the(A)
Ieftand(B)
righthemispheres.
Comic
strip stories were presented during the time
indicated
between
the verticaldashed
Iines,vation of theIeftprefrontalregion was important for
understanding the stories,
because
thisregion wasactivated during the stimulation. This activation
was not obscrved
in
the
non-report or scrambledconditions, and no difference
between
thetwocondi-tionswas observed. Oxy-Hb concentration changes
were
likeLy
more sensitiveto
the understandingprocess
than were Deoxy-Hb concentration changes, andDeoxy-Hb
changeshad
less
variationduring
the
task period than did
Oxy-Hb
changes. Thus, itseemspossible to evaluate whether participants tried to
understand thecontents of the comic strip stories
'by
monitoring Oxy-Hb concentration changes,
How-ever, itj,sa]so likelythat our results were caused
by
interactionsamong the processes of understanding,
memory, anclfor motivation. Because participants
had
to
actively remember the contentsin
order toreport them after the experirnent, the memory load
could increaseandfor themotivation might bemuch
higher
in
the report condition.We
addressed thisissueinExperiment 2A.
Experiment
2A
InExperiment 1,we showed that activation inthe
left
prefrontal region was usefulin
eyaluatingwhether a person was trying tounderstand content.
In
Experiment
2A,
we exarnined thispossibilityus-ing
another task thatdidnot require an activemem-ory process, but that controlled ior the motivation
factor.
The task inExperiments 2A and 2B was tosort picture cards insequential order. Experiments
2A
and2B
wereidentical
exceptfor
thetask requiredof participants.
Methods
1]kerticipants.Fifteen healthy young
Japanese
8 The
Japanese
Journa]
of Psychonomic
Table
1
Channels
activatedin
thereport condition,compared with thenon-report and the
scrambled conditions
in
Experiment
1.
Science
VoL
28,
No.
1
Stimulation
periodTask
periodMean eh Condition k-score Mean ch Condition z-score
Leftlreport
1.30
non-report-
1.72* scrambled-2,20***
4report
2.03
non-report-
l.87* scrarnbled-2.18***
l
report 1,62 non-report-
1.46** scrambLed-
1.72**
4report
2.71
non-report-
1.48** scrambled-1.48*'
Right
3report O.62non-report
-1.76*
serambled
-1.l3
7
reportO.59
non-report
-
!.79*.s.
cram,bled-1.2.5.
*P<,05, *"EP<.Ol, **#EP<.eOl: NewmanJKeuls test
for cemparison with mean a-scores in the report
eondition.
adults
<mean
age == 22.7years,SD
= 1.80,10males, fivefemales)
who were nai've tothepurpose of the studyparticipated as paid vo]unteers.
All
participantswere right-handed and had normal or
corrected-to-normal vision.
Handedness
was determined usingthe
Japanese
trans]atedi version of the EdinburghIIandedness Inventory
(O]dfielcl,
1971). Writtenin-formed
consent was obtainedfrom
allparticipants.Stimuli and task, We used two types of picture
cards as stirnuli
in
Experiments
2A
and2B.
One
typeconsisted of sets of picturecards used inthe picture
arrangement testof the
Wechsler
Adult
Intelligence
Sca]e
(WAIS),
Unlike the simp]e observation of the comi ¢ strip story in Experiment 1,inExperiments2A
and2B,
participants were askedto
arrangethe
picturecards sequentially to make reasonable stories
(the
story condition>. The other type of stimuLusconsisted of sets of cards printed with nove],
rnean-ingless shapes
(Endo,
SaikL
Nakao,
&
Saito,
2003).Participants
were required toarrange the cardsse-quentially according tothe subjcctive complcxity of
shapes
(the
shape condition). Although participantsneeded toarrange the cards
by
hand
in
both
condi-tions,in the story condition, participants were
re-quired to actively understand the content of each
card, as well as
the
context and reasonabledevelop-ment of the given story.
However,
unlikeExperi-ment 1,participants did not have to remember the
contents of the story after the task period.
In
con-trast,in the shape condition, only perceptual
judg-ments of shape complexity were required.
Each
task
condition was repeated threettmes,and participants
perforrned the two tasks aLternately. The orcter of
the
conditions was counterba]anced acrosspartici-pants. Eaeh trialbegan with a 10-srest, fellowed by
card sorting
'for
30
s,and then a60-s
rest{Figure
],).In the story condition, participants were instructed
to
actively understandthe
story content anddeter-mine the reasonabLe order of thestory within 30s. In
the shape condition, participants were instructed to
determine
the
reasonable order of cornplexityin
the
sets of novel shapes using a consistent criterion. If
participants eempleted the sorting before the time
limit,
another set of pictures(or
shapes) was given.After sorting the cards,
participants
were asked torelax
during
the rest period.
Recording.
The
NIRS
s}rstem, the measured chan-nels, and the placement of the optodcs were identicalto those
in
Experjment
1,
whereas the tasks andrnaterials presented were different. The channels
examined in Experiment 1 were selected based on
the results of the pi]otexperiment with the task of
Experiment
'L.
butit
was not clear whether these-lectedchanneis would
be
appropriate tothe task inExperiment
2,
Thus,
we needed toanalyze a wider range of brainregions, and we examined all channels{i.e.,
24
channeisin
eachhemisphere>
because
thistask was likelytoresult
in
brain activities indiffer-ent regions than those monitored inExperiment l.
Data anatysis,
We
focused onthe
Oxy-Hb
concen-trationas the index of
brain
activationbecause
inExperiment
1,
Oxy-Hb
was rnore $ensitive to theunderstanding process
during
the
task period thanwas Deoxy-Hb. In
fact,
in
manyNIRS
studies,changes
in
Oxy-Hb
concentration are primarily usedinanalyses
(e.g.,
Matsuda & Hiraki,2006;Otsuka
etal,,2007) because they are most sensitive tochanges
in
regional cerebralblood
fiow
and are correlatedsig-NII-Electronic Library Service
N. ENDo, M,
NAGAi,
and T.KuiaADA:Objective
Esttmatton
of Understandingby
NIRSnal
(Hoshi,
Kobayashi, & Tamura, 2001; Strangman,Culver,
Thompson,
&
Boas,
2002>.
All trtalswith movement artifacts were exc]uded
from
analysis, andthe
Oxy-Hb concentratien rawdata were norma]ized as z-scores. We analyzed the
data regardless of the accuracy of the card arrange-ment
because
wefocused
onbrain
activation thatwas related totheattempt tounderstand, rather than
tounderstanding something correcdy.
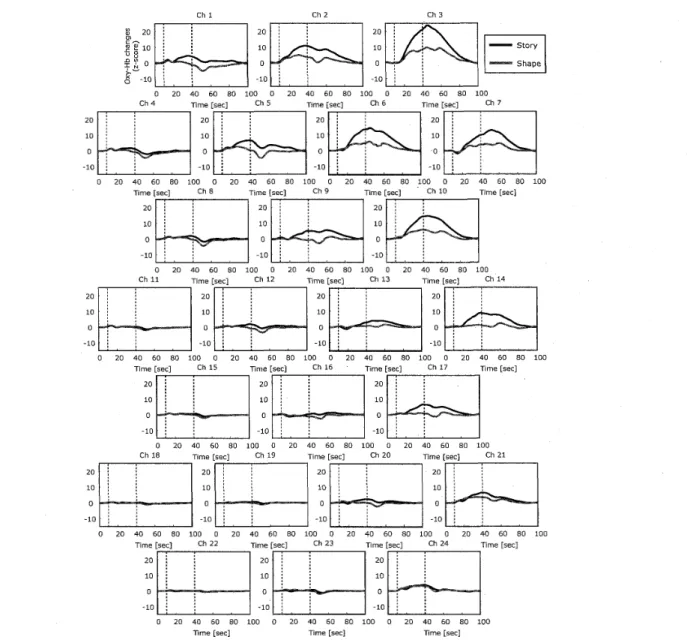
Results
and Discussion
One
trialin
the shape condition was excludedfrom
the analysis because of movement artifacts. In the
story condition,
the
Oxy-Hb
concentrationstended
Ch1 S20 20i
o
t
[.. I::
10 IOI i:o oi/Lt
.
).
t
6-lo.lo
:・ O !O 40 60 SO iOO O 10 Ch4 Tlme[se[] ChS 20 20 10 10 o o-10
-10
O ZO 4TU/rnefi[Psec]60100chsO 20 4TOimee[Osec]80 2ai i 2oi il i 10: ID: ll i ",: o,
-lo,
ii,
-rn,
i/t
/
O 20 40 fiO BO 100 O 20 Chll T/me [sec] [h12 20 20 IO 10 o o.10
-10
o 2o 4o Go eo loo o 2o 4o 6o so 20 ZOi ]/ 10 101 i e o l.LO
-10i
20/1 20 10Ii 10 o i a :1-le
,
:/,
-10
o' 2oko
6o sD ioe o 2o 4o 6o eo Tinie[sec] Ch22 Jjme[sec]t/ 2o: / ?n :1 10:1 10 :1 ol o
-10,
i 1',
-10
O 20 40 SO 80 100 O 20 Time[se[]Figure 5.
Time
course oi the averaged change
Experiment
2A.
Card
sorting was performed
lines.
9
to increaseduring and after card sorting inthe same
Ieft
ancl right prefrontalregions(Figures
5
and6)
as
in
the report condition inExperiment 1:Channels 1and
4
in
the
]efthemisphere and3
and7
in
the
right
hemisphere.
To examine the trendsin
activationduring each stimulus
(during
card sorting) and task
<durjng
card sorting and resting) periods,we]yzed thedata foreach period separately. The mean
z-scores of
the
Oxy-Hb
concentrationsduring
cardsorting foreach channel were subjected totwo-way
ANOVA
with channel and task condition as maineffects.
In
theleft
hemisphere
(Figure
5>,theanalysisshewed significant main effects o'[ channel: F(3.30,
46.23}=9.11,
P<.OOI;
andtask
condjtion:F(1.00,
ChZ [h] i 20:1 l
'
ii 10: 1---
Starv :/ :l.iOai
I
nv
shnpe 40 io uo lop o 2D 4D 6e ao 100fime[seel ChE Ime[EE[] Ch7
2o 2oi1 :1 10 tO:1 11 o o, 11
-10
-101
1//
10e o !o 4o Sv Bo mO o 20 40 60 SO loD Chg T/me [set] ChlO ImE [sec]i lo:1 i :: 10 : : ::
I
.r,li
'40
6D BO tOO O 20 40 60 80 100 Time[sec] Ch13 Time [sec] Cht42011 ZO :1 1-,, 10 :1 o o :[
-10
・・
-10
tt
loo o 2o 4o 6e so loo o 2o 4o eo sz loD
Cht6 Time [sec] Cht7 T/me [sec]
20 il to o li
-10
40 EO SO 100 O 20 40 fiO 80 100 Tlme[se[] Ch20 -me[sec] Ch21 20 20 10 10o m
-10
-10
loo o 2D 4o so so leo a zo 4o 6o so mo Ut13 Tirne[sec] Ch24 T/me[yec]20 : 1 10 : 1 :1 o :t
-10
: : 40 60 EM tMO O 20 40 SO EO 10D TImeLsec] TimeLsec]in Oxv-Hb concentration in the
during the time
indicated
betweenleithemisphere tn
10
2010o-10
2o10o-IC D
o
The
Japanese
Journal
ofPsychonomic
Science
VoL 28,No. 1Chl ChZ Ch3
um
t/
tt
av 20:1 20 20],
at,
,
[t'
t/
''
e:mii
io ioii-story
U,
di
um
,
:/TiiO/, O n/ l
nv
shapeit :1 1:
o-la: /
-10
-lo/
/Chg Jlme[Eec] ChS -me[se[] ChG Tir/e[se[1 Ch]
t/
ZO:1 20 20 :1 tO:: 10 10 :t D, u o :/-10ii
-10
.tm
?o 4o Eo Bo lon o ?n 4n 6e eo too o ze 4e Ee so loo o 2o 4o Eo so loo
Time[se[l th8 "me[secl Chg T/me[sit] ChlO -me[secl
//
ZOII 20 20 11 10;/ 10 10 :: O, D O 1:-10
・
・
-lo
-te
o' 20
to
Eo ao mo o 2oto
6o so MO O 10 "o 60 8e loOChll Time [secl Ch12 1'i,"E[se[1 Ch13 T/me [sec] Ch14
2o 1[ 20ii :: lo lo loiI O O l/ D
,
11
-10
-10
-1011
//
2o 4o Eo SO 100 O 20 4o SO So 100 O ]O 4o so eo 100 O 20 40 fiDeO leOTIrae[sec] [h lS T/me[sEcl Ch tS I]me[sec1 Ch17 T/me [set]
20 20:/ 20 il lo Iail do o ol
',
e-10
-10,
l[,
-10
O 20 40 eO SO 100 O 20 40 60 6o !Oo o 2o 4o 60 em loOChlS Ti/ne[gec] [hlg T/m"[sec] Ch20 T/melie[1 Ch21
i,
?Oil 20 2D/t
t
/t
i 10ii 10 lot
/t
t
/t
i oli o o/
tt
i-IMil
-10
.10
20 40 60 SO 100 O 20 40 60 EO 100 O 20 4D 60 80 1,OO O 20 40 60 SO tOO-me[sEc] Ch22 1'/mE[Ee[1 Ch23 Time[sec] Ch14 T/me[sec]
lei i 20 20 10: : 10 10 L: 2010o.10iI io o,
-10
: o
Figure
6.
Tiine
course of theExperiment
2A,
Card
sorting lines.14.00)=11.25,P<.O05.
A
significantinteraction
wasalso found between these factors:F(3.38, 47.38)=
4.26,
p<.Ol,
In
the rightherrijsphere
(Figure
6),
theanalysis showed significant main effects of channel:
F(2.95, 41.31)=3.69,
P<,05;
and task condition:F(1.00,
14.00)=9.48,
p<.Ol;
as well as a significantinteraction
between
thesefactors:
F(3.49, 48,84)r-3,19,P<.05.We also assessed Oxy-Hb concentrations during
the
task period. IntheIcfthemisphere
(Figure
5),
theanalysis showed significant main effects of channel:
F(2.45,
34.23}';12,79,
P<.OOI;
and task condition:F(1.00,14.00)=
11.08,
P<.O05;
as well as a significantinteractien between these factors:FC2,84, 39.78)=
O D
i
-tO
-10
2o 4D 6o sc too o 2m 4o En 8D tDO O 20 40 SO eO
T/me[sec] TLme[sec] Time [set]
averaged change
in
Oxy-Hb
concentrationwas perEormed during the tirneindicated
100
in
thebetwecnrightthe
hemispherc
invertical dashed
4.39,p<.Ol. Inthe right hemisphere
(Figure
6),theanalysis showed significant main effects of channcl:
F(2.39,33.38)=6.07,
P<.O05;
and task condition:F(1.00,
14,OO)=-9,48,
p<.Ql;
as well as a significantinteraction between these factors:F(2.48, 34.69)・.=
3.45,
P<.05.
The channels activated in the storycondition compared to the shape condition are
shown inTable 2.
Consistent with the results of Experiment 1,
acti-vation occurred intheprefrontalregions
during
cardsorting.
Further,
moreinferior
and posteriorareas ofthe prefrontal regions were actlvated during and
after card sorting inboth hernispberes. Oxy-IIb
NII-Electronic Library Service
N.ENJ)o,M. NAGAi, and T.KuMADA:
Objective
EstirnatiQnef Understanding by NIRS 11Table 2
Channels activated inthestory condition,
compared with the shape condition in
Experiment
2A,
Stimulation
periodTask
periodchDifferencechDifference
Left123456811
3.30***3,99***2.85***3.40***2.25***2.49***1.80***1.65*
124568113.44***3.87***3,83***2.61***2.58*2,56***2.28***
Right1236710
3.83**3.90**3,14**3.94**2.07**2,47**
1236710 3.33**3.45*4,02**3,85**3,48**3,04**
"P<.05,
*SP<.Ol, **"P<.OOIrNewman-Keuls
testforthe differenceInmean z-scores between
thestory and theshape conditions.
higher
than werethose
in
the
shape condition.Thus,
itseerns unrikety that the activation in the anteriorareas of the prefrontalregions
(i.e,,
Channels
1
and4
in
the lefthernisphere)
in
Experiment
1
was causedonly by memory processes. However, the resu]ts of
Experiment
2A
couldhave
been
causedby
otherprocesses,such as verbalization of thescenes and the
relation between thescenes, because according tothe
study of
OkamQto,
Dan,
Sakamoto,
Takeo,
Shimizu,
Kohno,
Oda,
Isobe,
Suzuki, Kohyama, and Dan{2004),
theactivated area corresponding to Channels 1and 4
in
theleft
hemisphere cou]d overlap with orsur-round Broca's area, which
is
invo]ved
in
language
processing, speech production, and comprehension,
Infact,most of participants reported that they used
inner
speech as a strategyduring
the picturear-rangement. Thus, it
is
possible thatthe brainactiv-ity
re]ated toactive processes of comprehension ob-servedin
Experiment 2A could reflectinner
speech-related activity. We addressed thisissueinExperi-ment 2B toidentifyspecific channel positionsrelated
to attempting to understand content.
Experiment
2B
In
Experiment
2B,
we examined whether thc acti-vation of the leftprefrontal region(i.e.,
Channels
1 and 4)during
picture arrangernent was causedby
participants' strategics, such as
inner
speech.Our
aim was
to
specify the channel positionsthat can beused to assess participants'states of tryingto under-stand content, rather than
inner
speech,Per
se.Methods
thrticipants. Fifteen healthy young
Japanese
adu]ts
(mean
age=22.6 years,SD-1.20,
10
males,five
females)
who were nai'vc to the purpose of the study participatedas paid volunteers. Allofpartici-pants were right-handed alld
had
normal orcor-rected-to-normal vision. Handedness was
deter-mined using the
Japanese
translatedversion of theEdinburgh Handedness Inventory
(Oldfield,
1971).
Written informed consent was obtained from all
par-ticipants.
StimutL
task,andProcedure.
We used the samepictureand shape cards and experimental
design
andschedule as in Experiment 2A. Participants'tasks
were also
Identical
tothosein
Experiment
2A,
exceptthatparticipants were required toperform
articula-tory suppression
(repeatedly
verbalizing thesyllable "da")during
card sorting toblock
inner
speech.We
rneasured the same channels as
in
Experiment 2Aand focused on changes in
Oxy-Hb
concentration,Results and Discussi,on
No trials with movement artifacts occurred
in
ei-thercondition, and
data
for
alltrialswere analyzed.Inthestory condition,
Oxy-Hb
concentrations inthe
left
and right prefrontalregions tended toincrease
during
and after card sorting(Figures
7and8),
The meanOxy-Hb
concentration g-scores during thestimulus period for each channel were subjected to
two-way ANOVA with channel and taskcondition as
main effects. In the Iefthernisphere
(Figure
7),the analysis showed a significant main effect of channel:F(3,22,
45.03}
=;4.63,p<.Ol;
and a significantinterac-tion
between
channel and task condition: F(4,93,68.96)=2,72,P<,05.
Inthe right hemisphere(Figure
12
2S10o・10
2eIUo-10
The
Japanese
Journal
ofPsychonomic
Science
Vol.28, No. 1Chl [h2 Chl
9..
eglo
1[ lo-storv
t:t'O
O O "-.ma Shapeit
a-10
-10
.lo
O 20 40 60 8o loo o 20 40 60 SO 100 O 2o aa se BD LOO
th4 T/me[!ec] ChS Imetsec] [h6 T/me[sec] Ch7
tt
t/
?n ]o:/ 20:/t/
t/
t/
t/
t/
t/
tt
t/
o o', ol' :1 lt-10
-101]
-IDIi
t
/
20 4Q EO SO IOO O !O 40 EO 80. ±OO O IO 40 6D SM 10D O 20 40 EO 8D 100T/me[se
£
] ChS Time[sec] Chg T/ffte[se1 Chln "rne[se[]20 20 10ii
lo 10 10il
o o oi
ii
-10
-10
-10:1
o 2o 4o 6o so ioo o 2c 4o
Ee
eo ioo o' 2o 4a Gn Ets nDChll T/mu [secl Cbl!
'1'ime
[sec] Ch13 -mE [sec] [h1420 ?Oii 201i
t/
t/
/t
IS 10 :, l 10I :,tt
tt
t/
tt
o Di, ei'//
/t
.lo
//
-lol
/t
l.lol
l20 -・O 6v EO IDD o ;D 40 SO eO 100 O 20 4o SO Eo Mo O 20 4o 6a He luO Ime rse[] Ch lE T/me[sec] Ch16 Tgme[se[1 Ch17 T/me[ser]
20 20 20
10 IU tD
-10
-10
-10
O ?O 40 60 80 100 O 20 4o Eo sz lom m ?O 40 eO EO 100
ClitS T/me [sec] Chlg 11m: Esec] Ch20 T/me [sec] Ch21
l PO 20 ?o
l
1 ID 10 10
i
.r,
.r,
.:,
20 qO Go Eo 10o o 2e 4m SO eo loo o 2D 4o se so loo a ZO 40 eO eo 100
Timelse[] Chl2 -me [sec] Ch23 Time [sec] [h24 T/me tse[]
t/
?O ?O 2ll:1 ii o o 2u10o.10Iil:io n-10
O 20
Figure
7.Time
coursc Df theExperiment
2B,
Card
sorting
lines,
8),the analysis showed significant main effects of
channel:
F(3.30,
46,19)=3.26,
P<,05;
and taskcondi-tEon:
F(1,OO,
14.00)==6.90.p<.05;
as wel] as asig-nificant
interaction
between thcse factors:F(4.31,60.35)=3.52,p<.oll
We alse assessed Oxy-Hb concentrations during
the task period.Inthe]efthemisphere
(Figure
7),
this
analysis showed sjgnificant main effects of channel:
F(3.27,45.74)=9.41,
P<.OOI;
and task condition:F(1.00,
14,OO}==
11.13,P<.O05;
as well as a significantinteractien between these factors:F{3.65,
51,15)--4.02,p<.Ol. In theright hernisphere
(Figure
8),
the
analysis showed significant main effects of channel:
F(3,42, 47.82)=8.37,
P<.OOI;
and task condition:o o,,
1:
-10
-10:/
4e 6o Eo 1[o o 20 40 GO SO 100 O 20 4D 6u fiO lao Tllne[se[] TlmeL'!ec] Ime[se[]
averaged change
in
Oxy-IIb
concentrationin
thewas performed
during
the timejndicated
betweenleftthehemisphere
in
vertical dashcd
F{1,OO,
14,OO)=21.15,P<.OO1;
and a significantinter-action between these factors:F(3.90, 54.54)=6.93,
p<.OOI.
The channels activated inthe storycondi-tio'n,compared wjth the shape condttion, are shown
inTable 3.
The areas inthe leftprerrontal region that were
activated
during
and after card sorting were reducedwhen parLicipants were asked toperform
articula-tory suppression
during
card sorting. Inparticu}ar,the brain activation in
Channel
4 that wasconsis-tently observed in Experiments 1 and 2A
disap-peared, suggesting that activation
in
Channel
4
in
the left prefrontal region w・as likely caused by
strat-NII-Electronic Library Service
N,
ENDo,
M.
NAGAi,
andT.
KuMADA:
Objective
Estimation
orUnderstanding
by NIRSchl Ch2
.Ch]
m ::
cn
EYIo lo lol/
-SteFy
u8 1l
E:,o o oi/ ww shape
/-
t/
S'
-to
-to
-toli
O 20 40 SO SO 100 O 10 4M Ea so loo D ?o 4o so sO.100
Ch4 T/me[!e{1 ChS 1'jme[secl ChS
.
T/me[sec] Ch72eii lo 20 20 10:1 10 10 10 :1 o, o o o
-10,,
ii.10
-10
-10
O !O 4e GO 80 100 O 2o 4o eu Em mD o !o 4a eo eo.loo
o 10 4a SO BO 100T/me[set] ChS Tjme[sec] Chg T/merse[] ChlM Time[sec]
20 20 20
10 10 10
o o o
-.LO
.10
-10
o 2o 4o 6o so ioe o 2D 4D fio so loo o 2o 4p so so too Chll Ime [secl Ch 12 -me [sec] Chi] Tlme [sec] Ch14
2D 20 IO 20 tD 10 10 10 O U O D II le 10 1・1 10 /1 o ol' o ii
ChAe Time [sec] Chlg T/me [secl Ch20 nme [secl Ch21
20 20 201i 20i]
tt
tt
/t
//
o M Oi l, Oli-!O
-10
-LO:1
-10:1
t/
t/
iii[II io io o, i
-to
: oFigure
8.
Time
course of theExperiment 2B. Card sorting
lines.
'
egy. In contra$t, the activation
in
Channel
1in
theleftprefrontal region was observed conststently in
al]experiments, regard]ess of
the
type
of task,thepresented stimulL memory
demand,
or motivation,This suggests that a participants'state of trying to
understand content can
be
evaluatedbased
on thisspecific
braM
activation. Incontrast, brainactiva-tion
in
the right prefrontal region showed trendssimilar to those in
Expertment
2A.but
thisactiva-tion was not observed Experiment 1, A possible
interpretation
isthat thetictivity
inthe righthemi-sphere may reflect task-spccificfactors related to
story
formation
by
sortlng picture cards.o o
I i
-10
-10
2z 4o 6o Eo loD O ZO 40 GO BO laO o 10 4D Eo so
Tirne[sec] Ime[sec] Tlme[sec]
averaged change in
Oxy-Hb
concentrationwas performed
durjng
the time lndicated100 in thebetweenright the
13
hemisphere
in vertical dashedGeneral
Discussion
We
bave
provided evidence that trying tounder-stand content leads to activation
in
the prefrontalregion of the lefthemispheTe
(Experiment
1)and ofboth
hemispheres
(Experiments
2A
and2B).
Changes
in
Oxy-Hb
concentrations tnthe activatedareas were consistently
higher
in
tasksthatrequiredparticipants]active effort tocomprehend than inthe
other tasks,
Our aim was to previde a new paradigm forthe
measurement of human cognitive activity related to
the
process oftrying
tounderstand contentbased
onChan-14
The
Japanese
Journa]
ofPsychonomic
Scionce
VoL
28,
No.
1
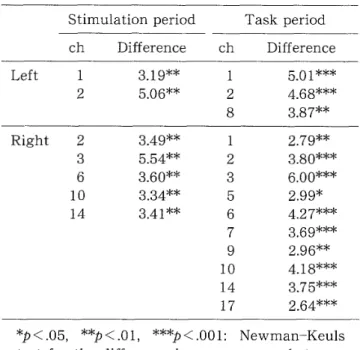
Table
3
Channels
activated inthe story condition,compared with the shape condition in
Experiment
2B.
Stimulation period Task period
chDifferencechDifference
cal processing of words actjvated
BA
44f45,
andsemantic processing of words activated BA 47/45
(e.g,
Poldrack,
Wagner,
Prull,
Desmend, Glover, &Gabrieli,1999). The articulatory suppression
proce-dure
in
our study might only disrupt processingin
Left12
3.19**5.06**
128 5.01***4.68***3,87**Right2361014 3.49**5.54**3.60**3.34**3.41**1235679IO14l72.79**3,80***6,OO***2,99*4.27***3,69***2.96**4.18***3.75***2.64***
EP<,05,
**P<.Ol, **-EP<,OOI: Newman-KeulstestfoT the diifferencc
in
mean a-coresbetween
tbe story and the shape conditions.
nel
1
in
the
left
prefrontalregion was robust acrosstasks inwhich participantshad totryto understand
content. The locusof Channel 1in
the
leftprefrontalregion approximate]y corresponds to
F7
in
theinter-national 1O!20 system. F7 overlaps theleftinferior
frontalgyrus and Brodmann's area
(BA)
47(Okamoto
et al,,
2004>.
BA
47
is
adjacent to,but
does
not overlap, Breca's area<BA
44 and 45}. The results ofExperiment
2B
suggest that activation ofBreca's
area, shown as ChanneLs 4 and 5 in the lcft
hemi-sphere
(identified
by
]inearinterpolation,based onOkamoto
et al.(2004)),
wasdecreased
by
artjculatory suppression. Insuua the increase inOxy-Hb
concen-tratlonsinthe leftinieriorfrontalgyrus
(correspond-jng toF7 and BA 47)appears tobea reliab]e measure
to
evaluate whether participants actively triedto
understand the content, regardless of the type of
task,rnemory
load,
or the use ofinner
speech.
The
present resu]tsindicating
thatthetaskinvolv-ing comprehension activated the leftinferiorfrontal
region
{corresponding
to BA 44/45f47), whereas thetask with requiring articulatory suppression
acti-vated only the ventral region
(BA
47),are consistent withbrain
imaging
studies showing thatpbonologi-nA=,> × o"o98rp5toaoct AD= 1ptxo6y8v5eoavnf 6
5
4
3
2
1
o-1-2
6
5
4
3
2
1 o-1-2-6
-5
-4
-3
-2
-1
O
1
Non-report
(z-score
ofOxy-Hb)2
-6
-5
-4
-3
-2
-1
O
12
Scrembled
(z-score
of Oxy-Hb)Figure 9. Sca'tter plot of mean changes in
Oxy-Hb
during the comic presentation inExperiment 1. The upper panel shows the
relationship between the report and
report conditiens. The lower panel shows
the relationship
between
the report andscrambled conditions. Each circle indicatesa
participant; the
dashed
line
indicates equalNII-Electronic Library Service
N.
ENDo,
M
NAGAi,
andT.Kun{ADA:
Objective
Estimation
oiUnderstanding
by
NIRS 1540
330Eito.-20oy8wo 10ul40",eno
-10
-20
-10
O
1020
Shape
(z-score
ofOxy-Hb)
Figure10.
Scatter
plot of mean changesin
Oxy-Hb during card sorting inExperimcnts
2A and 2B. Each circle or square
indicates
aparticipant; the
dashed
line
indicates
equalbrain activation under
both
eonditions.the
phono]ogical system, A similar dissociationwasfound
in
sentence precessing,Dapretto
andBook-heimer
Cl999>
reported that BA 44 was activatedin
processing of syntactic information, whereas BA 47
was selectively
involved
in
processing of theseman-ticaspects of a sentence, Tlteseresults converged
in
that the
dorsal
part of inferiorfrontal gyrus(in
BA47)
is
involved
in
the processing of semanticinfor-mation, Thus, our result revealed that BA 47 was
also activated
by
semantic processing of non-verbalmaterials.
In the present study, we analyzed Hb
concentra-tionchanges
during
each o'fthesti,mulation and thetask periods with regard to hemodynarnic response
properties. Although we found more channels
ac-tivated
in
the condition requiring comprehensionduring the task period than during the stimulation
period, the specific brain activity in
Channel
1intheleft
prefrontal region was consistently evenin
eachanalysis, To confirm that NIRS activity in the left
inferior
frontal
gyrusis
a u$efui measure'to
evaluatewhether participants triedtounderstand, we
exam-ined mean Oxy-Hb concentrations inChannel
1
in
the
le'ft
hemisphere
for
individual
participantsbe-tween the task conditions
(Figures
9
and10).
Most
participants showed higher activation inthe
condt-tion
that
required actjve understanding than inthecontrol condition. In
fact,
if
the probe attachment to the sca!p isgood enough toobtain NIRS signals witha
high
signal-to-noise ratio,we maybe
ableto
obtainthe same
quality
ofdata
as seenin
Figures
9
and1O
using only one
trial.
If
significantbrain
activation isobserved only
in
a single trial,it
mightbe
possibletodevelop
our procecluretoan online evaluation basedon one trial's
data
and without requiring off-lineanalysis of participants'active understanding inthe
future.
A
greater variety of tasks,such as complex textcernprehension and proofreading, could extendthe
areas of application forthis
Qnline measure ofunderstanding.
For
example, the mea$ure maybe
useful todevelop instruction manuals thatare more readily understood.
References
Dapretto,
M.,
&
Bookheimer,
S.
Y,
(1999).
Form
andcontent:
dissociating
syntax and semanticsin
tence comprehension. IVkeuron,24,427-432.
Endo, N.,Saiki,
J.
Nakao, Y. & Saito,H.{2003).
ceptual
judgrnents
of novel contour shapes and
hierarchical
descriptions
of geometrical properties.
JtzPanese
LJburnal
of
Psychology,
74,346-353.
Hoshi,
Y.,
Kobayashi,N.
&
Tamura. M.(2001).
pretation of near-infrared spectroscepy signals: a
$tudy with a newly
developed
perfused ratbrain
model.
fburnal
of
APplied
UPiJJsiotogy,
90,
1662.
Matsuda,
G.
&
Hiraki,
K.
{2006).
Sustained
decrease
in
oxygenated hemoglobin during video games inthe dorsalprefrontalcortex: a NIRS study of
dren,
Nteuroimage,
29,
706-711.
Okamoto, M. Dan, H.
Sakamoto,
K,,Takeo,K.
mizu,
K.
Kohno,
S.,
Oda,
I,,
Isobe,
S.
Suzuki,
T,,
Kohyama,
K.
&
Dan,
I.
(2004).
Three-dimensional
probabilistic anatomical cranio-cerebral
tion via the international 10-20 system oriented
for transcranial function brain mapping.
image, 21,99-111.
Oldfield,
R.
C,
{1971),
The
assessment and analysis ofhandedness: the Edinburgh inventory.
chologia, 9,97-113.
Otsuka,
Y. Nakato, E. Kanazawa, S.,Yamaguchi, M
K.
Watanabe,
S.
&
Kakigi,R.{2e07),
Neuraltiontoupright and inverted facesininfants
ured by near infrared spectroscopy. IVeuroJmage,
34,
399-406,
16
The
japanese
Journa]
ofPsychonomic
Science
VoL
28,
No.
1
Peldrack,
R.
A.
Wagner,
A,
D.
PrulL
M.
W.
Desmond,
J.
E.
Glover,
G.
H,,&
Gabrieli,
J.
D.E.(1999).
tional specialization for$emantic and phonological
processing
in
theleft
inferior
prefrontal cortex.Neuroinzage,
10,
15-35.
Shimada, S. & Hiraki,K,
(2006).
Infants'brainsponse$ to livea"d Lelevised action. AIeuroimage,
32,
930-939.
Strangman,
G.
Culver,
J.
P. Thompson,J.
H,,
&
Boas,D.A.
(2002).
A quantitatjve comparison ofneous
BOI.D
fMRI
andNIRS
recordingsduring
functional brain activation. IVlauroimage,17,
731,Villringer,
A.,
&
Dirnagl,
U.
(1995).
Coupling
otbrain
activity and cerebral
blood
fiow:
basis
oftional neuroimaging. Cerebrovascular and Brain
Metabolism Reviews, 7,240-276.