Imaging intraorganellar Ca
2+dynamics
at subcellular resolution using
Imaging intraorganellar Ca
2+dynamics at subcellular resolution
using genetically encoded fluorescent Ca
2+indicators
Contents
Summary...3
Introduction...4
Materials and Methods...9
Results...20 Discussion...33 References...40 Acknowledgements...55 Figure Legends...56 Tables...74 Figures...77
Summary
The endoplasmic reticulum (ER) and mitochondria accumulate Ca2+ within their lumens to regulate numerous cell functions. However, determining the dynamics of intraorganellar Ca2+ has proven to be difficult. Here, I describe a family of genetically-encoded Ca2+ indicators, named calcium-measuring organelle-entrapped protein indicators (CEPIA), which can be utilized for intra-organellar Ca2+ imaging. CEPIA, which emit green, red or blue/green
fluorescence, are engineered to bind Ca2+ at intra-organellar Ca2+ concentrations. They can be targeted to different organelles and may be used alongside other fluorescent molecular
markers, expanding the range of cell functions that can be simultaneously analyzed. The spatiotemporal resolution of CEPIA makes it possible to resolve Ca2+ import into individual mitochondria while simultaneously measuring ER and cytosolic Ca2+. These imaging
capabilities were used to reveal differential Ca2+ handling in individual mitochondria. CEPIA imaging is a useful new tool to further the understanding of organellar functions.
Introduction
Ca2+ is an important second messenger that regulates numerous cellular functions including contraction, fertilization, proliferation and synaptic plasticity (1). The versatility of Ca2+ signals principally relies on the capacity of various types of cells to control spatiotemporal distribution of cytosolic Ca2+ levels to fit their physiology (2). In the resting state, Ca2+
concentration in the cytosol is kept below 100 nM, which is three to four orders of magnitude lower than that in the extracellular space or intracellular Ca2+ stores. In response to
Ca2+-mobilizing stimulation, the cytosolic Ca2+ concentration rises up to 1000 nM or higher and may fluctuate in a time dependent manner. Cytosolic Ca2+ signals are generated by two distinct pathways; Ca2+ influx from the extracellular space and Ca2+ release from the intracellular Ca2+ store, and there is a complex crosstalk between these two pathways. Furthermore, in response to cytosolic Ca2+ signaling, Ca2+ concentrations in the intracellular organelles such as mitochondria and nuclei also increase (3,4). To understand these complex signaling processes, optical Ca2+ imaging using Ca2+ indicators, which alter their spectral properties depending on their surrounding Ca2+ concentration, is a powerful and useful method. Indeed, optical Ca2+ imaging techniques have been successfully used to decipher spatiotemporal dynamics and physiological functions of cytosolic Ca2+ signals in cells in culture, in ex vivo samples and in living animals (5). In contrast to the success of cytosolic Ca2+ imaging techniques, there are several limitations in the existing methods available for
monitoring Ca2+ dynamics in the organelles such as the endoplasmic reticulum (ER) and mitochondria.
The ER and mitochondria are membrane-bound intracellular organelles in eukaryotic cells that carry out vital functions. Both ER and mitochondrial membranes display
Ca2+-transporting molecules whose function is to import Ca2+ into the lumen against the concentration gradient. This uphill Ca2+ transport is mediated in the ER membrane by sarco(endo)plasmic reticulum Ca2+ ATPase (SERCA) (6) and in the inner mitochondrial membrane by the mitochondrial Ca2+ uniporter (MCU) (3). The organellar membranes also feature molecules that allow Ca2+ to exit from the organelles to the cytosol: inositol
1,4,5-trisphosphate receptor (IP3R) and ryanodine receptor (RyR) in the ER, and the Na+/Ca2+
and H+/Ca2+ exchanger in mitochondria (3,7). Thus, the intraluminal Ca2+ concentration in the organelles is tightly regulated, and may exceed that of cytosol by a large factor. Ca2+ levels within the ER profoundly affect organelle functions, and overload or depletion causes ER stress (8). Within the mitochondrial matrix, Ca2+ concentration regulates the rate of ATP production, and abnormal concentrations can lead to cell death or autophagic degradation of the mitochondria (3).
ER and mitochondrial structures are constantly being reorganized and close contacts form between the two types of organelles. These contact sites have recently been shown to be involved in diverse functions, including lipid biosynthesis, mitochondrial biogenesis and the transfer of Ca2+ (9-12). Both types of organelle are also involved in the regulation of cytosolic
Ca2+ concentration. Release of Ca2+ from the ER regulates contraction, fertilization, development, secretion, and synaptic plasticity (7). In addition, the ER luminal Ca2+
concentration regulates Ca2+ influx across the plasma membrane. Following a release of Ca2+ from the ER, stromal interaction molecule 1 (STIM1), which is present in the ER membrane, functions as a Ca2+ transducer; it signals to the plasma membrane to activate the
store-operated Ca2+ entry mechanism (SOCE) (13,14). SOCE is mediated by the molecular complex that includes Orai1, a Ca2+ channel on the plasma membrane, and is important for the activation of various cell functions, the best-studied example of which is the immune responses (13). In contrast to the active role of the ER in Ca2+ signaling, mitochondria have been considered to act as a passive Ca2+ buffer (3). However, recent results suggest that they may also have an active role as a source of Ca2+ in the regulation of cytosolic Ca2+
concentration (15).
Although the importance of the ER and mitochondria as Ca2+-handling organelles is unequivocal, the mechanism by which organellar Ca2+ concentrations regulate cellular processes remains elusive. New methods to dissect organellar Ca2+ dynamics are expected to facilitate such studies. While small molecular Ca2+ indicators cannot be precisely targeted to the organelles, limiting their use in living cells, genetically-encoded Ca2+ indicators (GECIs) can be targeted to organelles with the addition of appropriate tags (16). Making use of this capability, GFP-based GECIs (10,11,15,17-48) and aequorin (a Ca2+-sensitive photoprotein) (49) have been used to measure intraorganellar Ca2+ concentrations. FRET-type GFP-based
GECIs were first used to measure intraluminal Ca2+ concentration in the ER and were applied to different cell types (15,17,22,23,25-28,30-32,36,47,48). This type of indicators uses wide visible wavelength bands for excitation and emission, often limiting the simultaneous use of other fluorescent molecules (50,51). Subsequently, innovative modifications of the GFP molecule have yielded single-wavelength-excitation GECIs with various affinities to Ca2+ for ER and mitochondrial Ca2+ imaging (18-21,24,33-35,39,41,42,45,46). Aequorin emits dim light, and simultaneous measurement with brighter fluorescence signals is not possible with most fluorescence microscopes. Although there are a wide variety of indicators, simultaneous Ca2+ imaging of the ER and mitochondria has not been carried out, and improvement in the spatiotemporal resolution of organellar Ca2+ is expected to enhance our understanding of intraorganellar Ca2+ dynamics. For these reasons, and to study the functional interaction between the ER and mitochondria, a new type of GECIs with higher spatiotemporal resolution was required.
This study reports on the generation of new organellar Ca2+ indicators that allow simultaneous imaging of two subcellular compartments with high spatiotemporal resolution. They are optimized in terms of Ca2+ affinity and dynamic range for organellar Ca2+ imaging and come in color variants for simultaneous measurement of multiple signals when they are used in appropriate combinations. Using them, intraorganellar Ca2+ concentrations can be imaged at unprecedented spatiotemporal resolution. To illustrate the utility of the approach, I demonstrate high spatiotemporal resolution imaging of ER and mitochondrial Ca2+ dynamics
in living cells; I show the quantitative relationship between the ER Ca2+ concentration and the extent of STIM1 puncta formation in the regulation of SOCE; and I show that inhomogeneity in mitochondrial Ca2+ responses can be observed during apparently homogenous ER and cytosolic Ca2+ changes, which suggests that there is a mechanism to regulate the influx of Ca2+ into mitochondria. The new indicators described in this work will be valuable for further study of the roles of the ER and mitochondria, and of their functional interactions.
Materials and Methods
Gene construction
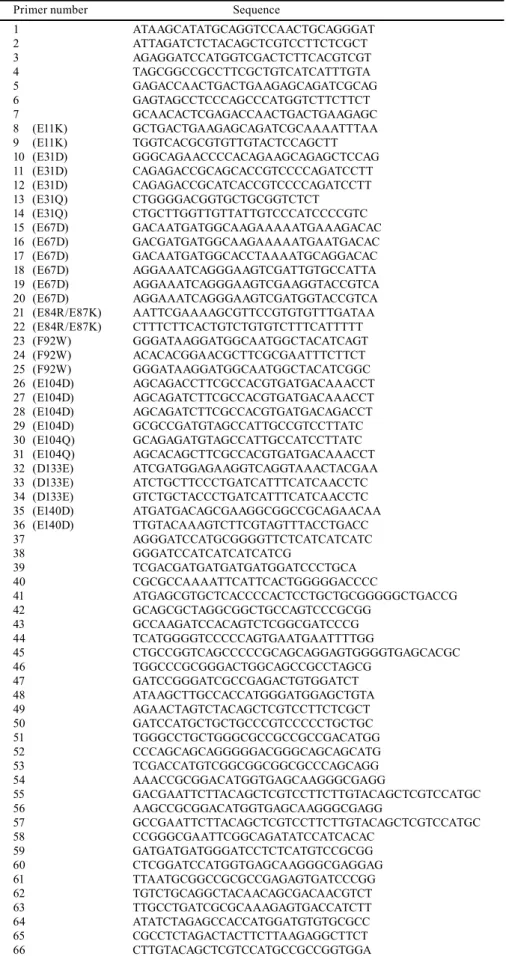
For creating a CEPIA library, cfGCaMP2 (GCaMP2 with amino acid substitutions of M36L in CaM, and N105Y and E124V in circular permutated enhanced GFP (cpEGFP)) with ER retention signal sequence (SEKDEL) was cloned into a bacterial expression vector, pET19b (Novagen, USA), using primers 1 and 2 (Table 3). G-GECO1.1, R-GECO1 and
GEM-GECO1 were also cloned into pET19b using primers 3 and 4. The CaM sequences in cfGCaMP2 variants were replaced with those in G-GECO1.1, R-GECO1 or GEM-GECO1 using primers 4–7. Site-directed mutagenesis was performed by PCR using primers 8–36.
For mammalian expression of CEPIA variants in the ER and mitochondria, CEPIA variants were cloned into pCMV/myc/ER and pCMV/myc/mito vector (Invitrogen, USA) using primers 3, 4 and 37–39. For mitochondrial Ca2+ imaging, the specificity of
mitochondrial localization was enhanced by attaching the mitochondria targeting sequences in tandem (29) to CEPIA2–4mt, R-GECO1mt and GEM-GECO1mt using primers 40–47. To enhance protein expression, GEM-CEPIA1er was cloned into the CAG promoter-containing vector, pCIS, using primers 48 and 49. To express G-CEPIA1er in the Purkinje cells,
G-CEPIA1er was cloned into pSinRep5 (Invitrogen) using primers 50–53. To localize EGFP and mCherry in the ER, EGFP and mCherry were cloned into the pcDNA3 D1ER (23) to attach calreticulin signal sequence and ER retention signal (KDEL) using primers 54–59. To
construct EYFP-er, EYFP was cloned from pcDNA3-YC4er (17) into pCMV/myc/ER vector using primers 60 and 61. To construct SypHer-dmito, an amino acid substitution of C199S (52) was added in pHyper-dmito (Evrogen, Russia) using primers 62 and 63. To construct mCherry-STIM1, STIM1 was cloned from pApuro-GFP-STIM1 (53) into pShuttle2 vector using primers 60 and 64–66.
Bacterial expression and in vitro spectroscopy
BL21-CodonPlus(DE3)-RIL bacteria (Stratagene, USA) was transformed with the plasmids and incubated for 16–36 h at 37°C in 2×YT medium containing ampicillin and
chloramphenicol (20 μg ml–1). The cells were resuspended in KCl/MOPS buffer (130 mM KCl, 50 mM MOPS, pH 7.2). After cell lysis with sonication, recombinant proteins were purified using TALON metal affinity resin (Clontech, USA) and dialyzed with Slide-A-Lyzer Dialysis Cassettes, 10K MWCO (Thermo Fisher Scientific, USA).
Ca2+ and Mg2+ titration curves of CEPIA variants were obtained by adding small aliquots of CaCl2 or MgCl2 to the recombinant indicators in a KCl/MOPS buffer containing 0
or 1 mM EGTA at pH 7.2. The Ca2+ concentration carried over from the recombinant protein samples was estimated as 2 µM. In the presence of 1 mM EGTA, the [Ca2+]free at pH 7.2 was
calculated as follows:
[Ca2+]free = [D + (4 × Kd × [Ca2+]total + D2)1/2] / 2, D = [Ca2+]total – [EGTA]total – Kd,
Kd = [EGTA]free × [Ca2+]free / [CaEGTA] = 150.5 nM,
where Kd is the dissociation constant of CaEGTA (54). To estimate properties of CEPIA
variants in mitochondria, titration experiments were performed in a KCl/HEPES buffer at pH 8.0 to mimic the mitochondrial environment (55), containing 1 mM BAPTA assuming a Kd of
0.1 µM. Fluorescence intensity was measured with a spectrofluorometer (FP-750, Jasco, Japan) for each protein at excitation/emission wavelength; 488/512 nm for cfGCaMP2 and G-GECO1.1 variants, 562/584 nm for R-GECO1 variants, and 395/460 nm and 395/510 nm for GEM-GECO1 variants. The obtained Ca2+-fluorescence intensity relationships were fitted by the following Hill equations using a least-square method in the Kaleidagraph software (Synergy Software, USA). For cfGCaMP2, G-GECO1.1 and R-GECO1 variants,
F = Fmin + (Fmax – Fmin) × ([Ca2+]free)n / [([Ca2+]free)n + (Kd)n].
For GEM-GECO1 variants,
R = Rmin + (Rmax – Rmin) × ([Ca2+]free)n / [([Ca2+]free)n + (Kd)n],
where R = (F at 460 nm) / (F at 510 nm). Kd represents an apparent dissociation constant, or
the Ca2+ concentration at which half of the indicator molecules bind to Ca2+. n represents Hill coefficient. The dynamic range of the indicator was calculated as the ratio of maximum and minimum fluorescence intensity or ratio (Fmax/Fmin or Rmax/Rmin). Fluorescence intensity at
various Ca2+ concentrations was standardized by the following equation:
The absorbance spectra were measured with a spectrophotometer (DU-640 UV/VIS, Beckman, USA). To determine the molar extinction coefficient (ε), absorbance spectrum was measured first for each protein in KCl/MOPS buffer with or without 5 mM CaCl2. The
extinction coefficient was calculated by dividing the peak absorbance by protein
concentration. The protein concentrations for G-CEPIA1er, GEM-CEPIA1er, G-GECO1.1 and GEM-GECO1 were calculated by measuring the absorbance following alkaline
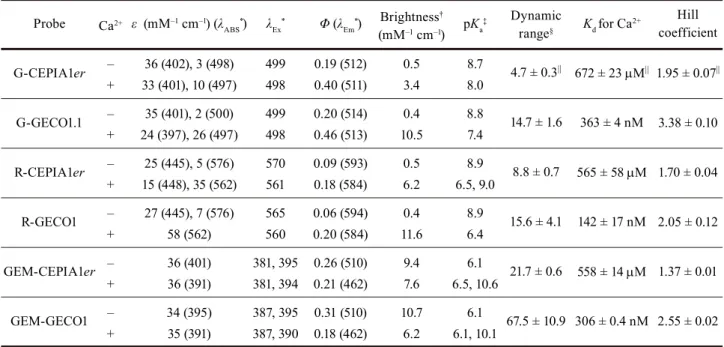
denaturation, assuming ε = 44,000 M–1 cm–1 at 446 nm. For R-CEPIA1er and R-GECO1, ε = 38,000 M–1 cm–1 at 455 nm (24). Quantum yields (Φ) of CEPIAer were calculated by using G-GECO1.1, R-GECO1 and GEM-GECO1 as standards (24).
Animal experiments
All animal experiments were carried out in accordance with the regulations and guidelines for Institutional Animal Care and Use Committee at the University of Tokyo and were approved by the institutional review committees of the Graduate School of Medicine, the University of Tokyo.
Cell culture
HeLa cells, HEK293A cells, BHK cells and astrocytes were cultured on collagen-coated dishes in DMEM supplemented with 10% fetal bovine serum, penicillin (100 U ml–1) and streptomycin (100 U ml–1). Jurkat T cells (E6-1) were maintained in RPMI medium (Gibco,
USA) supplemented with 10% fetal bovine serum. An astrocytic culture with >95% purity was prepared by several replatings of the brain cell culture which was obtained by 2.5% trypsin treatment and gentle trituration of the neocortices or the hippocampi of embryonic day 18–19 or postnatal day 1–3 Sprague–Dawley rat fetuses (56). For Ca2+ imaging, the cells were plated on collagen type-I-coated glass-bottom dishes (MatTek, USA) or Cell-Tak-coated dishes (Corning, USA) before imaging.
Time-lapse Ca2+ imaging
Cultured cells were transfected using Lipofectamine 2000 (Invitrogen) two or three days before imaging. Jurkat T cells were electroporated using a MicroPorator (MP-100, Digital Bio, Korea) one day before imaging. For cytosolic Ca2+ imaging using fura-2, cells were loaded with 5 μM fura-2 AM (Molecular Probes, USA) at room temperature (RT; 22–24°C) for 40–60 min in 0.1% BSA-supplemented physiological salt solution (PSS) containing (in mM) 150 NaCl, 4 KCl, 2 CaCl2, 1 MgCl2, 5.6 glucose, and 25 HEPES (pH 7.4). Prior to imaging,
the loading solution was replaced with PSS without BSA. The images were captured using an inverted microscope (IX81, Olympus, Japan) equipped with a 20× objective (numerical aperture (NA) = 0.75, UPlanSApo, Olympus) or a 40× objective (NA 0.90, UApo/340, Olympus), an electron multiplying cooled-coupled device (EM-CCD) camera (ImagEM, Hamamatsu photonics, Japan), a filter wheel (Lambda 10-3, Sutter Instrument, USA), a xenon lamp (ebx75) and a metal halide lamp (EL6000, Leica, Germany) at a rate of one frame per 2
or 3 s with the following excitation/emission filter settings: 472 ± 15 nm/520 ± 17.5 nm for CEPIA1er, G-CEPIA1er, CEPIA2–4mt, EYFP-er and G-GECO1.1, ; 562 ± 20 nm/641 ± 37.5 nm for R-CEPIA1er, R-GECO1 and mCherry-STIM1; 377 ± 25 nm/466 ± 20 nm and 377 ± 25 nm/520 ± 17.5 nm for GEM-CEPIA1er and GEM-GECO1; 340 ± 13 nm/510 ± 42 nm and 365 ± 6 nm/510 ± 42 nm for fura-2; 440 ± 10.5 nm/480 ± 15 nm and 440 ± 10.5 nm/535 ± 13 nm for D1ER (23,24). For analysis of the ratiometric indicators, the fluorescence ratio
(F466/F520 for GEM-GECO1 and GEM-CEPIA1er; F340/F365 for fura-2; F535/F480 for D1ER)
was calculated. Photobleaching was corrected for using a linear fit to the fluorescence
intensity change before agonist stimulation. All images were analyzed with ImageJ software. To image subcellular ER Ca2+ dynamics during agonist-induced Ca2+ wave formation, HeLa cells expressing either G-CEPIA1er or R-CEPIA1er were used. Images were captured at a rate of one frame per 30–100 ms using a 60× objective (NA 1.45, PlanApo TIRF,
Olympus) and the metal halide lamp or an LED lamp (pE-100, CoolLED, UK). To evaluate Ca2+ wave velocity in the ER and cytosol, images were normalized by the resting intensity, and a linear region of interest (ROI) was defined along the direction of wave propagation. A line-scan image was created by averaging 30 adjacent linear ROIs parallel to the original ROI, and time derivative was obtained to detect the time point which showed maximal change during the scan duration. Then the time points were plotted against the pixel, and the wave velocity was estimated by the slope of the least-squares regression line.
For mitochondrial Ca2+ imaging with ER and cytosolic Ca2+, mitochondrial inner membrane potential or mitochondrial pH at subcellular resolution, HeLa cells were imaged with a confocal microscope (TCS SP8, Leica) equipped with a 63× objective (NA 1.40, HC PL APO, Leica) at a rate of one frame per 2 or 3 s with the following excitation/emission spectra: R-GECO1mt (552 nm/560– nm), G-CEPIA1er (488 nm/500–550 nm) and
GEM-GECO1 (405 nm/500–550 nm); GEM-GECO1mt (405 nm/500–550 nm) and JC-1 (488 nm/500–550 nm and 488 nm/560– nm); R-GECO1mt (552 nm/560– nm) and SypHer-dmito (405 nm/500–550 nm and 488 nm/500–550 nm). For analysis of JC-1 and SypHer-dmito, the fluorescence ratio (488 nm/560– nm over 488 nm/500–550 nm for JC-1 (57); 488
nm/500–550 nm over 405 nm/500–550 nm for SypHer-dmito (52)) was calculated.
To perform in situ Ca2+ titration of CEPIA, the plasma membrane of HeLa cells was permeabilized with 150 μM β-escin (Nacalai Tesque, Japan) in a solution containing (in mM) 140 KCl, 10 NaCl, 1 MgCl2 and 20 HEPES (pH 7.2). After 4 min treatment with β-escin,
various Ca2+ concentrations were applied in the presence of 3 μM ionomycin and 3 µM
thapsigargin, and estimated the maximum and minimum fluorescent intensity (Rmax and Rmin),
dynamic range (Rmax / Rmin), Kd and n.
For the estimation of [Ca2+]ER based on the ratiometric measurement using
GEM-CEPIA1er (Figures 7c, 7d, 12f and 16), [Ca2+]ER was obtained by the following
equation:
where R = (F at 466 nm)/(F at 510 nm), n = 1.37 and Kd = 558 μM.
To evaluate pH dynamics in the ER (Figures 9a–d), HeLa cells expressing EYFP-er were first stimulated with histamine. Subsequently the cells were stimulated in a PSS
(adjusted to pH 6.8) containing monensin (10 μM, Wako, Japan) and nigericin (10 μM, Wako). Then, the cells were alkalinized with a solution containing (in mM) 120 NaCl, 30 NH4Cl, 4
KCl, 2 CaCl2, 1 MgCl2, 5 HEPES and 5.6 Glucose (pH 7.4) (58).
Analysis of STIM1 dynamics
STIM1 dynamics were analyzed using the ImageJ software. To extract STIM1 puncta, the captured images were binarized after filtering (Gaussian Blur or Unsharp Mask). Then, particles greater than 2 pixels (corresponding to ~1.2 µm2) were counted using the “Analyze Particles” tool in the ImageJ. The counts were normalized by the maximum values (Npuncta)
and plotted against the ER Ca2+ levels (ERCa2+) ([Ca2+]ER for GEM-CEPIA1er and F/F0 for
G-CEPIA1er). Curve fitting was performed using the following Hill equation:
Npuncta = 1 – (ERCa2+)n / [(ERCa2+)n + (K1/2)n],
where K1/2 indicates the ER Ca2+ level at half maximal puncta formation and n represents Hill
Imaging of subcellular localization of CEPIA
All images were captured with a confocal microscope (TCS SP8) equipped with a 63× objective at the following excitation/emission wavelengths: CEPIA1er, G-CEPIA1er, CEPIA2mt, EGFP-er and EYFP-er (488 nm/500–550 nm), R-CEPIA1er, mCherry-er and MitoTracker Red (Invitrogen) (552 nm/560– nm) and GEM-CEPIA1er (405 nm/420–550 nm). The obtained images were merged with ImageJ software.
ER Ca2+ imaging in cerebellar slices
For Purkinje cell-specific expression of G-CEPIA1er, a Sindbis virus vector (pSinRep5) encoding G-CEPIA1er was produced. The pSinRep5-G-CEPIA1er vector was then used as the template for in vitro transcription using SP6 RNA polymerase (Ambion, USA). The RNA transcript and the helper RNA from DH(26S) cDNA template (Invitrogen) were cotransfected into BHK cells by electroporation. Twenty-four hours after transfection, the culture medium containing the infectious particles was harvested. Sindbis virus vector encoding EYFP-er was also produced with the same procedure. C57BL/6 mice (postnatal day 21–27) were deeply anesthetizedwith pentobarbital, and the surface of cerebellar lobule 6 beside the midline was exposed by removing the cranium and dura. The tip of a glass pipette was backfilled with the viral solution. The glass pipette was then insertedinto the cerebellum and 1 µL of viral
solution was delivered at a rate of 200 nl min–1 using a micropump (Legato 130, KD scientific, USA). Twenty-four hours after virus injection, parasagittal cerebellar slices (250 µm
thickness) were prepared (60). Mice were anesthetized with diethyl ether and decapitated. The brain was removed and placed in ice-cold artificial cerebrospinal fluid (ACSF). Slices were cut using a microslicer (PRO 7, Dosaka EM, Japan). The slices were incubated in a holding chamber containing ACSF at 35°C for 1 h and then returned to 23°C. Slices were transferred to a recording chamber under microscope and continuously perfused with ACSF
supplemented with 10 µM bicuculline (Tocris Bioscience, UK) and 10 µM NBQX (Tocris Bioscience) to block inhibitory postsynaptic potentials and accompanying Ca2+ influxes. ACSF contained (in mM) 125 NaCl, 2.5 KCl, 2 CaCl2, 1 MgSO4, 1.25 NaH2PO4, 26 NaHCO3,
and 20 glucose, and was bubbled with 95% O2 and 5% CO2.
Imaging was carried out with a two-photon microscope (TSC MP5, Leica) equipped with a water-immersion objective (25, NA 0.95, HCS IR APO, Leica) and a Ti:sapphire laser (MaiTai DeepSee; Spectra Physics, USA). Excitation wavelength was 900–920 nm for both G-CEPIA1er and EYFP-er. Data were acquired with time-lapse XY-scan mode (8 Hz) and analyzed using ImageJ software. Fluorescence intensities were corrected for background fluorescence by measuring a non-fluorescent area. When necessary, photobleaching was corrected for using a linear fit to the fluorescence intensity change. For the focal stimulation of parallel fibers, square pulses (0.1 ms) were applied through stimulation pipettes (3–6 µm tip diameter) filled with ACSF. The stimulation intensity was adjusted within 4–5 V to induce G-CEPIA1er signals with a range of ~20 µm in diameter. For EYFP-er, the stimulation intensity was fixed at 5V. Experiments were carried out at RT.
Statistics
Two-tailed Student’s t-tests were performed to determine the significance if not stated otherwise.
Results
Development of ER Ca2+ indicator
I began measuring ER Ca2+ dynamics based on a lead variant of GCaMP2 (cfGCaMP2, see Materials and Methods), whereby fluorescence intensity increased 5.1-fold upon binding of Ca2+ with an apparent dissociation constant (Kd) of 0.67 µM (Table 1a). Since ER Ca2+
concentration ([Ca2+]ER) is assumed to reach the sub-millimolar range, cfGCaMP2 was
engineered to reduce its Ca2+ binding affinity by a factor of ~1,000. I searched for low Ca2+ affinity variants guided by extensive structure-function analyses based on site-directed mutagenesis in the calmodulin (CaM) domain of cfGCaMP2.
Ca2+ affinity of cfGCaMP2 is primarily determined by CaM, which has four EF-hand motifs. I first tried the amino acid substitutions that were used to reduce Ca2+ affinity of the FRET-type ER Ca2+ indicator, D1ER (23), but the Kd of cfGCaMP2 increased only to 14.5
µM (Figure 1a, gray circle). Amino acid substitutions at –Z position (12th amino acid residue) of the EF-hand motifs were previously shown to reduce the Ca2+ affinity of GFP-based Ca2+ indicators (15,17). When a non-acidic substitution (E31Q) at –Z in site I was introduced to cfGCaMP2, the Kd increased to 64.9 µM. However, its dynamic range (Fmax/Fmin) was
reduced to 2.5 (Figure 1a, green circle). Another non-acidic substitution (E104Q) at –Z in site III produced no effect on the Ca2+ affinity (Figure 1a, light green circle). On the other hand, conservative E31D substitution in site I increased the Kd to 14.5 µM without reducing the
dynamic range. Therefore, I next systematically altered the glutamate residue at –Z positions (E31, E67, E104, and E140) to aspartate. The E67D variant had a Kd of 9.2 µM, while E104D
and E140D variants had Kds of 1.0 and 2.1 µM, respectively (Figure 1a, cyan circles). I then
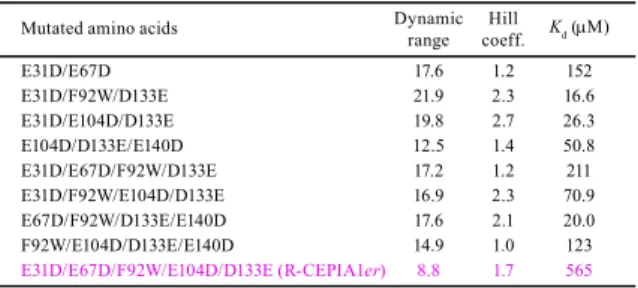
examined if combinations of multiple –Z substitutions would synergistically reduce the Ca2+ affinity. The Kd of E31D/E67D variant was strikingly increased to 470 µM, but its dynamic
range was reduced to 2.6. Variants with other combinations of double substitutions had a Kd
of ~25 µM, and retained a high dynamic range. Combinations of three –Z substitutions, (E31D or E67D)/E104D/E140D, produced variants with a Kd of some 130 µM (Figure 1a,
blue circles). Thus I concluded that a different strategy for further improvement of the indicator was required.
Previous reports have shown that a combination of F92W/D133E substitutions can inhibit Ca2+ binding at site IV of CaM (61,62). Based on these reports, I found that a
cfGCaMP2 variant with F92W/D133E substitutions had a Kd of 10.3 µM and a high dynamic
range (Figure 1a, orange circles). I next examined whether combinations of F92W/D133E and –Z substitutions would synergistically reduce Ca2+
affinity. Indeed, combinations of F92W/D133E and one of the –Z substitutions generated variants with a Kd of 67–130 µM
(Figure 1a, magenta circles). I further combined the F92W/D133E substitutions with double –Z substitutions, (E31D or E67D) plus (E104D or E140D), and obtained variants with a Kd of
~400 µM (Figure 1a, magenta circles). From among the 58 variants that were generated in this search, I finally selected one with E31D/F92W/E104D/D133E substitutions that had a
low Ca2+ affinity (Kd = 368 μM) and a large dynamic range (Fmax/Fmin = 4.2) (Table 1, Figures
1a and 1b). After attaching ER localization and retention signal sequences (Figure 1c), the low Ca2+ affinity variant was expressed in HeLa cells. The engineered indicator protein
co-localized with an ER marker (63) (Figure 1d). Upon addition of thapsigargin, an inhibitor of SERCA, a large reduction in fluorescence intensity was noted (Figure 1e). Also, oscillatory fluorescence intensity was observed in response to histamine, which generates cytosolic Ca2+ oscillations due to release of Ca2+ from the ER via IP3Rs (Figure 1f). Thus, the indicator
successfully reports [Ca2+]ER dynamics. I designated it Calcium-measuring
organelle-Entrapped Protein IndicAtor 1 in the ER (CEPIA1er).
Multi-coloring of CEPIA
I next generated color variants of CEPIA, based on recently developed cytosolic Ca2+ indicators: R-GECO1 (red fluorescence), G-GECO1.1 (green fluorescence) and
GEM-GECO1 (ratiometric blue/green fluorescence) (24). I first replaced the entire CaM domain of R-GECO1 with that of CEPIA1er, and obtained a variant with a Kd of 70.9 µM
(Table 1b). Introduction of an additional –Z substitution (E67D) resulted in a variant with an optimal Ca2+ affinity (Kd = 565 μM) and a high dynamic range (8.8) (Table 1b and Figure 2a),
which I designated R-CEPIA1er. Using the same strategy, I replaced the CaM domain of G-GECO1.1 with that of CEPIA1er, and obtained a variant with a Kd of 672 µM and a
next tried the same strategy in GEM-GECO1, but found that the dynamic range of the resulting indicator was markedly reduced (Rmax/Rmin = 1.1; Table 1d). Because several amino
acid substitutions had been introduced to the CaM of GEM-GECO1 as compared with cfGCaMP2 (Figure 3), I concluded that these additional substitutions are essential.
Accordingly, I created a variant where I reintroduced the GEM-GECO1 substitutions while maintaining the E31D/F92W/E104D/D133E substitutions, creating a variant with a low Ca2+ affinity and an increased dynamic range (Kd = 225 μM, Rmax/Rmin = 8.1; Table 1e). I further
engineered the –Z positions, thus creating a variant with E31D/F92W/D133E/E140D
substitutions with an optimal Ca2+ affinity and a high dynamic range (Kd = 558 μM, Rmax/Rmin
= 21.7; Table 1e and Figure 2a). I designated this variant GEM-CEPIA1er. Substituted amino acids in each CEPIAer and genealogy of CEPIA variants were summarized in Figures 3 and 4, respectively. Spectral properties and in vitro characteristics of CEPIAer, compared with those of original GECO, were summarized in Table 2, Figures 5 and 6.
I expressed the color variants of CEPIA fused with ER-targeting signal sequences in HeLa cells. They localized to the ER (63,64) (Figures 2b–d), and detected ER Ca2+ signals including agonist-induced Ca2+ oscillation with a high signal-to-noise ratio (Figures 7a and 7b). In HeLa cells, G-CEPIA1er showed superior performance in signal amplitude over CEPIA1er (Figures 7a and 7b). To measure the Ca2+ affinity of CEPIA variants within the ER, I carried out Ca2+ titration experiments in permeabilized HeLa cells. Stepwise changes in Ca2+ concentration elicited dose-dependent fluorescence intensity changes in the presence of
ionomycin to make the ER membrane permeable to Ca2+ (Figure 8a). The Kd values
determined within the ER were almost equivalent to those measured in vitro (Figure 8b). To examine whether pH changes had any effect on the signal of CEPIA indicators (Figure 6a), I monitored pH dynamics in the ER using a pH sensor, enhanced yellow fluorescent protein (EYFP, pKa = 6.9) (65,66), because the pH value in the ER is estimated as 7.2 (55). There was
no significant change in the fluorescence intensity of ER-localized EYFP (Figures 9a–d), verifying that the CEPIA responses are not due to pH changes in the ER. Thus, I succeeded in expanding the hues of CEPIA variants.
Estimation of [Ca2+]ER
Using ratiometric measurement with GEM-CEPIA1er, I estimated [Ca2+]ER in intact resting
cells as varying between 620 and 860 µM in HeLa cells, HEK293A cells, BHK cells and cultured astrocytes; these decreased to 310–570 µM upon stimulation with agonists (Figure 7d). The range of [Ca2+]ER underlines the need to increase the indicator’s Kd to >100 µM to
provide faithful measurements of ER Ca2+ dynamics, and explains the difficulty in imaging ER Ca2+ dynamics using D1ER, which has a Kd of ~60 µM (23) (Figures 2a, 7a and 7b).
Although CEPIA indicators had relatively high Hill coefficients (n = 1.4–2.0, Table 2), the relationship between F/Fmax (or R/Rmax) and changes in [Ca2+] is not highly distorted within the physiological [Ca2+]ER range (Figure 6c).
Subcellular ER Ca2+ dynamics visualized with CEPIA
I next examined whether CEPIA indicators are capable of detecting ER Ca2+ dynamics at subcellular resolution. Agonists often induce Ca2+ waves, which propagate throughout the cell after initiation in focal regions (1,67). The wave is generated by the regenerative release of Ca2+ from the ER, and it has been predicted that this mechanism creates an “inverse Ca2+ wave” within the ER. However, this prediction has not been tested using GECIs in live cells. I used G-CEPIA1er imaging at a high frame rate (10–30 frames s–1) to visualize inverse Ca2+ waves in the ER. Local decreases in [Ca2+]ER were observed, initiating at the tips and
propagating to the perinuclear region in HeLa cells (Figure 10a). The time courses measured at two subcellular locations indicated a wave-like propagation of decreasing [Ca2+]ER (Figures
10b and 10c). The speed of these waves was 60.8 ± 3.2 μm s–1 (mean ± s.e.m.), which matches cytosolic Ca2+ waves with or without CEPIA expression (Figure 10d). Similar observations were made with R-CEPIA1er (Figure 10d). Thus, CEPIA indicators have high spatiotemporal resolution.
Next, it was examined whether CEPIA can be applied to intact tissue preparations. To do so, Ca2+ dynamics were elucidated in the neuronal ER in response to synaptic inputs to Purkinje cell dendrites in cerebellar slice preparations. G-CEPIA1er was expressed in
Purkinje cells by Sindbis virus and was imaged with a two-photon microscope. G-CEPIA1er expression was observed throughout the dendrites and into spines, matching the distribution of the ER in Purkinje cells (Figure 11a). In response to parallel fiber (PF) stimulation, which
induces Ca2+ release from the ER through IP3R by activating the metabotropic glutamate
receptor 1 (mGluR1) (68), a long-lasting decrease in G-CEPIA1er fluorescence intensity was observed (Figure 11b). The ER Ca2+ dynamics could be visualized at the level of single spines (Figure 11c). This response was blocked by the application of LY367385, an mGluR1
antagonist (Figures 11d and 11e, blue), but not by the application of NBQX, an AMPA receptor antagonist (Figures 11d and 11e, magenta). The application of CPA, a SERCA inhibitor, induced slow depletion of ER Ca2+ (Figure 11f), followed by abolishment of the G-CEPIA1er response to PF stimulation (Figures 11d and 11e, orange). This response was not due to any pH change in the ER, because the PF stimulation had no effect on pH within the ER measured by ER-targeted EYFP (Figures 9e–g) (65,66). Thus, subcellular ER Ca2+
imaging using CEPIA is applicable to tissue preparations that have retained three-dimensional structure, which often requires two-photon excitation.
Simultaneous imaging of Ca2+ dynamics in the ER and cytosol
For simultaneous imaging of Ca2+ dynamics in the ER and cytosol, the ratiometric small-molecule Ca2+ indicator, fura-2 (excitation: 340–380 nm) was used together with G-CEPIA1er or R-CEPIA1er. ER Ca2+ signals were mirror images of the cytosolic Ca2+ oscillations (Figures 12a and 12b). Although G-CEPIA1er and R-CEPIA1er are weakly excited at the excitation wavelengths of fura-2 (Figures 5a and 13a), they had very little effect on the fura-2 fluorescence ratio (Figure 13b). Thus, it is possible to use G-CEPIA1er and
R-CEPIA1er with fura-2. Either G-CEPIA1er or GEM-CEPIA1er can be co-expressed with R-GECO1 for simultaneous imaging of the ER and cytosolic Ca2+ dynamics (Figures 12c–f). Reversal of the colors is also possible, and ER Ca2+ imaging using R-CEPIA1er can be simultaneously carried out with cytosolic Ca2+ imaging using G-GECO1.1 or GEM-GECO1 (Figures 12g and 12h). Spectral bleed-through was minimal (<3%, Figure 13a). These results show the versatility of CEPIA as ER Ca2+ indicators.
Imaging of store-operated Ca2+ entry
Store-operated Ca2+ entry (SOCE) is a ubiquitous process to replenish ER Ca2+ by inducing Ca2+ influx from the extracellular space (14), and has been shown to play an important role in the activation of immune cells (13). SOCE has been previously analyzed by measuring the increase in cytosolic Ca2+ concentration ([Ca2+]cyt) after store depletion by SERCA inhibitors,
such as thapsigargin and cyclopiazonic acid (CPA). However, it remains unclear whether SOCE induces an increase in [Ca2+]cyt under physiological conditions (69,70). Simultaneous
Ca2+ imaging in the ER and cytosol using G-CEPIA1er and fura-2, respectively, provides a direct means to analyze Ca2+ dynamics during SOCE.
I found that stimulation of HeLa cells with histamine in the absence of extracellular Ca2+ induced an increase in [Ca2+]cyt and concomitant partial depletion of [Ca2+]ER (Figure 14a,
black lines). Removal of histamine resulted in a shift of [Ca2+]cyt to [Ca2+]ER in the continued
add back”), a recovery of [Ca2+
]ER toward the pre-stimulation level was seen. During ER
refilling with Ca2+, the increase in [Ca2+]cyt was extremely small ([Ca2+]cyt = 4.8 ± 0.6 nM,
Figures 14b–d) as compared with the large [Ca2+]cyt increase (241 ± 14 nM) observed after
SERCA blockade by CPA or thapsigargin (Figures 14a and 14e). ER refilling was blocked by Gd3+, an Orai1 inhibitor (71) (Figure 14b, magenta lines). When STIM1 was extrinsically
expressed in HeLa cells, the [Ca2+]cyt and ER Ca2+ recovery rate during “Ca2+ add back” were
significantly elevated (Figures 15a and 15d). These results indicate that, in HeLa cells, Ca2+ influx via SOCE is rapidly taken up by SERCA without forming a high-amplitude cytosolic Ca2+ signal unless STIM1 is overexpressed. I next examined Jurkat T cells stimulated with T cell receptor activation. In these cells, although Ca2+ influx via SOCE is partly taken up by SERCA as shown by the increase in [Ca2+]ER, there was a significant increase in the
cytoplasmic Ca2+ concentration ([Ca2+]cyt = 539 ± 38 nM, Figure 14f). Thus, unlike in HeLa
cells, the rate of Ca2+ influx via SOCE surpasses the ER Ca2+ uptake rate in Jurkat T cells, and SOCE is capable of inducing an increase in [Ca2+]cyt.
CEPIA imaging simultaneous with other fluorescent molecules
Simultaneous time-lapse imaging of [Ca2+]ER and other cellular processes should provide
valuable information. I examined the possibility of simultaneously measuring [Ca2+]ER and
the subcellular distribution of STIM1, which senses the ER luminal Ca2+ concentration and, upon ER Ca2+ depletion, translocates to the subplasma membrane region to oligomerize (14).
Accumulating evidence suggests that the oligomerization of STIM1, which appears as a punctate structure of fluorescent protein-tagged STIM1, is a key determinant of SOCE (72).
I measured [Ca2+]ER using GEM-CEPIA1er and simultaneously imaged STIM1
dynamics using mCherry-STIM1 (Figures 16a and 16b). Upon addition of histamine in the absence of extracellular Ca2+, [Ca2+]ER began to decrease in an almost linear fashion. The
formation of STIM1 puncta was considerably delayed, being observed only after [Ca2+]ER fell
below 600 µM. Thereafter, puncta formation proceeded alongside further decreases in [Ca2+]ER. When Ca2+ was added back to the extracellular solution after histamine washout,
[Ca2+]ER refilling began and the mCherry-STIM1 puncta decomposed. The relationship
between [Ca2+]ER and puncta formation could be fitted by Hill plot, with a Hill coefficient of
7.9 and a K1/2 of 350 µM for puncta formation, and 9.7 and 530 µM for dissociation (Figure
16c). Thus, the relationship between [Ca2+]ER and puncta formation/dissociation exhibits
considerable hysteresis. The difference of K1/2 between puncta formation and dissociation was
also observed using G-CEPIA1er and mCherry-STIM1 (Figures 15a–c). These observations indicate that, as far as [Ca2+]ER-dependent puncta formation of STIM1 is concerned, there is a
threshold-like behavior, and suggest the existence of a mechanism that produces the delay in the dissociation of STIM1 puncta. Thus, CEPIA enables quantitative analysis of relationship between [Ca2+]ER and STIM1 dynamics.
Intercellular heterogeneity of mitochondrial Ca2+ signaling
I examined whether CEPIA indicators can be utilized for Ca2+ imaging in mitochondria.To cover the broad range of mitochondrial Ca2+ concentrations (0.05–300 µM) (22,28,73), three CEPIA variants with different Ca2+ affinities were selected from the library: CEPIA2 (Kd =
0.16 µM), CEPIA3 (11 µM), and CEPIA4 (59 µM) (Table 1a, Figures 6d and 17a). These indicators were expressed in HeLa cells by adding the mitochondrial localization signal sequence (29) (CEPIA2mt, CEPIA3mt and CEPIA4mt) to their coding sequences. The expression colocalized with MitoTracker Red and was distinct from the ER (Figure 17b).
Histamine application to mobilize ER Ca2+ induced a rapid increase in mitochondrial Ca2+ levels followed by a slow decay (Figures 17c and 17d). This mitochondrial Ca2+ signal was abolished when the mitochondrial membrane potential was dissipated by carbonyl cyanide-p-trifluoromethoxyphenylhydrazone (FCCP) (Figures 17c and 17d).
Only a subpopulation of cells showed a mitochondrial Ca2+ response, and the fraction of responding cells decreased with the decreasing affinities of the CEPIAmt (Figures 17e–g). Enhancement of mitochondrial Ca2+, either by extrinsic expression of MCU or by suppression of Na+/Ca2+ exchanger-mediated mitochondrial Ca2+ clearance by CGP-37157, resulted in a striking increase in the fraction of cells displaying Ca2+ signals. Under these conditions, sustained or oscillatory mitochondrial responses were observed in a large fraction of cells, and obvious saturation of CEPIAmt was observed in many cells (Figures 17e and 17g). I
mitochondrial Ca2+ dynamics during agonist stimulation have considerable cell-to-cell variation.
Subcellular heterogeneity of mitochondrial Ca2+ response
In a fraction of cells, agonist stimulation elicited a mitochondrial Ca2+ response throughout the cell. In the remaining cells, only a subpopulation of mitochondria responded with a Ca2+ increase. For example, in the cell shown in Figures 18a–c, mitochondrial Ca2+ concentration ([Ca2+]mt) measured with CEPIA3mt increased in region 2; the size of the increase was three
times greater than that averaged over the entire cell. In contrast, there was no increase in [Ca2+]mt in region 1. To exclude the possibility of regional variation in the CEPIA3mt
response, I applied a Ca2+ ionophore, ionomycin. The same response was observed in both regions 1 and 2. Subcellular heterogeneity in mitochondrial Ca2+ dynamics was also
visualized by CEPIA2mt (Figures 18d–f). These results indicate that there is a considerable subcellular variation in the capacity of mitochondria to take up Ca2+.
I tested a possible role for the ER in this inhomogeneous mitochondrial Ca2+
response, since it has been postulated that ER Ca2+ release is important for mitochondrial Ca2+ responses (9). To this end, simultaneous Ca2+ imaging of the cytosol, ER and mitochondria was performed using GEM-GECO1, G-CEPIA1er and R-GECO1mt, respectively. Agonist stimulation induced a marked increase in [Ca2+]mt in region 2 but not in adjacent mitochondria,
[Ca2+]ER and [Ca2+]cyt showed similar responses in regions 1 and 2 (Figure 19). I also
examined the subcellular heterogeneity in mitochondrial pH or membrane potentials (Ψm) as a
potential mechanism of heterogeneous mitochondrial Ca2+ responses (74-76). Simultaneous measurement of [Ca2+]mt and pHmt indicated that inhomogeneous Ca2+ responses are not due
to pH changes (Figures 20a–d). Neither did I find any heterogeneity in Ψm, corresponding to
mitochondrial Ca2+ responses (Figures 20e–f). These results suggest that the inhomogeneous mitochondrial Ca2+ response is generated by heterogeneity in the strength of
ER-mitochondrial coupling or in the regulation of Ca2+ uptake protein rather than in the amount of Ca2+ released from the local ER or in pH or Ψm.
Discussion
Ca2+ concentrations within the ER and mitochondria control cytosolic Ca2+ dynamics and regulate cell functions including ER stress and cell death (3,8). Methods such as CEPIA that obtain direct information about intraorganellar Ca2+ dynamics are, therefore, of great
importance. The merits of CEPIA indicators for imaging ER or mitochondrial Ca2+
concentrations can be summarized as follows. First, they have very high dynamic range and spatiotemporal resolution. This has allowed, for instance, the first imaging of an inverse Ca2+ wave and synaptic activity-dependent ER Ca2+ dynamics in neurons. Second, CEPIA allows simultaneous Ca2+ imaging in the ER, mitochondria and cytosol with subcellular resolution. Third, CEPIA indicators are applicable to many cell types including intact neurons. Fourth, ratiometric measurement is possible with GEM-CEPIA1er, whereby intraorganellar Ca2+ concentrations can be determined independent of the indicator’s expression level. Fifth, the high signal-to-noise ratio and one-wave length measurement with G-CEPIA1er and
R-CEPIA1er reduce the technical difficulty of organellar Ca2+ imaging and obviate the requirement for a special imaging apparatus. Thus, CEPIA-mediated imaging methods should have broad utility in many cell biological studies. Indeed, work described in this paper
addresses important cell functions. Furthermore, in a recent study CEPIA is successfully used to prove that abnormal ER Ca2+ handling is associated with disease-related mutations of the RyR (77).
Influx of Ca2+ from the extracellular space to the cytoplasm through SOCE is found in many types of cells (13,78). The inhibition of SERCA (an ER Ca2+ pump) by
pharmacological means, such as thapsigargin and CPA, to deplete ER Ca2+ has been the standard method to study the SOCE mechanism (13). Now, using CEPIA, I have studied SOCE under physiological conditions, without SERCA inhibition. This revealed that [Ca2+]cyt
is held constant during SOCE activation in HeLa cells, although [Ca2+]ER is sufficiently low to
induce significant [Ca2+]cyt increase when SERCA is inhibited. These results indicate that the
balance between the SOCE and SERCA activities is important for the capacity of SOCE to induce sustained increase in [Ca2+]cyt. In HeLa cells, SERCA activity is sufficiently high to
take up Ca2+ influx through SOCE. However, the balance can differ between cell types, and if it favors Ca2+ influx there may be a large increase in [Ca2+]cyt during SOCE activation. Indeed,
I found that the balance favors Ca2+ influx in Jurkat T cells, being consistent with the importance of SOCE in immune cells (13).
SOCE is a remarkable mechanism, in which [Ca2+]ER regulates the Ca2+
permeability in the plasma membrane. The ER Ca2+ transducer of SOCE is STIM1, which senses [Ca2+]ER and translocates to the subplasmalemmal ER domain to form punctate
structures and recruit Orai1 for Ca2+ influx through the plasma membrane. The steady-state [Ca2+]ER dependence of the amplitude of ionic current carried by SOCE (ICRAC) and the
subplasmalemmal translocation of STIM1 has been quantified (79). ICRAC and STIM1
and a K1/2 of ~200 µM. This is consistent with the dissociation constant of the Ca2+-binding
domain (EF-SAM) of STIM1 measured with a 45Ca2+ binding assay (Kd = ~250 μM) (80).
STIM1 deoligomerization for the termination of SOCE is thought to be mediated by ER Ca2+ refilling (14). Comparisons of the [Ca2+]ER dependence of STIM1 puncta formation and
dissociation have shown that the K1/2 of STIM1 puncta dissociation is lower than that of
formation (81,82). However, in these studies, STIM1 dynamics and [Ca2+]ER had to be
measured in separate cells, because both signals were measured using FRET between YFP and CFP. I found that extrinsic expression of STIM1 significantly increases both [Ca2+]cyt and
ER Ca2+ refilling rate during SOCE. Thus, the comparison between cells with and without STIM1 expression requires caution. To circumvent this problem, I simultaneously measured STIM1 puncta formation/dissociation and [Ca2+]ER in the same cells. Both STIM1 puncta
formation and dissociation were highly nonlinear functions of [Ca2+]ER. Furthermore, the K1/2
of [Ca2+]ER for puncta dissociation was greater than that for formation (530 and 350 µM for
dissociation and formation, respectively). These results indicate that the STIM1 deoligomerization process is not a simple reversal reaction of STIM1 oligomerization.
Within neurons the ER forms a continuous network throughout the cell (described as “a neuron within a neuron” (2,83)) that produces slowly-propagating regenerative Ca2+ signals using a conduction system based on IP3R and RyR. However, neuronal ER Ca2+
dynamics have previously been estimated only indirectly, by cytosolic Ca2+ imaging. In this study, G-CEPIA1er was successfully used to visualize Ca2+ dynamics in the neuronal ER, in
response to synaptic inputs to Purkinje cell dendrites in cerebellar slice preparations. Subsequent study using G-CEPIA1er indicated that Ca2+ diffusion within the ER (Ca2+ tunneling) is critical for the replenishment of ER Ca2+ after synaptic inputs in cerebellar Purkinje cells (84). Neuronal ER Ca2+ dynamics are important for physiological functions such as synaptic plasticity (83), but also for pathophysiological states including
neurodegenerative diseases (8,85). Thus, the application of CEPIA to intact neurons should provide a new imaging modality to analyze brain function.
Accumulating evidence suggests that Ca2+ dynamics in mitochondria are involved in the regulation of cell physiology and pathology, including autophagy, cell death, ATP synthesis, mitochondrial morphology and neurodegenerative diseases (3,12). Mitochondria constantly undergo fusion and fission for the maintenance of functions (86). Thus, subcellular inhomogeneity in mitochondrial functions is of great importance. Intracellular inhomogeneity in mitochondrial Ca2+ dynamics was first proposed based on mitochondria-targeted aequorin measurements (87), although these measurements did not have spatial resolution, and the inhomogeneity was inferred from the partial consumption of aequorin. Later,
mitochondria-targeted GECIs were used to image the subcellular mitochondrial Ca2+ response following agonist-induced ER Ca2+ release (21,22,26). These studies revealed that, after a rapid increase in [Ca2+]mt in response to agonist stimulation, there is a considerable variation
in the decay timecourse among the subpopulation of mitochondria within the cell, and a few minutes after the agonist stimulation only a minor subpopulation of mitochondria retained the
increase in [Ca2+]mt (21,22,26). The results obtained in this study showed that there is
considerable intercellular and intracellular inhomogeneity in mitochondrial Ca2+ responses after agonist-induced Ca2+ release from the ER through IP3Rs, despite the fact that consistent
cytosolic Ca2+ increases were observed. These results are consistent with the observation using a small molecular Ca2+ indicator (88). Furthermore, simultaneous Ca2+ imaging of the ER and mitochondria did not show any inhomogeneous ER Ca2+ release. The inhomogeneity of the restingΨm did also not correlate with the inhomogeneity of Ca2+ signal. These findings
indicate that mitochondrial Ca2+ responses involve more than simple, passive uptake of cytosolic Ca2+; there must be a regulatory mechanism for Ca2+ uptake. One possibility is that recently-identified MCU (3,89,90) and its associate proteins such as mitochondrial calcium uptake 1 (MICU1) (57), Mitochondrial Calcium Uniporter Regulator 1 (MCUR1) (91), MCU regulatory subunit (MCUb) (92), and essential MCU regulator (EMRE) (93) as well as H+/Ca2+ exchanger, Na+/Ca2+ exchanger (3) are regulated in a subcellular region-specific manner. Another possibility is that ER-mitochondria tethering proteins such as mitofusin 2 (12) are inhomogeneously distributed allowing region-specific transfer of Ca2+ from the ER to mitochondria at the ER-mitochondrial junction (10,11). Further studies using CEPIA will provide clues to the mechanism coupling between the ER and mitochondria.
I created fifty-eight variants of cfGCaMP2 and studied how their fluorescence intensity related to Ca2+ levels. This work shed light on the structure-function relationship of CaM-based indicators. Previous studies have reported that highly conserved glutamate
residues at –Z position in each EF-hand motif are key determinants of the Ca2+ sensitivity of CaM-based Ca2+ indicators (15,17,94). Here I further established that the substitution of glutamate with a non-acidic amino acid (E31A or E31Q) reduces not only the Ca2+ binding affinity but also the dynamic range of the indicator. In contrast, conservative substitutions to aspartate reduced the Ca2+ binding affinity, while maintaining the dynamic range. In line with this observation, a previous report showed that charge-reversing substitutions (E31K or E67K) resulted in a reduction of the dynamic range of GCaMP (94). These results suggest that the acidic residue in –Z position is not only the key determinant of Ca2+ binding affinity, but is also important for the efficient conformational change upon Ca2+ binding (62). F92W and D133E substitutions that reduce Ca2+ binding affinity without affecting the dynamic range have been previously reported for proteins possessing CaM-dependent enzymatic activity (61). Combining these two types of substitutions synergistically reduced Ca2+ binding affinity, which led to the generation of CEPIA indicators. This strategy may be applicable for the generation of ER and mitochondrial Ca2+ indicators based on other CaM-based indicators.
Other groups also developed ER-targeted GECIs on the basis of GCaMP or GECO with amino acids substitutions different from CEPIA. ER-LAR-GECO1 was generated by combined strategies of random and site-directed mutagenesis on the CaM-M13 interaction sites in R-GECO1 (34). GCaMPer (10.19) was created by introducing multiple mutations in the Ca2+ binding sites of GCaMP3 (35). Both indicators are successfully used to detect ER Ca2+ signals similar with CEPIA. The amino acid substitutions used in these indicators may
have a potential to be used for further improvement of CEPIA by combined with mutations in CEPIA library.
In summary, CEPIA-based imaging will contribute to the understanding of intraorganellar dynamics of Ca2+, and thus to elucidation of the functions of the ER and mitochondria in a variety of cells.
References
1. Berridge, M.J., Lipp, P. & Bootman, M.D. The versatility and universality of calcium signalling. Nat. Rev. Mol. Cell Biol. 1, 11-21 (2000).
2. Berridge, M.J., Bootman, M.D. & Lipp, P. Calcium–a life and death signal. Nature 395, 645-648 (1998).
3. Rizzuto, R., De Stefani, D., Raffaello, A. & Mammucari, C. Mitochondria as sensors and regulators of calcium signalling. Nat. Rev. Mol. Cell Biol. 13, 566-578 (2012). 4. Alonso, M.T. & Garcia-Sancho, J. Nuclear Ca2+ signalling. Cell Calcium 49, 280-289
(2011).
5. Miyawaki, A. & Niino, Y. Molecular spies for bioimaging—fluorescent protein-based probes. Mol. Cell 58, 632-643 (2015).
6. Brini, M. & Carafoli, E. Calcium pumps in health and disease. Physiol. Rev. 89, 1341-1378 (2009).
7. Berridge, M.J., Bootman, M.D. & Roderick, H.L. Calcium signalling: dynamics, homeostasis and remodelling. Nat. Rev. Mol. Cell Biol. 4, 517-529 (2003). 8. Mekahli, D., Bultynck, G., Parys, J.B., De Smedt, H. & Missiaen, L.
Endoplasmic-reticulum calcium depletion and disease. Cold Spring Harb. Perspect.
9. Rowland, A.A. & Voeltz, G.K. Endoplasmic reticulum-mitochondria contacts: function of the junction. Nat. Rev. Mol. Cell Biol. 13, 607-625 (2012).
10. Csordas, G., Varnai, P., Golenar, T., Roy, S., Purkins, G., Schneider, T.G., Balla, T. & Hajnoczky, G. Imaging interorganelle contacts and local calcium dynamics at the ER-mitochondrial interface. Mol. Cell 39, 121-132 (2010).
11. Giacomello, M., Drago, I., Bortolozzi, M., Scorzeto, M., Gianelle, A., Pizzo, P. & Pozzan, T. Ca2+ hot spots on the mitochondrial surface are generated by Ca2+
mobilization from stores, but not by activation of store-operated Ca2+ channels. Mol.
Cell 38, 280-290 (2010).
12. de Brito, O.M. & Scorrano, L. Mitofusin 2 tethers endoplasmic reticulum to mitochondria. Nature 456, 605-610 (2008).
13. Hogan, P.G., Lewis, R.S. & Rao, A. Molecular basis of calcium signaling in lymphocytes: STIM and ORAI. Annu. Rev. Immunol. 28, 491-533 (2010). 14. Soboloff, J., Rothberg, B.S., Madesh, M. & Gill, D.L. STIM proteins: dynamic
calcium signal transducers. Nat. Rev. Mol. Cell Biol. 13, 549-565 (2012).
15. Ishii, K., Hirose, K. & Iino, M. Ca2+ shuttling between endoplasmic reticulum and mitochondria underlying Ca2+ oscillations. EMBO Rep. 7, 390-396 (2006).
16. Palmer, A.E., Qin, Y., Park, J.G. & McCombs, J.E. Design and application of genetically encoded biosensors. Trends Biotechnol. 29, 144-152 (2011).
17. Miyawaki, A., Llopis, J., Heim, R., McCaffery, J.M., Adams, J.A., Ikura, M. & Tsien, R.Y. Fluorescent indicators for Ca2+ based on green fluorescent proteins and
calmodulin. Nature 388, 882-887 (1997).
18. Tang, S., Wong, H.C., Wang, Z.M., Huang, Y., Zou, J., Zhuo, Y., Pennati, A., Gadda, G., Delbono, O. & Yang, J.J. Design and application of a class of sensors to monitor Ca2+ dynamics in high Ca2+ concentration cellular compartments. Proc. Natl. Acad.
Sci. USA 108, 16265-16270 (2011).
19. Rodriguez-Garcia, A., Rojo-Ruiz, J., Navas-Navarro, P., Aulestia, F.J., Gallego-Sandin, S., Garcia-Sancho, J. & Alonso, M.T. GAP, an aequorin-based fluorescent indicator for imaging Ca2+ in organelles. Proc. Natl. Acad. Sci. USA 111, 2584-2589 (2014). 20. Zou, J., Hofer, A.M., Lurtz, M.M., Gadda, G., Ellis, A.L., Chen, N., Huang, Y., Holder,
A., Ye, Y., Louis, C.F., Welshhans, K., Rehder, V. & Yang, J.J. Developing sensors for real-time measurement of high Ca2+ concentrations. Biochemistry 46, 12275-12288 (2007).
21. Nagai, T., Sawano, A., Park, E.S. & Miyawaki, A. Circularly permuted green fluorescent proteins engineered to sense Ca2+. Proc. Natl. Acad. Sci. USA 98, 3197-3202 (2001).
22. Palmer, A.E., Giacomello, M., Kortemme, T., Hires, S.A., Lev-Ram, V., Baker, D. & Tsien, R.Y. Ca2+ indicators based on computationally redesigned calmodulin-peptide pairs. Chem. Biol. 13, 521-530 (2006).
23. Palmer, A.E., Jin, C., Reed, J.C. & Tsien, R.Y. Bcl-2-mediated alterations in endoplasmic reticulum Ca2+ analyzed with an improved genetically encoded fluorescent sensor. Proc. Natl. Acad. Sci. USA 101, 17404-17409 (2004).
24. Zhao, Y., Araki, S., Wu, J., Teramoto, T., Chang, Y.F., Nakano, M., Abdelfattah, A.S., Fujiwara, M., Ishihara, T., Nagai, T. & Campbell, R.E. An expanded palette of genetically encoded Ca2+ indicators. Science 333, 1888-1891 (2011).
25. Rudolf, R., Magalhaes, P.J. & Pozzan, T. Direct in vivo monitoring of sarcoplasmic reticulum Ca2+ and cytosolic cAMP dynamics in mouse skeletal muscle. J. Cell Biol. 173, 187-193 (2006).
26. Filippin, L., Magalhaes, P.J., Di Benedetto, G., Colella, M. & Pozzan, T. Stable interactions between mitochondria and endoplasmic reticulum allow rapid accumulation of calcium in a subpopulation of mitochondria. J. Biol. Chem. 278, 39224-39234 (2003).
27. Griesbeck, O., Baird, G.S., Campbell, R.E., Zacharias, D.A. & Tsien, R.Y. Reducing the environmental sensitivity of yellow fluorescent protein. Mechanism and
applications. J. Biol. Chem. 276, 29188-29194 (2001).
28. Arnaudeau, S., Kelley, W.L., Walsh, J.V., Jr. & Demaurex, N. Mitochondria recycle Ca2+ to the endoplasmic reticulum and prevent the depletion of neighboring
29. Filippin, L., Abad, M.C., Gastaldello, S., Magalhaes, P.J., Sandona, D. & Pozzan, T. Improved strategies for the delivery of GFP-based Ca2+ sensors into the mitochondrial matrix. Cell Calcium 37, 129-136 (2005).
30. Osibow, K., Malli, R., Kostner, G.M. & Graier, W.F. A new type of non-Ca2+-buffering Apo(a)-based fluorescent indicator for intraluminal Ca2+ in the endoplasmic reticulum.
J. Biol. Chem. 281, 5017-5025 (2006).
31. Ravier, M.A., Daro, D., Roma, L.P., Jonas, J.C., Cheng-Xue, R., Schuit, F.C. & Gilon, P. Mechanisms of control of the free Ca2+ concentration in the endoplasmic reticulum of mouse pancreatic beta-cells: interplay with cell metabolism and [Ca2+]c and role of
SERCA2b and SERCA3. Diabetes 60, 2533-2545 (2011).
32. Ai, H.W., Henderson, J.N., Remington, S.J. & Campbell, R.E. Directed evolution of a monomeric, bright and photostable version of Clavularia cyan fluorescent protein: structural characterization and applications in fluorescence imaging. Biochem. J. 400, 531-540 (2006).
33. Haviland, S., Cleemann, L., Kettlewell, S., Smith, G.L. & Morad, M. Diversity of mitochondrial Ca2+ signaling in rat neonatal cardiomyocytes: evidence from a genetically directed Ca2+ probe, mitycam-E31Q. Cell Calcium 56, 133-146 (2014). 34. Wu, J., Prole, D.L., Shen, Y., Lin, Z., Gnanasekaran, A., Liu, Y., Chen, L., Zhou, H.,
genetically encoded Ca2+ indicators for use in mitochondria and endoplasmic reticulum. Biochem. J. 464, 13-22 (2014).
35. Henderson, M.J., Baldwin, H.A., Werley, C.A., Boccardo, S., Whitaker, L.R., Yan, X., Holt, G.T., Schreiter, E.R., Looger, L.L., Cohen, A.E., Kim, D.S. & Harvey, B.K. A Low Affinity GCaMP3 Variant (GCaMPer) for Imaging the Endoplasmic Reticulum Calcium Store. PloS one 10, e0139273 (2015).
36. Palmer, A.E. & Tsien, R.Y. Measuring calcium signaling using genetically targetable fluorescent indicators. Nat. Ptoroc. 1, 1057-1065 (2006).
37. Zampese, E., Fasolato, C., Kipanyula, M.J., Bortolozzi, M., Pozzan, T. & Pizzo, P. Presenilin 2 modulates endoplasmic reticulum (ER)-mitochondria interactions and Ca2+ cross-talk. Proc. Natl. Acad. Sci. USA 108, 2777-2782 (2011).
38. Waldeck-Weiermair, M., Alam, M.R., Khan, M.J., Deak, A.T., Vishnu, N., Karsten, F., Imamura, H., Graier, W.F. & Malli, R. Spatiotemporal correlations between cytosolic and mitochondrial Ca2+ signals using a novel red-shifted mitochondrial targeted cameleon. PloS one 7, e45917 (2012).
39. Iguchi, M., Kato, M., Nakai, J., Takeda, T., Matsumoto-Ida, M., Kita, T., Kimura, T. & Akao, M. Direct monitoring of mitochondrial calcium levels in cultured cardiac myocytes using a novel fluorescent indicator protein, GCaMP2-mt. Int. J. Cardiol. 158, 225-234 (2012).
40. Isshiki, M., Nishimoto, M., Mizuno, R. & Fujita, T. FRET-based sensor analysis reveals caveolae are spatially distinct Ca2+ stores in endothelial cells. Cell Calcium 54, 395-403 (2013).
41. Li, H., Wang, X., Zhang, N., Gottipati, M.K., Parpura, V. & Ding, S. Imaging of mitochondrial Ca2+ dynamics in astrocytes using cell-specific mitochondria-targeted GCaMP5G/6s: mitochondrial Ca2+ uptake and cytosolic Ca2+ availability via the endoplasmic reticulum store. Cell Calcium 56, 457-466 (2014).
42. Logan, C.V., Szabadkai, G., Sharpe, J.A., Parry, D.A., Torelli, S., Childs, A.M., Kriek, M., Phadke, R., Johnson, C.A., Roberts, N.Y., Bonthron, D.T., Pysden, K.A., Whyte, T., Munteanu, I., Foley, A.R., Wheway, G., Szymanska, K., Natarajan, S., Abdelhamed, Z.A., Morgan, J.E., Roper, H., Santen, G.W., Niks, E.H., van der Pol, W.L., Lindhout, D., Raffaello, A., De Stefani, D., den Dunnen, J.T., Sun, Y., Ginjaar, I., Sewry, C.A., Hurles, M., Rizzuto, R., Consortium, U.K., Duchen, M.R., Muntoni, F. & Sheridan, E. Loss-of-function mutations in MICU1 cause a brain and muscle disorder linked to primary alterations in mitochondrial calcium signaling. Nat. Genet. 46, 188-193 (2014).
43. Lynes, E.M., Raturi, A., Shenkman, M., Ortiz Sandoval, C., Yap, M.C., Wu, J., Janowicz, A., Myhill, N., Benson, M.D., Campbell, R.E., Berthiaume, L.G.,
Lederkremer, G.Z. & Simmen, T. Palmitoylation is the switch that assigns calnexin to quality control or ER Ca2+ signaling. J. Cell Sci. 126, 3893-3903 (2013).
44. Frieden, M., James, D., Castelbou, C., Danckaert, A., Martinou, J.C. & Demaurex, N. Ca2+ homeostasis during mitochondrial fragmentation and perinuclear clustering induced by hFis1. J. Biol. Chem. 279, 22704-22714 (2004).
45. Kettlewell, S., Cabrero, P., Nicklin, S.A., Dow, J.A., Davies, S. & Smith, G.L. Changes of intra-mitochondrial Ca2+ in adult ventricular cardiomyocytes examined using a novel fluorescent Ca2+ indicator targeted to mitochondria. J. Mol. Cell. Cardiol. 46, 891-901 (2009).
46. Chang, K.T., Niescier, R.F. & Min, K.T. Mitochondrial matrix Ca2+ as an intrinsic signal regulating mitochondrial motility in axons. Proc. Natl. Acad. Sci. USA 108, 15456-15461 (2011).
47. Waldeck-Weiermair, M., Bischof, H., Blass, S., Deak, A.T., Klec, C., Graier, T., Roller, C., Rost, R., Eroglu, E., Gottschalk, B., Hofmann, N.A., Graier, W.F. & Malli, R. Generation of Red-Shifted Cameleons for Imaging Ca2+ Dynamics of the Endoplasmic Reticulum. Sensors (Basel) 15, 13052-13068 (2015).
48. Tsai, F.C., Seki, A., Yang, H.W., Hayer, A., Carrasco, S., Malmersjo, S. & Meyer, T. A polarized Ca2+, diacylglycerol and STIM1 signalling system regulates directed cell migration. Nat. Cell Biol. 16, 133-144 (2014).
49. Bonora, M., Giorgi, C., Bononi, A., Marchi, S., Patergnani, S., Rimessi, A., Rizzuto, R. & Pinton, P. Subcellular calcium measurements in mammalian cells using jellyfish photoprotein aequorin-based probes. Nat. Ptoroc. 8, 2105-2118 (2013).
50. Carlson, H.J. & Campbell, R.E. Genetically encoded FRET-based biosensors for multiparameter fluorescence imaging. Curr. Opin. Biotechnol. 20, 19-27 (2009). 51. Wier, W.G., Rizzo, M.A., Raina, H. & Zacharia, J. A technique for simultaneous
measurement of Ca2+, FRET fluorescence and force in intact mouse small arteries. J.
Physiol. 586, 2437-2443 (2008).
52. Poburko, D., Santo-Domingo, J. & Demaurex, N. Dynamic regulation of the
mitochondrial proton gradient during cytosolic calcium elevations. J. Biol. Chem. 286, 11672-11684 (2011).
53. Baba, Y., Hayashi, K., Fujii, Y., Mizushima, A., Watarai, H., Wakamori, M., Numaga, T., Mori, Y., Iino, M., Hikida, M. & Kurosaki, T. Coupling of STIM1 to store-operated Ca2+ entry through its constitutive and inducible movement in the endoplasmic
reticulum. Proc. Natl. Acad. Sci. USA 103, 16704-16709 (2006).
54. Tsien, R. & Pozzan, T. Measurement of cytosolic free Ca2+ with quin2. Methods
Enzymol. 172, 230-262 (1989).
55. Casey, J.R., Grinstein, S. & Orlowski, J. Sensors and regulators of intracellular pH.
Nat. Rev. Mol. Cell Biol. 11, 50-61 (2010).
56. Kanemaru, K., Okubo, Y., Hirose, K. & Iino, M. Regulation of neurite growth by spontaneous Ca2+ oscillations in astrocytes. J. Neurosci. 27, 8957-8966 (2007).
57. Perocchi, F., Gohil, V.M., Girgis, H.S., Bao, X.R., McCombs, J.E., Palmer, A.E. & Mootha, V.K. MICU1 encodes a mitochondrial EF hand protein required for Ca2+ uptake. Nature 467, 291-296 (2010).
58. Kneen, M., Farinas, J., Li, Y. & Verkman, A.S. Green fluorescent protein as a noninvasive intracellular pH indicator. Biophys. J. 74, 1591-1599 (1998).
59. Brandman, O., Liou, J., Park, W.S. & Meyer, T. STIM2 is a feedback regulator that stabilizes basal cytosolic and endoplasmic reticulum Ca2+ levels. Cell 131, 1327-1339 (2007).
60. Edwards, F.A., Konnerth, A., Sakmann, B. & Takahashi, T. A thin slice preparation for patch clamp recordings from neurones of the mammalian central nervous system.
Pflugers Arch. 414, 600-612 (1989).
61. Wu, X. & Reid, R.E. Conservative D133E mutation of calmodulin site IV drastically alters calcium binding and phosphodiesterase regulation. Biochemistry 36, 3608-3616 (1997).
62. Yang, J.J., Gawthrop, A. & Ye, Y. Obtaining site-specific calcium-binding affinities of calmodulin. Protein Peptide Lett. 10, 331-345 (2003).
63. Alford, S.C., Ding, Y., Simmen, T. & Campbell, R.E. Dimerization-dependent green and yellow fluorescent proteins. ACS Synth. Biol. 1, 569-575 (2012).
64. Calloway, N., Vig, M., Kinet, J.P., Holowka, D. & Baird, B. Molecular clustering of STIM1 with Orai1/CRACM1 at the plasma membrane depends dynamically on