Copyright By
MIRZA HUMAUN KABIR RUBEL September 2015
Study on preparation of superconducting perovskite-type
bismuth oxides by hydrothermal reaction
APPROVED BY
SUPERVISING COMMITTEE:
Study on preparation of superconducting perovskite-type
bismuth oxides by hydrothermal reaction
By
MIRZA HUMAUN KABIR RUBEL
A DISSERTATION
Presented to the Faculty of the Graduate School of Engineering University of Yamanashi, Japan
In Partial Fulfillment of the Requirements For the Degree of
DOCTOR OF ENGINEERING
University of Yamanashi
September 2015
Dedication
Acknowledgements
It is a great pleasure to express acknowledge and sincere regards to Professor Nobuhiro Kumada, who warmly welcomed me as part of their research group. This work was largely achieved authors heartfelt gratitude to Professor N. Kumada for his able, co operative and very kind supervision, encouragement and dynamic guidance. I also feel that without kind cooperation of Professor N. Kumada, this treatise would not have come to current form. The author would like to express thanks and sincere gratitude to Professor Takahiro Takei and Dr Akira Miura for their experimental help and valuable advices during the research work.
I record heartfelt gratitude to Professor Isao Tanaka, Professor Satoshi Watauchi and Dr Masanori Nagao for their valuable advices and expert opinion on the present research. This work also involved several collaborations which were concluded by some of the reported results. I would therefore like to acknowledge my indebtedness to Professor Masaki Azuma, Professor Kiyoharu Tadanaga, Professor Yoshihiro Kuroiwa, Professor Chikako Moriyoshi, Dr Eisuke Magome and Dr Kengo Oka for providing experimental facilities and their precious advices and explanations on the research data.
I would like to express sincere gratitude to all the professors associated with Green Energy Program, professors and researchers at Center for Crystal Science and Technology and professors of the University of Yamanashi. Thanks and gratitude to all
students who studied in my group and in this research center since 2012 to till date for their help and assistance in many ways regarding the research work to personal dealings.
I would like to address many grateful thoughts to Prof. A. K. M. Azharul Islam, Prof. Md. Khalilur Rahman Khan and Prof. Abdur Razzaque Sarker for their amiability and friendly sharing of knowledge. I also really want to thank my friends, colleagues and wellwishers for their inspiration and cooperation. The author would like to express love and respect to his parents; and love and affection to his wife (Shadia Sharmin) for inspiration and accompany all along.
Finally, I would like to express gratitude with great pleasure to the “Special Doctoral Program For Green Energy Conversion Science and Technology” supported by the Ministry of Education, Culture, Sports, Science and Technology, under its project, for providing financial support.
Abstract
Study on preparation of superconducting perovskite-type
bismuth oxides by hydrothermal reaction
MIRZA HUMAUN KABIR RUBEL, PhD University of Yamanashi, 2015
Supervisor: Nobuhiro Kumada
Abstract
The perovskite structure, ABO3, and its derivative have received significant attention because the structure can accommodate various metals with a wide range of valence and ionic radii. This has increased the interest on the crystallographic aspects as well as physical properties of the perovskite structures. In this research, three new Bibased perovskite superconductors have been successfully synthesized by a hydrothermal route with advantages of relatively mild conditions, fast reaction time, simple synthesis procedure and easy handling.
In the first study, hydrothermal synthesis at 220 ºC produced a new superconductor with an Asiteordered double perovskite structure, (Na0.25K0.45)(Ba1.00)3(Bi1.00)4O12, with a maximum Tc of about 27 K. Electron diffraction and synchrotron Xray diffraction
(SXRD) revealed that this material is not commonly reported simple pervoskite, but actually it possesses an Asite ordered double pervoskitetype structure. The choice of starting materials especially their molar ratio, synthesis temperature, bismuth valence is the keys for the fabricating Bioxidebased double perovskite structures with superconducting properties.
In the second study, I describe the synthesis and characterization of a singlephase doubleperovskite material with improved superconductivity (Tc) by hydrothermal
reaction at 240 ⁰C. The structure of the material was mainly studied using powder neutron diffraction (NPD), synchrotron Xray diffraction and transmission electron microscopy (TEM). Rietveld refinement of the sample based on NPD and SXRD data confirms an Asite ordered singlephase (K1.00)(Ba1.00)3(Bi0.85Na0.15)4O12 double perovskitetype structure. This hydrothermally synthesized compound exhibited a large shielding volume fraction exceeding 100% with an onset of approximately 31.5 K. Its electrical resistivity dropped near to onset at ~28 K, and zero resistivity was confirmed below 13 K. The calculated band structure reveals metallicity of the compound. In addition, it is predicted that the flatness of conduction bands near the Fermi level (EF) bears an importance for the appearance of higher Tc as observed in the reported
perovskite Bioxide.
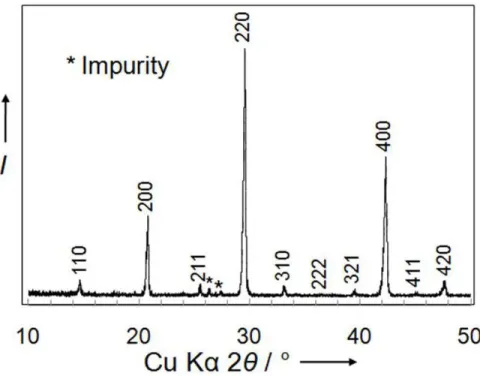
Finally, a new type of bismuthoxidebased superconductor was prepared by a hydrothermal reaction at 240 ºC. The synchrotron Xray powder diffraction pattern reveals a simple perovskitetype structure with a cubic cell of a = 4.28877(1) Å with space group Pm-3m. The chemical composition of this cubic perovskite oxide was
formulated as (Ba0.82K0.18)(Bi0.53Pb0.47)O3 after structural refinement using synchrotron Xray powder diffraction and chemical analysis data. The cubic microstructure and compositional homogeneity were confirmed by scanning electron microscopy analysis. This compound exhibited a diamagnetic signal with a shielding volume fraction of ~ 64% with an onset of approximately 22.8 K. Its resistivity started to drop at ~15 K, and zero resistivity was observed below 4 K. The thermal decomposition of this simple perovskite structure started above 600 ºC.
In summary, hydrothermal method proved its potentially by discovering new Bi based perovskite materials with new potential properties. Hydrothermal synthesis of new superconductors with higher Tc and improved properties remains as challenge for future
research.
Contents
List of Tables………Xii List of Figures……… Xiii Chapter 1 INTRODUCTION ... Page no.
1.1 General Introduction ...1
1.2 Perovskite structures ...12
1.3 Hydrothermal synthesis technique ...14
1.4 Chemical analysis technique ...16
1.5 Magnetic susceptibility ...18
1.6 High pressure experiments ...19
1.7 Resistivity and electronic transport ...21
1.8 Powder diffraction techniques ...22
1.9 Computational methods ...26
1.10 Research Goal ...28
1.11 Thesis plans ...29
REFERENCES ...31
Chapter 2 Superconducting Double perovskite Bimuth Oxide Prepared by a Low Temperature Hydrothermal Reaction 2.1 Introduction ...37
2.2 Experimental Section ...40
2.3 Results and discussion ...41
2.4 Conclusions ...61
REFERENCES ...62
Chapter 3 Hydrothermal synthesis, crystal structure and superconductivity of a singlephase double perovskite Bioxide 3.1 Introduction ...64
3.2 Experimental and computational details ...68
3.3.2 Effect of reaction temperatures on superconductivity ...82
3.3.3 Thermal behavior study ...87
3.3.4 Electronic band structure ...89
3.4 Conclusions ...93
REFERENCES ...95
Chapter 4 Hydrothermal synthesis of a new Bibased (Ba0.82K0.18)(Bi0.53Pb0.47)O3 superconductor 4.1 Introduction ...98
4.2 Experimental details...101
4.3 Results and discussion ...103
4.4 Conclusions ...120
REFERENCES ...122
Chapter 5 Summary and prospects ...125
List of Tables
Table 2-1: Synthesis condition, lattice parameters, average bismuth valence and superconductivity of samples prepared at various Ba/Bi molar ratio in the starting materials. 42 Table 2-2: Summary of Rietveld refinement parameters for synthesized product of Ba/Bi=1.00 molar ratio in the starting materials. 50
Table 2-3: Atomic coordinates and isotropic displacement parameters for double perovskite phase. 52 Table 3-1: Refined structural parameters and crystal datan based on NPD data for (K1.00)(Ba1.00)3(Bi0.85Na0.15)4O12 prepared by hydrothermal reaction at 240 ºC. Numbers in
the parenthesis are assumed standard deviations of the last significant digit. 74 Table 3-2: Refined structural parameters and crystal datas based on SXRD data for
(K1.00)(Ba1.00)3(Bi0.85Na0.15)4O12 prepared by hydrothermal reaction at 240 ºC. Numbers in
the parenthesis are assumed standard deviations of the last significant digit. 76 Table 3-3: Summary of synthesis conditions, Superconducting transition
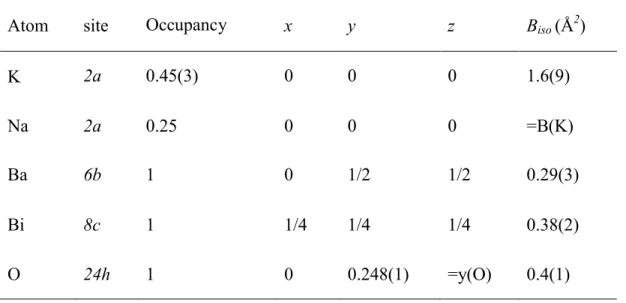
temperatures, Lattice parameter (a), Main bond lengths (Å) and selected angles (º) for hydrothermally synthesized double perovskite Bi oxides determined from NPD data at room temperature. 77 Table 4-1: Crystallographic site, occupancy ratio, atomic coordinates and the Debye– Waller temperature factor, Biso for the each elements of (Ba0.82K0.18)(Bi0.53Pb0.47)O3 obtained from the synchrotron Xray powder diffraction pattern shown in Figure 5. Numbers in the parentheses are assumed standard deviations of the last significant digit.
108 Table 4-2: Crystal data and refined parameters for cubic (Pm-3m)
(Ba0.82K0.18)(Bi0.53Pb0.47)O3 prepared by hydrothermal reaction at 240 ºC. Numbers in the
List of Figures
Figure 1.1: Experimental data obtained in mercury by Gilles Holst and H. Kamerlingh Onnes in 1911, showing for the first time the transition from the resistive state to the
superconducting state. 1
Figure 1.2: Temperature dependence of electrical resistivity of a superconductor. Tc
marks the transition to the superconducting state. 4 Figure 1.3:The Meissner effect: the expulsion of a weak, external magnetic field from the interior of a superconductor. The field is applied (a) at T>Tc, and (b) at T<Tc. 4 Figure 1.4: The time evolution of the superconducting critical temperature since the discovery of superconductivity in 1911. The solid line shows the Tc evolution of metallic
superconductors, and the dashed lines (blue and red) mark the Tc evolution of
superconducting oxides. 7
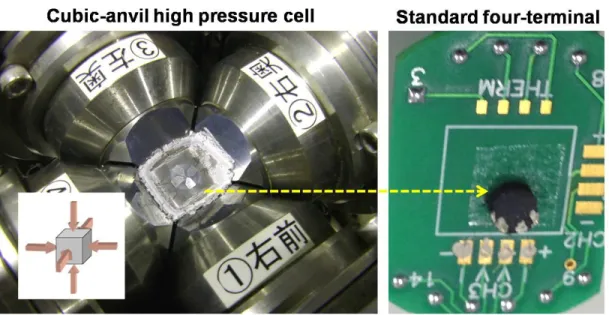
Figure 1.5:Perovskite distortion from (A) Cubic to (B) Orthorhombic. 13 Figure 1.6:Preparation of sample pellet using cubicanviltype high pressure cell. 20 Figure 1.7: Preparation of standard fourterminal by sample pellet after high pressure
experiment. 22 Figure 2.1:Crystal structure of A'A''3B4O12type perovskite. The spheres at the A' site are
for Na/K and for Ba atoms at the A'' site; they also indicate their respective positions. A network of cornersharing BiO6 octahedra is shown, with oxygen atoms are in the corner
of octahedra. 39
Figure 2.2: Xray powder diffraction pattern of double perovskite compound as synthesized by lowtemperature hydrothermal reaction at 220 ºC. 41 Figure 2.3: Temperaturedependence of DC magnetic susceptibility curves of superconducting samples prepared at different Ba/Bi molar ratios in an applied external field of 10 Oe in ZFC mode. The density of the sample was assumed (7.78 g/cm3) from Rietveld refinement data. The highest diamagnetic signal appears at ca. 27 K for a compound with a Ba/Bi molar ratio of 1.00, as shown in the inset. 43 Figure 2.4:Temperature dependence of DC magnetic susceptibility curve of Ba/Bi=1.00 molar ratio compound in an applied external field of 10 Oe in both ZFC and FC modes. The superconducting transition temperature Tcmag is ~27 K as indicated by an arrow. The
superconducting volume fraction corresponds to shielding effect is ~ 60%, indicating the
bulk superconducting nature. 44
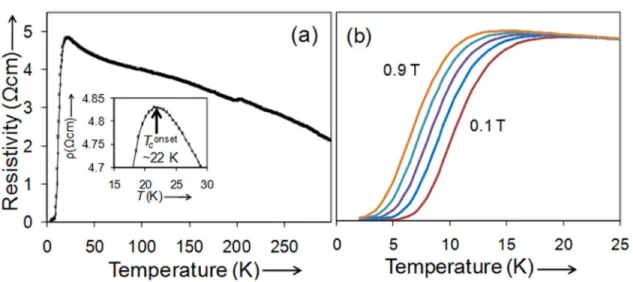
Figure 2.5: (a) Temperature dependence of electrical resistivity ρ(T) for the compound with a Ba/Bi molar ratio of 1.00; inset: the Tconset was estimated at ca. 22 K. (b)
Resistivity ρ(T) curves for the Ba/Bi=1.00 compound at applied fields (0.1 T–0.9 T) in
intervals of 0.2 T. 45
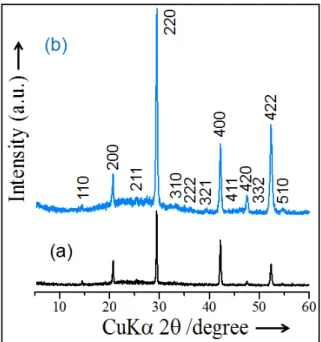
Figure 2.6: Laboratory Xray powder diffraction patterns of double perovskite (Ba/Bi = 1.00 molar ratio) compound for (a) as prepared and (b) high pressed (8 GPa) samples. The double perovskite structure together with super lattice peaks are indexed for the both samples. The amorphous halos in the XRD patterns are probably due to glass sample
holder during scanning. 46
Figure 2.7: Electron diffraction of double perovskite compound along [001] zone axis.
Arrow indicates indexed 110 reflection. 48
Figure 2.8:SXRD Rietveld refinement profile of hydrothermally synthesized product (λ = 0.41336 Å). Markers and lines indicate observed and calculated profiles, respectively. Upward and downward marks show positions of Bragg reflections for the double perovskite structure (Na0.25K0.45)(Ba1.00)3(Bi1.00)4O12, and the simple perovskite one (BaBiO3). Residual errors are drawn at the bottom of figure. Inset shows an expansion between 6.5º and 8.5 º, demonstrating the existence of a simple perovskite phase. 49 Figure 2.9: (a) TG curve of prepared sample in He flow and (b) corresponding signal intensity for H2O (red line) and O2 molecules (black line) obtained from mass
spectrometry. 53
Figure 2.10: FTIR spectrum of Ba/Bi = 1.00 molar ratio sample. 54 Figure 2.11: Synchrotron Xray powder diffraction patterns of sample at (a) room
temperature, (b) 200 °C, (c) 400 °C, and (d) 600 °C. 54 Figure 2.12: Temperature dependence of DC magnetic susceptibility, χ, for as prepared
sample and annealed at 400 °C and 600 °C. 56
Figure 2.13: Dependencies of Tcmag on average bismuth valence. (a) For our double
[9] (open circles). (b) For a simple perovskite compound [19] (triangles) and another simple perovskite, [23] where no oxygen deficiency was assumed (diamonds). 57 Figure 2.14: The calculated electronic band structure and atomprojected DOS for (a) (Na0.25K0.45)(Ba1.00)3(Bi1.00)4O12 double perovskite and (b) Ba0.6K0.4BiO3 simple
perovskite under ambient conditions. 59
Figure 2.15: The calculated partial density of states for (a) (Na0.25K0.45)(Ba1.00)3(Bi1.00)4O12 double perovskite (b) Ba0.6K0.4BiO3 simple perovskite
compounds at ambient conditions. 60
Figure 3.1: Crystal structure of (K1.00)(Ba1.00)3(Bi0.85Na0.15)4O12 double perovskite. The atoms at the A' site in the center and eight corners are fully occupied by K. Ba atoms are at A'' site. The Bi/Na atoms forms a network of cornersharing tilted (Bi/Na)O6
octahedra. 67
Figure 3.2: Xray powder diffraction pattern of singlephase double perovskite bismuth oxide synthesized at 240 ºC using Ba/Bi = 1.00 molar ratio prepared by hydrothermal reaction. Inset shows the presence of small amount of impurity for sample synthesized at
220 ºC. 71
Figure 3.3: Rietveld refinement profile for the neutron powder diffraction (λ = 1.6246 Å) data of (K1.00)(Ba1.00)3(Bi0.85Na0.15)4O12 cubic (Im-3m) double perovskite at room temperature. The markers and solid lines are for the experimental and calculated profiles, respectively. The short verticals indicate the positions of allowed Bragg reflections. Residual errors are plotted at the bottom of the figure. 73 Figure 3.4: Rietveld refinement profile for the synchrotron Xray powder diffraction (λ = 0.46365 Å) data of (K1.00)(Ba1.00)3(Bi0.85Na0.15)4O12 cubic (Im-3m) double perovskite at room temperature. The markers and solid lines are for the experimental and calculated profiles, respectively. The short verticals indicate the positions of allowed Bragg reflections. Residual errors are plotted at the bottom of the figure. 75 Figure 3.5: SEM images obtained from surfaces of hydrothermally samples at (a) 180 °C (b) 200 °C (c) 220 °C (d) 230 °C (e) 240 °C (f) 250 °C (g) 260 °C. 79 Figure 3.6: Elemental mappings of hydrothermally prepared (K1.00)(Ba1.00)3(Bi0.85Na0.15)O12 sample at 240 ºC. 79
Figure 3.7: Shows elemental homogeneity of Bi, Ba, K and Na elements in nanoscale region for the synthesized sample at 240 ºC by HAADFSTEM. 81 Figure 3.8: Typical TEM images of sample synthesized hydrothermally at 240 ºC using (a) bright field (BF) and (b) dark field (DF) resolutions; (c) electron diffraction patterns using BF imaging along [001] zone axis. Dark field imaging for (d) 200 diffraction and (e) 100 diffraction indicating structural homogeneity in nanoscale. 82 Figure 3.9: Temperaturedependence of DC magnetic susceptibility for the hydrothermally synthesized (K1.00)(Ba1.00)3(Bi0.85Na0.15)4O12 sample in an external field of 10 Oe in both ZFC and FC modes. The inset shows an expanded view of Tcmag at ~31.5
K. 83
Figure 3.10: Magnetic susceptibility curves for the samples prepared at various reaction temperatures from 180 ºC to 260 ºC in a magnetic field of 10 Oe in ZFC mode. The reaction temperature dependence of Tc and diamagnetic shielding volume fraction are
shown in the insets. 84
Figure 3.11: The characteristic change in electrical resistivity ρ(T) of (K1.00)(Ba1.00)(Bi0.85Na0.15)O12 pellet sample. The inset shows a Tconset ~28 K and a Tczero
~13 K in expanded scale. 85
Figure 3.12: The resistivity curves for the (K1.00)(Ba1.00)3(Bi0.85Na0.15)O12 sample under applied magnetic fields (0.11.9 T) intervals of 0.3 T. 86 Figure 3.13: TGcurves of the samples prepared hydrothermally at 240 ºC (black line) and 220 ºC (red line) representing relative mass loss in He gas flow. 88 Figure 3.14: DC magnetic susceptibility (χ) for the sample synthesized at 240 ºC heated at various temperatures from room to 700 ºC measured under an external field of 10 Oe in ZFC mode. The inset shows the enlarged view of the highest Tcmag ~31.5 K for the as
prepared sample. 89
Figure 3.15: The calculated band structure for (K1.00)(Ba1.00)(Bi0.85Na0.15)O12 double perovskite shows broad and nearly flat Bi/Na6s,6p/3s, and O2p bands from M to Γ points at EF . The total DOS is presented at right side of the figure. 90 Figure 3.16: The calculated partial DOS for (K1.00)(Ba1.00)3(Bi0.85Na0.15)O12 cubic
Figure 4.1: Crystal structure of undistorted (Ba0.82K0.18)(Bi0.53Pb0.47)O3 cubic perovskite. The atoms at the A site in the center are occupied by Ba/K. The Bi and Pb atoms at the B site form a network of cornersharing (Bi/Pb)O6 octahedra with oxygen atoms (red) in the
corner of the octahedra. 100
Figure 4.2: Xray powder diffraction pattern of (Ba0.82K0.18)(Bi0.53Pb0.47)O3 sample prepared hydrothermally at 240 °C. 104 Figure 4.3: SEM images of the hydrothermally synthesized (Ba0.82K0.18)(Bi0.53Pb0.47)O3 crystalline sample at (A) (X3000) magnification scale and (B) (X750) magnification
scale. 106
Figure 4.4: Elemental mappings of hydrothermally synthesized (Ba0.82K0.18)(Bi0.53Pb0.47)O3 sample. 107 Figure 4.5: Rietveld refinement profile based on SXRD data for (Ba0.82K0.18)(Bi0.53Pb0.47)O3 cubic (Pm-3m) perovskite at room temperature. The markers and solid lines are for the experimental and calculated profiles, respectively. The tick marks below the profile show the positions of allowed Bragg reflections. Residual errors
are plotted at the bottom of the figure. 109
Figure 4.6: Temperaturedependence of DC magnetic susceptibility for the hydrothermally synthesized (Ba0.82K0.18)(Bi0.53Pb0.47)O3 sample in an external field of 10 Oe in both ZFC and FC modes. The inset shows an enlarged view of the superconducting
transition (Tcmag) at ~22.8 K. 110
Figure 4.7: (A) Temperature dependence of electrical resistivity ρ(T) for (Ba0.82K0.18)(Bi0.53Pb0.47)O3 pellet sample. Tconset~ 15 K is shown in the inset. (B) The
resistivity ρ(250) K curves for the same sample under applied fields from 0.1 to 1.9 T in
intervals of 0.3 T. 112
Figure 4.8: TG curve of hydrothermally prepared (Ba0.82K0.18)(Bi0.53Pb0.47)O3 sample at
240 °C in a He gas flow. 113
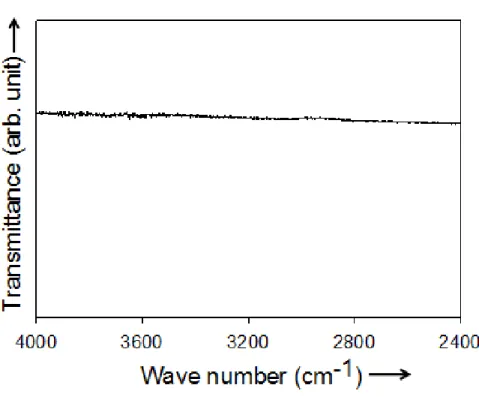
Figure 4.9: FTIR spectrum of (Ba0.82K0.18)(Bi0.53Pb0.47)O3. The Fouriertransform infrared (FTIR) spectrum was measured in the range of 40002500 cm1. No evidence of H2O and OH groups was observed in the spectrum. 114
Figure 4.10: SXRD patterns of the prepared sample heated at different temperatures from room temperature to 700 °C. The peaks of the (Ba0.82K0.18)(Bi0.53Pb0.47)O3 sample from room temperature to 600 °C are indexed as the cubic perovskite structure. The inset shows the expansion of the impurity peaks due to decomposition of the sample heated at
700 °C. 116
Figure 4.11: Temperaturedependence of DC magnetic susceptibility curves for the sample heated at various temperatures from room temperature to 800 °C measured in an external field of 10 Oe in ZFC mode. The inset shows the highest Tcmag of ~22.8 K for the
asprepared sample. 117
Figure 4.12: (A) The calculated band structure along high symmetry directions of the Brillouin zone in momentum space and atom projected DOS. 118 Figure 4.12: (B) The calculated partial density of states for (Ba0.82K0.18)(Bi0.53Pb0.47)O3 cubic (Pm-3m) simple perovskite at ambient conditions. 119
Chapter 1
Introduction
1.1 General Introduction
In order to “create” new superconductors, one must first understand the common features of existing ones and the trend in the development of new materials. In other words, in order to predict the future, one should know the past. Superconductivity, indeed, was a major scientific mystery for a large part of the last century: was discovered in 1911 by the Dutch physicist H. Kamerlingh Onnes and his assistant Gilles Holst in Leiden. They found that dc resistivity of mercury suddenly drops to zero below 4.2 K, as shown in Fig. 1.1. Gilles Holst actually made this measurement [1].
Figure 1.1. Experimental data obtained in mercury by Gilles Holst and H. Kamerlingh Onnes in 1911, showing for the first time the transition from the resistive state to the superconducting state.
However, all superconductors show the drop of resistance, either gradually or suddenly, at a particular transition temperature, known as superconducting transition temperature, Tc. Infinite conductivity implies that if a current were passed through the material during
its superconducting phase, the current would flow forever without any dissipation.
Generally speaking, superconductivity is the most spectacular phenomenon exhibited by various materials at low temperature. The discovery of superconductivity has been the central subject in condensedmatter or lowtemperature physics for more than a century, and has triggered extensive research activities from both the basic and the practical points of view. In two years after the discovery of superconductivity in mercury, lead was found to superconduct at 7.2 K. In 1930, superconductivity was discovered in niobium, occurring at 9.2 K. This is the highest transition temperature among all elemental metals. In 1933, W. Meissner and R. Ochsenfeld discovered in Berlin one of the most fundamental properties of superconductors: perfect diamagnetism. They found that the magnetic flux is expelled from the interior of the sample that is cooled below its critical temperature in weak external magnetic fields (see Figure 1.2). Thus, they found that no applied magnetic field is allowed inside a metal when it becomes superconducting. This phenomenon is known today as the Meissner effect. Dutch physicists C. J. Gorter and H. B. G. Casimir introduced in 1934 a phenomenological theory of superconductivity based on the assumption that, in the superconducting state, there are two components of the conducting electron “fluid”: “normal” and “superconducting” (hence the name given this theory, the two-fluid model). The properties of “normal” electrons are identical to those of the electron system in a normal metal, and the “superconducting” electrons are responsible for the anomalous properties. In the superconducting state, these two components exist side by side as interpenetrating liquids. The twofluid model proved a useful concept for analyzing, for example, the
thermal and acoustic properties of superconductors. Following the discovery of the expulsion of magnetic flux by a superconductor—the Meissner effect—the brothers F. and H. London together proposed in 1935 two equations to govern the microscopic (local) electric and magnetic fields. These two equations provided a description of the anomalous diamagnetism of superconductors in a weak external field. The London equations explained not only the Meissner effect, but also provided an expression for the first characteristic length of superconductivity, namely what became known as the London penetration depth (λL). Another interesting phenomenon, vortices in
superconductors was discovered by L. V. Shubnikov and coworkers in 1937. They found an unusual behavior for some superconductors in external magnetic fields. Actually, they discovered the existence of two critical magnetic fields for typeII superconductors and the new state of superconductors, known as the mixed state or the Shubnikov phase. The isotope effect discovered by Maxwell and Reynoldsv describes the relation between Tc
and the isotopic mass of the superconductor [23]. This information based on experiments on naturally occurring mercury and its isotope, observed a decrease in Tc with an increase
in isotopic mass. This allows for the assumption that the basis of superconductivity relies on electronphonon interactions, an assumption that would later lead to the formation of the BCS theory. In 1956 Leon Cooper showed that, in the presence of a very weak electron phonon (lattice) interaction, two conducting electrons are capable of forming a stable paired state. This paired state is now referred to as the Cooper pair. The BCS theory relies on the assumption that superconductivity arises when the attractive Cooper pair interaction dominates over the repulsive Coulomb force. A Cooper pair is a weak electronelectron bound pair mediated by a phonon interaction. In 1957, two papers released by Bardeen, Cooper, and Schrieer [45] described the conceptual and mathematical foundation for conventional superconductivity, known as the Bardeen
CooperSchrieer (BCS) theory, for which they later received the Nobel Prize in 1972. The central concept of the BCS theory is a weak electronphonon interaction which leads to the appearance of an attractive potential between two electrons. According to BCS theory we are able to explain the experimental behavior of many different superconducting materials, mainly pure elements and some alloys or compounds.
Figure 1.2. Temperature dependence of electrical resistivity of a superconductor. Tc
marks the transition to the superconducting state.
Figure 1.3. The Meissner effect: the expulsion of a weak, external magnetic field from the interior of a superconductor. The field is applied (a) at T>Tc, and (b) at T<Tc.
From a classical point of view, the superconducting state is characterized by two distinctive properties: perfect electrical conductivity (ρ = 0) and perfect diamagnetism (B = 0 inside the superconductor), as shown in Figures 1.2 and 1.3, respectively. The first characteristic is related with lowering the temperature of a material or compound, the electrical resistance tends to diminish in a form that commonly it is called metallic form.
Every superconductor has zero resistivity, i.e. infinite conductivity, for a smallamplitude dc current at any temperature below Tc. In lowering the temperature for pure elements
like Nb, Pb, Sn etc. the critical transition temperature (Tc) in which the resistance
suddenly goes to zero in a very sharp transition. In case of some compounds the transition is so not so sharp rather broad that lower the Tc (zero resistivity) compared to elements.
For example, reported simple and double perovskite Bioxide in this study and some other compounds [614]. This broad change in some way may imply that all the electrons are not participating in the process of this change of resistivity behavior. This intrinsic property of the superconducting state is probably the most fascinating one, and is widely used in different types of practical applications—from microchips to power lines. The second characteristic that defines a superconducting material is the behavior under the influence of a magnetic field. From a classical point of view, every superconductor exhibits perfect diamagnetism, i.e. B = 0 inside the superconductor, as shown in Figure 1.3(b). In fact, as we already know, the magnetic field penetrates into the superconductor within a very thin surface layer having the thickness of the order of λL. To cancel B, a
superconductor creates a dc current on the surface, which gives rise to a magnetization M, so that in the interior of the superconductor 4πM+H = 0. Since the resistivity of the superconductor is zero, this surface current does not dissipate energy. However, the definition of the superconducting state can be changed because, as it is found in an unconventional organic superconductor and perovskite superconductors as well, the applied magnetic field induces superconductivity.Therefore, B 0 inside these superconductors. This state of a typeII superconductor is referred to as the mixed state because it is characterized by a partially penetration of the magnetic field in the interior of the superconducting sample. The field penetrates the superconductor in microscopic filaments called vortices which form a regular triangular lattice. The absolute majority of
all superconductors based on alloys and compounds are of typeII. In the mixed state, their behavior has the same pattern.
However, the real history of highTc superconductivity began in 1986 when
Bednorz and Müller found evidence for superconductivity at ∼30 K in LaBaCuO ceramics [15]. This remarkable discovery has renewed the interest in superconductive research. In 1987, the groups at the Universities of Alabama and Houston under the direction of M. K. Wu and P. W. Chu, respectively, jointly announced the discovery of the 93 K superconductor YBaCuO. Just a year later—early in 1988—Bi and Tlbased superconducting cuprates were discovered, having Tc = 110 and 125 K, respectively.
Finally, Hgbased cuprates with the highest critical temperature Tc = 135 K were
discovered in 1993 (at high pressure, Tc increases up to 164 K). Another surprising and
new series of Febased layered superconducting system has been discovered since 2006. The highest Tc ~58 K in this system was recorded in 2013. Recently, we discovered some
new Bibased perovskite superconductors, their Tc ranges from 23 to 31.5 K. Although
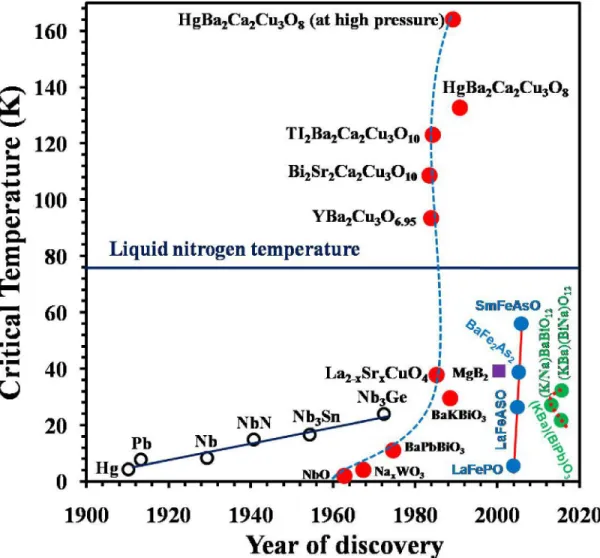
their transition temperature is not so high but new materials have particular interest in aspect of basic scientific research and progress. Figure 1.4 shows the superconducting critical temperature of several cuprates, Febased layered compounds and Bibased perovskites as a function of the year of discovery, as well as Tc of some metallic
Figure 1.4. The time evolution of the superconducting critical temperature since the discovery of superconductivity in 1911. The solid line shows the Tc evolution of metallic
superconductors, solid red line shows Febased superconductors and the dashed lines (blue and red) mark the Tc evolution of superconducting oxides.
Although superconductor is an important functional material for maglev, MRI, power lines etc., it needs considerable energy for cooling it down, which is essential for the occurrence of superconductivity. In order to overcome this problem, many kinds of superconductive materials have been developed by a large number of researchers; for
example, Cubased, Bibased and Febased superconductors etc. Moreover, the superconductive mechanism in hightemperature superconductive materials is an important but unsolved scientific problem thus far. The most numerous and interesting compounds with the perovskite structure are oxides, although some carbides, nitrides, halides, and hydrides also crystallize in this structure. Among the mixed metal oxides, perovskitetype oxides remain prominent. Perovskite structure oxides, have the general formula ABO3, are extensively studied because they show wide varieties of intriguing chemical and physical properties such as superconductivity, ferroelectricity, and ferromagnetism. This broad diversity of properties in a perovskite type oxide also form the possibility of multi component perovskites by partial substitution of cations in positions A and B, giving rise to substituted compounds with formula of A1xA'xB1 xB'xO3. Another important aspect of perovskites are related to the stability of mixed oxidation states or unusual oxidation states in the crystal structure which greatly favored the development of perovskites exhibiting hightemperature superconductivity [16]. The discovery of highTc superconductivity in copper oxides renewed the interest in
superconducting oxides up to the present day. Among the perovskite materials the barium bismuth oxide, BaBiO3 has been studied extensively by a number of researchers[1719]. BaBiO3 possesses an oxidation state of 4+ for Bi because disproportionation of Bi4+ into a mixture of Bi3+ and Bi5+ sites. This mixing of oxidation state acknowledged by writing its formula as Ba2Bi3+Bi5+O6. Electrical conductivity measurements suggested that, the charge ordering accounts for the fact that BaBiO3 is semiconducting rather than metallic. However, the search for a semiconductortometal transition suppress the charge order in
Ba2Bi3+Bi5+O6 led to the discovery of superconductivity with a Tc of 13 K in the BaPb1
xBixO3 (BPBO) system and a Tc of 34 K in the Ba1xKxBiO3 (BKBO) system [16,2021]. This is the highest Tc for noncuprate superconductors until a new class of highTc
superconductors (fluoridedoped rareearth iron arsenide) has been discovered [2223]. Superconductivity in BKBO is observed near a metalinsulator transition. However, in Ba1xKxBiO3 the difference between the two BiO bond lengths decreases and superconductivity emerges at the critical x, when the structural distortions are completely suppressed. These observations indicate that superconductivity in BaBiO3 is mediated by the same mechanism that is responsible for the charge disproportionation. There are many examples of mixedvalent systems such as, CsAuX3 (X = Cl, Br, I) with Au1+ and Au3+ mixedvalent states, A2TI1+TI3+X6 (A = Rb or Cs; X = F, Cl or Br) and Cs2Te4+Te36+O12, where Te4+ and Te6+ are on distinct octahedral sites. The compounds CsAuX3, A2TI1+TI3+X6 and Cs2Te4+Te36+O12 have perovskitetype structure and structurally analogous of BaBiO3 and share a similar mixed valence of the B cations. However, there are no reports of metallic or superconducting behaviors on appropriate doping of any of these phases thus far [2429]. Therefore, the absence of superconductivity in these materials or phases suggests that charge disproportionation is not the sole reason for superconductivity. Recently, Kotliar et. al. [30] explained the hightemperature superconductivity in a large family of materials including (Ba,K)BiO3 by a correlationenhanced strong electronphonon coupling mechanism. On the other hand, this coupling in the above mentioned perovskites was found to be weak, might be account for the absence of superconductivity in agreement with experiments. Another
composition with mixed oxidation states of the type BaPb1xSbxO3 produce superconductors with a maximum Tc ~ 3.5 K [31]. Similar substitutions using Nb or Ta
for Sb did not produce superconductors. The discovery of superconductivity in BPBO and BKBO have been triggered the further research for discovering more new superconductors among Bibased oxides. Kazakov et al. (K0.6Sr0.4BiO3, Tc = 12 K) [32]
and Khasanova et al. (K0.9Bi1.1O3, Tc = 10 K and La0.2K0.8BiO3, Tc = 12 K) [3334] have
discovered new Bicontaining superconducting perovskites with similar structures possessing a threedimensional framework of BiO6 octahedra. Unfortunately, the three dimensional character of the perovskite structure (ABO3) significantly limits the number of Bibased mixed oxides. On the other hand, the synthesis procedures for these Bioxide superconductors are complex and are usually prepared by conventional solidstate reactions or under high pressure or both by using special equipment that maintaining highly protective environment [16,19,35]. Recently, several efforts have been devoted to discover new superconducting materials and to improve the synthesis methods of the existing superconductors [36–39]. However, the first comprehensive study of the structural aspects and distortions of perovskites was made by Woodward [40] and subsequently expanded by Flerov et al. [41], Bock and Müller [42] and finally by Howard et al. [43]. Their aim was to create a background of well established structural characteristics in order to better explain and understand the wide range of physical properties these compounds present. Among the perovskites, the double perovskite compounds have the general formula either A2BB'O6 or AA'BB'O6 in which the prime indicates the possibility of different ions. While A2BB'O6 are being explored for their
magnetic and magnetoresistive properties, AA'BB'O6 type double perovskites are being studied for their catalytic [4445], magnetic [4647] and dielectric properties [48]. Interestingly, despite the fact that their aforementioned physical properties have been studied extensively, it is surprising that no superconducting properties were found in any form of double perovskite structure.
Importantly, discovering a new superconducting system and enhancement of the transition temperature (Tc) is one of the most challenging issues in the superconducting
research field. Therefore, in order to highlight these important issues, I studied on synthesis of superconducting perovskite bismuth oxides under hydrothermal reaction conditions. In this research, I discuss the key factors for understanding the mechanism of superconductivity in the new materials by combining the experimental results with theoretical calculations.
1.2 Perovskite structures
The mineral perovskite (CaTiO3) is named after a Russian mineralogist, Count Lev Aleksevich von Perovski, and was discovered and named by Gustav Rose in 1839 from samples found in the Ural Mountains. The perovskite structure has the general stoichiometry ABX3, where “A” and “B” are cations and “X” is an anion. The “A” and “B” cations can have a variety of charges and in the original perovskite mineral (CaTiO3) the A cation is divalent and the B cation is tetravalent. In the unit formula of perovskite type oxides ABO3, A is the larger cation and B is the smaller cation. In this structure, the B cation is 6fold coordinated and the A cation is 12fold coordinated with the oxygen anions. The space group for cubic perovskites is Pm-3m (No. 221). Figure 1.5 (A) depicts the corner sharing octahedra that form the skeleton of the structure, in which the center position is occupied by the A cation. Alternatively, this structure can be viewed with the B cation placed in the center of the octahedron and the A cation is in the center of the cube. In most cases, different distortions of the perovskite structure appear. To allow these distortions, a constant, t, is introduced by Goldschmidt as a measure of the deviation from the ideal situation, and is given by the equation:
t = (RA+RO) /2(RB+RO) (1)
this is applicable at room temperature to the empirical ionic radii. The constant, t, is known as the tolerance factor and can be used as a measure of the degree of distortion of a perovskite from ideal cubic. Therefore, the closer to cubic, the closer the value of the tolerance factor is to unity. Although for an ideal perovskite t is unity, this structure is
also found for lower tvalues (0.75<t<1.0). shown in Figure 1.5 (B).
Figure 1.5. Perovskite distortion from
All perovskite distortions that maintain the A and B site oxygen coordinations involve the tilting of the BO6 octahedra and an associated displacement of the A cation.
cubic perovskite structure appears in a
temperatures. The distorted structure may exist at room temperature, but it transforms to the cubic structure at high temperature. This transition may occur in several steps through intermediate distorted phases. These deviations from the cubic perovskite struc
proceed from a simple distortion of the cubic unit cell, or an enlargement of the cubic unit cell, or a combination of both.
originally thought to be cubic, but its true symmetry was
Deviations from the ideal structure with orthorhombic, rhombohedral, tetragonal, values (0.75<t<1.0). This distortion from cubic to orthorhombic is
Perovskite distortion from (A) Cubic to (B) Orthorhombic.
distortions that maintain the A and B site oxygen coordinations involve the octahedra and an associated displacement of the A cation.
cubic perovskite structure appears in a rarely for tvalues very close to 1 and at high The distorted structure may exist at room temperature, but it transforms to the cubic structure at high temperature. This transition may occur in several steps through intermediate distorted phases. These deviations from the cubic perovskite struc
proceed from a simple distortion of the cubic unit cell, or an enlargement of the cubic unit cell, or a combination of both. The naturally occurring compound CaTiO originally thought to be cubic, but its true symmetry was later shown to be or
Deviations from the ideal structure with orthorhombic, rhombohedral, tetragonal, This distortion from cubic to orthorhombic is
distortions that maintain the A and B site oxygen coordinations involve the octahedra and an associated displacement of the A cation. The ideal values very close to 1 and at high The distorted structure may exist at room temperature, but it transforms to the cubic structure at high temperature. This transition may occur in several steps through intermediate distorted phases. These deviations from the cubic perovskite structure may proceed from a simple distortion of the cubic unit cell, or an enlargement of the cubic The naturally occurring compound CaTiO3 was later shown to be orthorhombic. Deviations from the ideal structure with orthorhombic, rhombohedral, tetragonal,
monoclinic, and triclinic symmetry are known, although the latter three ones are scarce and poorly characterized.
However, oxides with the perovskite structure receive much attention at present due to the observation of both interesting electrical (superconductive, catalytic, oxygen cathode reduction, piezo electric), combined electromagnetic (colossal magnetoresistive) and mixed electroionic conductive properties. Among the mixed metal oxides, perovskitetype Bi oxides remain prominent and many significant properties of perovskites are believed to have origin in their structure. This broad diversity of properties in a perovskite type oxides have the ability to form the multi component perovskites by partial substitution of cations in positions A and B, giving rise to substituted compounds and form the simple and double perovskitetype structures [6,55]. Another important aspect of perovskites is related to the stability of mixed oxidation states or unusual oxidation states in the crystal structure which greatly favored the development of perovskites, exhibited hightemperature superconductivity [16].
1.3 Hydrothermal synthesis technique
Hydrothermal reaction is defined as any heterogeneous chemical reaction in the presence of a solvent (whether aqueous or nonaqueous) above room temperature and at pressure greater than 1 atm in a closed system [56]. This synthesis usually involves H2O both as a catalyst and occasionally as a component of solid phases in the synthesis at the temperature range (120ºC˂T>1000°C) and pressure (> a few atmosphere). Hydrothermal research was initiated in the middle of the 19th century by geologists and was aimed at
laboratory simulations of natural hydrothermal phenomena. In the 20th century, hydrothermal synthesis was clearly identified as an important technology for materials synthesis, predominantly in the fields of hydrometallurgy and single crystal growth [56]. The ability to precipitate already crystallized powders directly from solution regulates the rate and uniformity of nucleation, growth and aging, which results in improved control of size and morphology of crystallites and significantly reduced aggregation levels that is not possible with many other synthesis processes. Another important advantage of the hydrothermal synthesis is that the purity of hydrothermally synthesized powders significantly exceeds the purity of the starting materials. Besides approach of nanoscaled control, hydrothermal reaction can produce new compounds which can not be prepared by high temperature solid state reaction. Recently, researches have paid lot of attention on the synthetic process for preparing new or development of materials properties. For example, pentavalent bismuthates could not be synthesized by using high temperature reaction except for the system containing barium oxide, and most of bismuthates have trivalent bismuth atoms. However, a variety of pentavalent bismuthates by low temperature hydrothermal reactions using a hydrate sodium bismuthate, NaBiO3·1.4H2O [7,55,57–61]. For example Bi2O4 [57] with the distinct crystallographic sites of Bi3+ and Bi5+, trirutiletype ABi2O6 (A = Mg,Zn) [58], ilmenitetype AgBiO3 [59] and LiBiO3 [60] was obtained by this method. Also this starting compound could be used for ionexchange reaction to yield SrBi2O6, BaBi2O6 [50,62] and (Li,Na)BiO3 [63]. The successful synthesis of these materials inspired me to carry out research by hydrothermal reaction. Although hydrothermal
method has prepared many functional materials but there are little work on the synthesis of superconducting Bibased perovskite materials. In this field synthesis of new compounds, seeking for new materials is still an important and challenging issue. In order to study the new crystal structures or system and superconducting properties, the work in this dissertation focuses on the hydrothermal synthesis and characterizations of Bibased perovskite materials. Crystalline powder samples were synthesized under hydrothermal reaction conditions with lowpressure, lowtemperature (300°C, 1000 bars) laboratory scale type of autoclaves for lowtemperature reactions, including vessels lined Teflon.
1.4 Chemical analysis technique
Inductively coupled plasma (ICP) and iodometric titration methods were used for the chemical analysis in this study. Inductively Coupled Plasma Mass Spectrometry or ICPMS is an analytical technique used for elemental determinations introduced in 1983 and has gained general acceptance in many types of laboratories. This is a quantitative analysis technique used for elemental analysis of our powder samples. The synthesized products were dissolved completely in mixture of HCl+HNO3 at room temperature or heated around 50 ºC to make the dissolve solution fast. Chemical analysis labs were early adopters of ICPMS technology because of its superior detection capabilities, particularly for the heavier elements Bi, Pb, Ba etc. ICPMS has many advantages over other elemental analysis techniques such as atomic absorption and optical emission spectrometry, including ICP Atomic Emission Spectroscopy (ICPAES), including:
1) Detection limits for most elements equal to or better than those obtained by Graphite Furnace Atomic Absorption Spectroscopy (GFAAS).
2) Higher throughput than GFAAS.
3) The ability to handle both simple and complex matrices with a minimum of matrix interferences due to the hightemperature of the ICP source.
4) Superior detection capability to ICPAES with the same sample throughput.
An ICPMS combines a high temperature ICP (Inductively Coupled Plasma) source with a mass spectrometer. The ICP source converts the atoms of the elements in the sample to ions. These ions are then separated and detected by the mass spectrometer. The chemical compositions of our products were determined by inductively coupled plasma (ICP) analysis (SPS 3500 DD, Hitachi) in central analysis laboratory. The chemical analysis results obtained from ICP confirmed the presence of expected elements (Bi, Pb, Ba, K, and Na) with a constant ratio. The amount of these elements was determined easily in weight percent by ICP analysis. To calculate the concentration of each element, the ICP data were converted to be a molar ratio of the detected elements. By taking into account these chemical analysis results, the subsequent refinement was performed using SXRD and/or NPD data.
The oxidation state of Bi is strongly related to the superconducting properties of our synthesized products in this study. In order to determine the oxidation state of Bi in our sample the iodometric titration measurement using an automatic titrator (TOA DKK AUT701) was performed. For the measurement the powder samples of 100 mg were
dissolved into potassium iodide (KI) and 1 M HCl solutions. The amount of oxidizing agent is determined by titration of iodine with thio sulfate.
1.5 Magnetic susceptibility
Susceptibility (χ) is a measure of the quality of the magnetic material and is defined as the magnetization produced per unit applied magnetic field (H). Generally it is a dimensionless quantity. Susceptibility can be quantified in terms of molar/gram/volume susceptibility depending if the measured susceptibility is per unit mole/gram/volume. Experimentally one obtains volume susceptibility which is directly related to volume fraction of a material. The magnitude and sign of susceptibility vary with the type of magnetism, and hence characterizes the various magnetic materials. Although B, H, and M must necessarily have the same units, it is customarily to denote in CGS (SI) units, B in gauss (tesla, T), H in Oersted, Oe (A/m) and M in erg/Oe cm3 or emu/cm3 (A/m). In this project my job was to measure temperature dependence DC magnetic susceptibility of the powder samples. The temperature dependence of the DC magnetic susceptibility was measured over the temperature range of 2.0–40.0 K in an external field of 10 Oe using either a superconducting quantum interference device (MPMS5S, Quantum design) or a vibrating sample magnetometer (PPMS, Quantum Design). Samples with mass 1030 mg were mounted with arbitrary orientation between two clear plastic straws. The magnetization M(T) versus temperature was measured in an external field of 10 Oe where the susceptibility is χ(T) = M(T)/H . Initially, we measured magnetic susceptibility (magnetization) data in emu unit. Later on, the susceptibility data was converted into
(emu/g) unit just dividing it by mass of the powder sample that was used for the measurement. Finally, this data is plotted using the formula 4π(M/H) = 1 for perfect diamagnetism measured in ZFC mode at 23 K. Volume fraction was calculated using the theoretical density (7.88.0 g/cm3) obtained from refinement result and putted in the formula as 4πM/H (emu/g g/cm3) = 4πM/H (emu/cm3) to obtain shielding volume fraction at 23 K.
1.6 High pressure experiment
At high enough pressure almost every ambient pressure structure becomes unstable and transforms into a structure of higher density and, frequently, of higher symmetry. Some elements or compounds undergo a sequence of structural transitions into several different phases under applied pressure. Many of these new structures are metallic and superconductivity was observed in a large number of highpressure phases even when the compound was not superconducting at ambient pressure. However, in this research high pressure (HP) experiments were performed for the preparation of samples pellets. As mentioned earlier, our hydrothermally synthesized samples were in crystalline powder form. In order to make the fourprobe standard terminal for electrical resistivity measurement it was mandatory to make the pellet of powder samples. Initially, the pellet of the sample was prepared by a uniaxial pressing or by a hot (300 ºC) high isostatic pressing (HIP) as high as several tens of MPa in our laboratory. Unfortunately, zero resistivity was not achieved in the pellet of sample at this pressure and temperature. Heating above 400 ºC led to decomposition of sample, thus it was difficult to make the
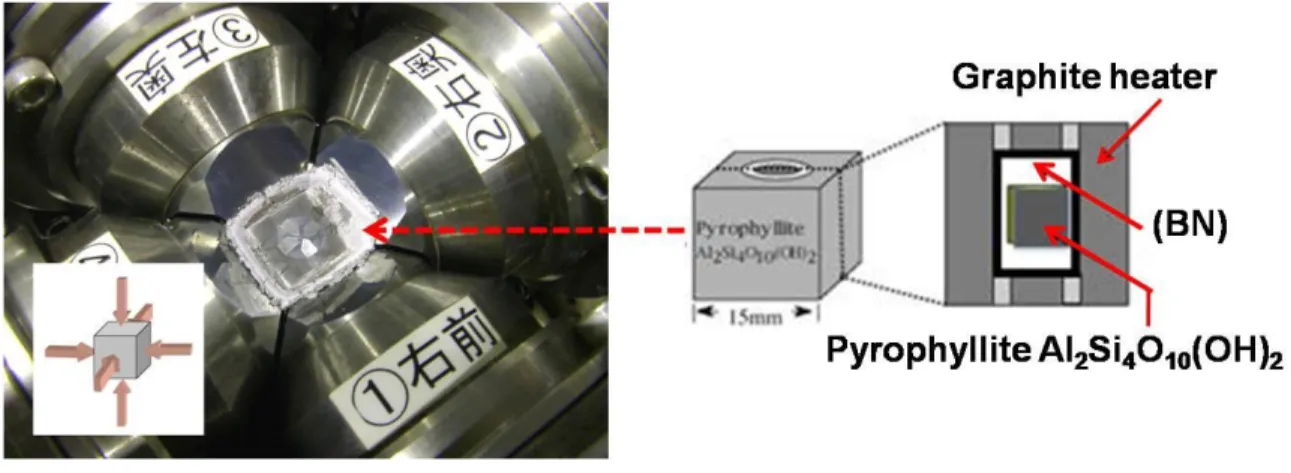
sintered pellet of powder. Therefore, the pellet of the powder sample was prepared using a cubicanviltype high pressure facility at Tokyo Institute of Technology (TIT) in collaboration with Materials and Structures Laboratory (Professor Masaki Azuma group). For the HP experiments the powder sample approximately 11.5 g was charged tightly inside cylindrical shape gold capsule. The gold sample capsule was placed inside a Boron Nitride (BN) sleeve, inserted in a graphite cube and thermocouple was connected with the assembly to supply heat. The cube with BN sleeve, sample capsules, thermocouple was made ready for HP synthesis. The sample cube was placed with the marked face meeting the guide block and inserted the guide block under high pressure equipment and fixed it by tighten two bolts. The materials were then subjected to high pressure synthesis under 68 GPa pressure and at RT200 ºC for 30 minutes using a computer program attached with the cubicanviltype high pressure cell, as shown in Figure 1.6.
Figure 1.6. Preparation of sample pellet using cubicanviltype high pressure cell.
End of HP synthesis samples were collected as hard dense pellet form. The structural stability of the sample was observed in this pressure range as we could not find a
significant change in the laboratory XRD pattern. Therefore, the subsequent electrical resistivity was measured by making fourterminal on these pellets of samples to confirm zero resistivity.
1.7 Resistivity and electronic transport
Electronic transport studies were made for the characterization of the superconducting and normal state properties of the synthesized samples. As mentioned earlier, the pellet of powder samples were made using high pressure facilities for resistivity measurements. Pellet of samples for electronic transport measurements were fashioned into geometric bars approximately 23 mm in length and 0.50.8 mm thick. For best electrical contacts, gold pads were evaporated or sputtered onto the sample pellet. Then the standard four terminals was made using 25 m diameter Au wires attaching by Ag paste cured at room temperature for 30 minutes in air. Figure 1.7 shows the standard fourterminal of powder pellet of our sample after high pressure experiment. After making terminals contact resistances of the samples were checked that ranged from 20 to 50 Ω. Fourpoint resistivity measurements in zero field or applied magnetic field were made using a Model 6000 dc resistance bridge at 16 Hz with applied current 510 mA. The electrical resistivity was measured with the resistance bridge between 2 and 300 K using a standard fourprobe method (PPMS, Quantum Design). The resistance bridge was attached to a Janis superconducting magnet cryostat system equipped with a 3He insert and 9 T superconducting magnet. The magnetic field dependence of electrical resistivity of the samples under applied fields from 0.1 to 1.9 T in an intervals of 0.1 0.3 T were
applied. These applied magnetic field dependence resistivity demonstrate the further evidence of superconductivity and detected the types of superconductor as well.
Figure 1.7. Preparation of standard fourterminal by sample pellet after high pressure experiment.
1.8 Powder diffraction techniques
In the development of new materials, the goal is usually to understand the connection or correlation between material properties and materials structure. The stepping stones to this understanding are the fundamental crystal structure, the position and chemical species of the constituent atoms, the species, location, and concentration of impurities and the nature of the specimen structural defects. Structural crystallography is often thought to be synonymous with singlecrystal crystallography, yet to several decades, powder diffraction has made important contributions to the understanding of
materials structure and behavior. A crystal can be described as an ordered arrangement of atoms. The positions of the atoms within the unit cell can be expressed as a function of three fractional coordinates x, y and z. The 3D nature of the structure means it is convenient to introduce planes denoted (hkl) where h, k and l are Miller indices and used to describe the orientation of the planes related to their intersection with the unit cell axes. When electromagnetic radiation of a suitable wavelength is sent onto an array of unit cells (a crystal) at a given θ angle, the interference phenomenon that arises can be treated as if it occurs by radiation being reflected from the (hkl) planes within the structure. However, the most common crystal structure determination techniques use X ray or high energetic synchrotron Xray diffraction (SXRD) and neutron radiation as their wavelengths are of the same order of magnitude as inter atomic distances. The two techniques are similar because they both follow the principles described above. However, the interaction between matter and Xrays or neutrons is quite different and interpretation of the resulting diffraction experiment can very often lead to complementary information. Xrays interact directly with the electrons surrounding the nucleus and, therefore, the scattering factor increases with the number of electrons present. The intensity of the diffracted beam is therefore more influenced by heavy atoms. In a structure where both heavy and light atoms are present, contributions to reflections from light atoms can be low. Therefore, the use of Xray diffraction in such a sample would then provide reliable information on the position of the electronrich elements while the uncertainty on other atomic positions might be significant. Notably, synchrotron radiation is inherently advantageous to laboratory Xrays in structural
characterizations for several reasons; the most conspicuous are given below: 1) High brightness and high intensity, many orders of magnitude than the best Xray laboratory source. II) High collimation, i.e. small angular divergence of the beam; III) high level of polarization; IV) Low emittance, i.e. the product of source cross section and solid angle of emission is small; V) Large tunability in wavelength by monochromatization; VI) Pulsed light emission etc. In this research, I worked with high resolution synchrotron powder diffraction for structural and analytical studies. The superior nature of the synchrotron radiation is best suited for insitu studies at high and low temperatures to follow chemical reactions. However, high temperature SXRD measurements are of great interest for some applications, such as, following thermal expansion of solids or structural changes with temperature. In this research, the synchrotron Xray powder diffraction (SXRD) data were collected using a Debye–Scherrer camera installed at the BL02B2 powder diffraction beam line at SPring8 with approval of the Japan Synchrotron Radiation Research Institute (JASRI) (Proposal Nos. 2013A1299 and 2014A1008). The powder sample was sealed in a quartz glass capillary with an inner radius of 0.2 mm. The wavelength was calibrated to 0.41365(2) Å using CeO2 as the standard. Scanning parameters were set as follows: step interval, 0.005º; counting time, 5 s/step; diffraction angle (2θ), 280º. Hightemperature synchrotron Xray diffraction analysis was also performed from room temperature to 800 ºC. Importantly, my synthesized superconductors possess heavy metal (Bi) oxides, and neutron powder diffraction data provide useful information on lighter elements such as, oxygen atoms, vacancy etc. in the presence of heavy atoms because the scattering length of the lighter elements (oxygen
nucleus) is relatively large and independent of diffraction angle. While Xray scattering is proportional to atomic number (Xrays are scattered by electrons), neutron scattering is a nuclear reaction, so the scattering power may be as large for oxygen as it is for Bi. Neutrons interact not with electrons but with the nucleus itself. Two consecutive elements in the periodic table that are hardly distinguishable by X rays can therefore scatter neutrons very differently and be differentiated. In the systems studied in this work, however the main advantage of neutrons is that the scattering power of light elements (such as oxygen) can be comparable to heavy element (Bi) and therefore bring complementary information to Xray data. In this study, neutron powder diffraction (NPD) measurements were performed in air at 22.1 ºC with wavelength neutrons beam of 1.62124(4) Å. The scan covered a 2θ range of 15.0 to 160.0º with a step size of 0.1º/2θ. The diffraction measurements were carried out on the angledispersivetype neutron diffractometer Echinda [64] at the Open Pool Australian Light water reactor (OPAL) at the Bragg Institute, Australian Nuclear Science and Technology Organization (ANSTO). The details of the structural refinement was performed using NPD and SXRD data by the Rietveld method with the program RIETANFP [65] that will be described in the subsequent section.
1.9 Computational methods
This section will focus on the details of software packages for structural analysis and electronic calculations of our synthesized samples. It is straight forward to simulate a diffraction pattern from a structure whose unit cell parameters and atomic positions are known. One can then compare experimental data to a reported or proposed structure. If the two patterns (calculated and experimental) present convincing similarities, a refinement of the structure can be attempted so that calculated pattern fits the experimental data better. One thus obtains a better description of the structure. The Rietveld analysis is a powerful method has greatly extended for the structural detail which can be obtained routinely from powder diffraction patterns. It is applied to the investigation of crystal structures when single crystals cannot be prepared at all or when the properties of interest of the singlecrystal form differ from those of the polycrystalline form. In this work, a computer software package, RIETANFP [65] has been used for the application of the Rietveld method to angledispersive synchrotron Xray and neutron powder data analyze. It incorporates large data bases storing information about space groups, lattice parameters, atomic scattering factors, anomalous dispersion corrections, coherent scattering lengths, etc.; all space groups can be handled without additional programming. It can not only plot the observed and calculated intensities after the refinement but also simulate diffraction patterns of pure substances and mixtures from usersupplied profile and structure parameters. Therefore, a most probable structural model was proposed based on SXRD or NPD data or both by the Rietveld method with the computer program RIETANFP in this study. During the refinement peak shape was
approximated by split pseudoVoigt function, and the background was approximated with a 12parameter Legendre polynomial, were simultaneously refined. The unit cell, zero point, scale, profile shape, and crystal structural parameters were also refined simultaneously. The crystal structures were visualized by the computer program VESTA [66].
Theoretical investigations related to the electronic properties have been studied in order to understanding the possible mechanism of superconductivity in the family of Bi oxide perovskite. To conserve this purpose, the electronic band structures and atom projected density of states (DOS) were performed using CASTEP code [67] within the framework of density functional (DFT) theory. The Perdew–Burke–Ernzerhof (PBE) exchange correlation functional [68] was used. The Broyden–Fletcher–Goldfarb–Shanno (BFGS) minimization technique was used to minimize the structural parameters for the synthesized compound. Geometry optimization was achieved using convergence thresholds of 5 106 eV/atom for the total energy, 0.001 eV/Å for the maximum force, 0.02 GPa for the maximum stress, and 5 104 Å for the maximum displacement. The irreducible Brillouin zone was sampled by 6 6 6 or 12 12 12 Monkhorst–Packk point mesh, and the plane wave energy cutoff (Ecut) of 500 eV was used to expand the electronic wave functions.
1.10 Goals of present research
Bismuthcontaining oxide materials are of particular interest for fabricating new functional materials and development of their properties as well. This is not only because of their physical properties but also results of the environmentally friendly nature of bismuthoxides precursors and materials. In the present research, I selected some Bi oxidebased starting materials as follows, NaBiO3.nH2O, PbBi2O5.9.H2O, SrBi2O6, Ba(OH)2.8H2O and KOH as main research system. It is well known that, hydrothermal method is a useful technique to crystal growth of quartz, preparation of metal oxide powder and nanosized particles etc., but there are very few reports on synthesize of superconducting materials. For the first time, I investigated the potentially of hydrothermal reaction in preparing of new superconducting system and materials in details.
In this thesis, my main goal was to synthesize some new Bibased perovskite superconducting materials using the above mentioned starting materials by adjusting structure and compositions via lowtemperature hydrothermal reaction conditions. It is expected that, the advantages of hydrothermal synthesis at relatively lowtemperature produce novel Bioxide based materials with new structural system and potential new properties (superconductivity). Additionally, the performed present work can be a possible route to discover other superconducting system and even to exploit new superconductors in near future.
![Figure 2.7. Electron diffraction of double perovskite compound along [001] zone axis](https://thumb-ap.123doks.com/thumbv2/123deta/7695008.1216876/66.918.138.481.382.732/figure-electron-diffraction-double-perovskite-compound-zone-axis.webp)