Development of Novel Ionization Methods for Mass Spectrometry
Using the High Pressure Ion Source and Their Applications to
Biological Molecules
Doctoral Dissertation
Interdisciplinary Graduate School of Medicine and Engineering
University of Yamanashi
March 2014
Abstract
This dissertation deals with the design, fabrication, and applications of novel ionization methods for mass spectrometry. These ionization methods are based on the development of the ion source that uses gas pressure higher than atmospheric pressure. This new method made it possible to analyze an aqueous biological sample that was very difficult to deal with by the conventional techniques.
High pressure ion sources are newly designed and coupled to a LTQ-Velos mass spectrometer (ThermoFisher Scientific). To maintain the first vacuum chamber appropriate to the mass spectrometer used, an extra Roots pump was installed to accelerate the evacuation speed in the first vacuum chamber. The merit of the pressurized gas (air) is based on the Paschen’s law. That is, the higher the pressure, the higher the gas breakdown voltage in the high-pressure regime of the Paschen curve. By increasing the ion source pressure to about 3 atm, it was possible to generate electrospray without worrying about the occurrence of gas breakdown even for the aqueous solution that needs relatively high voltage to disperse the liquid by electrospray. By using the high-pressure ion source, the ion collection efficiency through the inlet capillary would increase due to the higher ionic gas density. This was verified by the measurement of the pressure dependence of the ion intensities on the ion source pressure. The developed super atmospheric pressure ion source was found to be applicable to any types of ionization methods, e.g., electrospray, probe electrospray, high-pressure ion/molecules reactions and field desorption. It should be noted that the ion intensities decreased gradually at higher pressure than 3 atm. The optimum pressure at around 3 atm may be related to the transition of the gas flow in the ion sampling capillary from laminar to turbulence at the Raynolds number of about 3000.
Nanoelectrospray (nanoESI) is now a standard method in the mass spectrometry community due to its much higher sensitivity than conventional electrospray. It generally uses a metal coated glass capillary as a nanoESI emitter that is quite costly. Besides, nanoESI tip is easily clogged and fragile. Thus, development of more robust and as equally sensitive nanoESI is highly necessary. In this regard, I tried to develop much less expensive nanoESI that uses a disposable plastic pipette tips (gel loading tip with inner diameter about 100 µm). Even if it has an inner diameter of 100 m that is about two orders of magnitude larger than that of nanoESI emitter, it showed a performance similar to nanoESI under super atmospheric pressure conditions. Namely, a gel loading tip can be an alternative to nanoESI emitter. It is
worth while noting that it was possible to generate the stable electrospray (no occurrence of gas phase breakdown) for the aqueous solution with the flow rates similar to nanoESI. This method also guaranteed the sensitivity as good as nanoESI. It should be stressed that the great figure of merit of the present method is that it can treat “aqueous solution”. The conventional method can only use organic solvent system by which denaturation of proteins is unavoidable. This problem is totally circumvented by the present method. This method is highly promising for rapid screening for the real-world samples because it does not need any liquid pumping (electrospray is spontaneous), free from clogging (larger bore size is used), and very robust (plastic tube is used). In this thesis, the application of the present method to the analysis of protein, peptides, sugar, metabolites, powder and viscous sample was presented. This technique may be extended to the analysis of single cell with sub cellular level. The backside insertion method would be applicable to perform the nanoscale imaging; a specific location of analytes without homogenizing the whole biological sample.
In chapter 6 and 7, field desorption and chemical ionization under super atmospheric pressure have been described. These two methods are found to be successfully applicable to the analysis of dry, volatile and semi volatile compounds with a high detection sensitivity. The detection of biomarkers, illicit drugs, and explosives are of the special interest for the future project.
In summary, the development of the unprecedented technique that uses super atmospheric pressure ion source has been described. Because no gas phase breakdown is anticipated, the present method would be widely applicable to many types of ionization methods as described in the text. Thus the present method would pave the way for the new era of the next generation mass spectrometry.
Abbreviations
AcOH Acetic acid
APCI Atmospheric pressure chemical ionization
CI Chemical ionization
DESI Desorption electrospray ionization
DNA Deoxyribonucleic acid
EHC Emitter heating current
ESI Electrospray ionization
FD Field desorption
FI Field ionization
HP-CI High pressure chemical ionization
HP-ESI High pressure electrospray ionization
HP-FD High pressure field desorption
HP-LC High performance liquid chromatography
HP-nanoESI High pressure nanoelectrospray ionization
HV High voltage
ID Inner diameter
L/min Liter per minute
LIFDI Liquid injection field desorption ionization
LITs Linear ion traps
m/z Mass-to-charge ratio
MALDI Matrix assisted laser desorption ionization
MeOH Methanol
MS Mass spectrometry
nanoESI Nanoelectrospray ionization
NH4Ac Ammonium acetate
OD Outer diameter
PC Phosphatidylcholine
PESI Probe electrospray ionization
QIT Quadrupole ion traps
QMF Quadrupole mass filter
RF Radio frequency
RNA Ribonucleic acid
SDS Sodium dodecyl sulphate
TAG Triacylglycerol
TIC Total ion current
1
Contents
Chapter 1 ... 5 1.1 General introduction ... 5 1.1.1 Mass spectrometry ... 5 1.1.2 Ionization techniques ... 51.13.1 Mechanism of electrospray ionization ... 10
1.1.4 ESI based ambient ion source ... 11
1.1.4 Nano-electrospray ionization (NanoESI) ... 14
1.1.6 High pressure ESI ... 17
1.1.6.1 Alternative ESI emitter using laboratory consumable ... 20
1.1.6.2 Short Summary ... 20
Chapter 2 ... 21
2.1 Mass spectrometer ... 21
2.1.1 Time of flight mass spectrometer ... 21
2.1.2 Ion Trap ... 22
2.1.2.1 LTQ mass spectrometer ... 23
2.1.2.2.1 The setting of instrument parameters ... 23
2.1.2.2.2 The Limitation of LTQ ... 23
2.1.2.4 Modification of mass spectrometer for high pressure ion source ... 25
Chapter 3 ... 27
3.1 Development of high pressure probe electrospray ion source for aqueous solution ... 27
3.1.1 Abstract ... 27
3.1.2 Introduction ... 28
3.1.3 Experimental ... 29
3.1.3.1 Mass spectrometer... 29
3.1.3.2 High pressure probe electrospray ion source ... 30
3.1.3.3 Sample preparation ... 33
3.1.4 Results and discussion ... 33
3.1.4.1 Comparison of HP-PESI and PESI ... 33
3.1.4.2 Detection of native proteins ... 38
3.1.5 Conclusion ... 38
Chapter 4 ... 39
4.1 High pressure nano electrospray ionization mass spectrometry for analysis of aqueous solution ... 39
2
4.1.1 Abstract ... 39
4.1.2 Introduction ... 40
4.1.3 Experimental ... 41
4.1.3.1 Mass spectrometer... 41
4.1.3.2 High pressure nanoESI ion source ... 42
4.1.3.3 Sample preparation ... 45
4.1.4 Result and discussion ... 45
4.1.4.1 Effect of pressure on ESI plume ... 45
4.1.4.2 Effect of pressure for high ion intensities ... 47
4.1.4.3 Comparison of HP-nanoESI and AP-nanoESI ... 50
4.1.4.4 Sensitive detection of native proteins ... 51
4.1.5 Conclusion ... 54
Chapter 5 ... 57
5.1 Realizing nano-electrospray ionization using disposable pipette tips under super atmospheric pressure ... 57
5.1.1 Abstract ... 57
5.1.2 Introduction ... 58
5.1.3. Experimental ... 60
5.1.3.1 Mass Spectrometer ... 60
4.2.3.2 High pressure nanoESI ion source ... 61
5.1.3.3 Sample preparation ... 64
5.1.4 Results and discussion ... 64
5.1.4.1 Effect of atmospheric pressure ... 64
5.1.4.2 Effect of high voltage ... 68
5.1.4.3 Measurement of nanoESI flow rate... 68
5.1.4.4 Effect of pressure ... 71
5.1.4.5 Suppression effect ... 72
5.1.4.6 De-saltation of protein ... 74
5.1.4.7 Comparison of pulled glass capillary and gel loading tip ... 78
5.1.4.8 Detection of native protein ... 78
5.1.4.9 Biological sample analysis ... 80
5.1.5 Conclusion ... 86
Chapter 6 ... 89
3
6.1.1 Abstract ... 89
6.1.2 Introduction ... 89
6.1.3 Experimental ... 92
6.1.3.1 Mass spectrometer... 92
6.1.3.2 Field desorption ion source ... 92
6.1.3.3 Sample preparation ... 95
6.1.3 Results and discussion ... 96
6.1.3.1 Biological sample analysis ... 97
6.1.3.2 Detection of electrolytic compounds ... 100
6.1.3.3 Analysis of ionic liquids ... 102
6.1.3.4 Analysis of lipids ... 103
6.1.4 Conclusion ... 104
Chapter 7 ... 105
7.1 Super-atmospheric pressure chemical ionization mass spectrometry ... 105
7.1.1 Abstract ... 105
7.1.2 Introduction ... 106
7.1.3 Experimental ... 107
7.1.3.1 Super-atmospheric pressure chemical ion source ... 107
7.1.3.2 Sample preparation ... 113
7.1.4 Results and discussion ... 113
7.1.4.1 Background ions ... 113
7.1.4.2 Detection of illicit drug ... 115
7.1.4.3 Detection of explosives ... 119
7.1.4.4 Detection of benzene ... 123
7.1.5 Conclusion ... 129
Chapter 8: Concluding remarks ... 131
8.1 Summary ... 131
8.2 Future prospect ... 133
Publications list (Thesis related) ... 148
Poster presentation ... 149
5
Chapter 1
1.1 General introduction
1.1.1 Mass spectrometry
Mass spectrometry is a sensitive and dispensable technique in all branches of analytical science. It offers qualitative and quantitative information for the chemical compounds/ mixtures of interest. To obtain the mass spectrum, it involves ionization of the target analytes, ion separation, ion detection, and the analysis ion trajectory to resolve the ions according to their mass-to-charge ratio (m/z)1. Therefore, mass spectrometry has three major parts, i.e. ionization source, mass analyzer, and ion detector.
1.1.2 Ionization techniques
The neutral molecule is introduced to the ionization source to form ions. Many ion sources of different types have been developed, and each is specialized in handling solid, liquid and gas phase sample. After the ionization process, gaseous ions are analyzed and separated by mass analyzer and the detector, respectively. A brief review of the representative ion source is given here. Early ion sources were developed and used exclusively under high vacuum condition. Such ion sources include electron ionization (EI), chemical ionization(CI), desorption EI/CI using heat or plasma, fast atom bombardment (FAD)2, field desorption/ionization (FD/FI)3.In electron ionization (EI), gaseous sample is introduced and ionized under a high vacuum condition by 70 eV electron beam. Chemical ionization will take place in the EI source if the pressure of the ion source is increased by introducing reactant gas. Field desorption is an ionization techniques where sample from wire is desorbed
6
by high electric field and heat. These methods have some limitations. For example, EI and even FAD could only produce fragment ions without the trace of intact peptides of proteins. Matrix-assisted laser desorption ionization (MALDI)4, and electrospray ionization (ES)5 are two ionization methods developed in the 1990s, which are capable of ionizing large in-tact bio-molecules, as large as proteins and oligomers. They are much softer than the earlier ionization methods and used extensively in the modern mass spectrometry instruments.
Popularly used atmospheric pressure chemical ionization is another technique that use solid sharp needle to ionize analytes. The analyte is accepted proton or adduct from reactant ion that can be supplied by water or solvent vapor containing ambient gas. High potential is also required for generation of discharge. According to the high pressure electrospray phenomenon, it can be applied high electric field to improve ionization efficiency. These two techniques have been compared with atmospheric pressure. The results have been demonstrated similar phenomenon with high pressure electrospray ionization which can overcome corona discharge and the detection of sensitivity.
In MALDI, matrix and analyte are mixed in a solution first, and deposited to a target place by dried-droplet method. Upon the absorption of sufficient photon with suitable energy (wavelength), the analyte is co-ablated with the light absorbing matrix, and the gaseous ions are formed under in the ablation/desorption process (Figure 1.b).The process involved in the ionization is complicated and it depends on the laser wavelengths and the properties of the selected matrix. MALDI has been used in many analytical application including the biological tissue analysis6,7. In MALDI, it is difficult to ionize molecular weight less than 1,000 Da due to the matrix effect. Most of the metabolites have molecular weights under 1,500 Da.
Atmospheric pressure chemical ionization (APCI) is, as denoted by its name, the chemical ionization (CI) performed under atmospheric pressure. It usually uses corona discharge as the plasma source to generate reactant ions (e.g. H2OH+). It is developed earlier
than ESI, and MALDI, and it has regained its popularity owing to the advent of atmospheric pressure mass spectrometer originally developed for ESI. APCI (Figure 1.d) can handle sample in both liquid and gas phase. In the case of liquid sample, the solution has to be vaporized first before introducing to the corona discharge plasma. Although ESI is softer,8 it is only suitable for polar compound. APCI, in the other hand, can supplement the ESI on this aspect to handle less-polar or non-polar compound.
7
Figure 1. Example of the established ionization sources:
a) Electron ionization (EI): Gaseous sample is introduced and ionized under a high vacuum
condition by 70 eV electron beam. If reactant gas is introduced, the EI source would become a chemical ionization (CI) source.
b) Matrix-assisted laser desorption/ionization (MALDI): the mixture of analyte and matrix is
co-ablated and ionized by the intense laser beam.
c) Field desorption/ionization (FD/FI): the analyte absorbed on the sharp emitter is heated
and then ionized by the strong electric field.
d) Atmospheric pressure chemical ionization (APCI): corona discharge with a sharp needle is
used to generate plasma and the reactant ions for chemical ionization.
LTQ-Velos 20 kV + LTQ-Velos 2.5-3 kV (d) APCI c) FD Analyte matrix
mixture Matrix ion Analyte ion Laser beam To mass analyzer b) MALDI 70 eV electron beam Gaseous sample High vacuum a) EI/CI
8
1.1.3 Electrospray ionization
Electrospray phenomenon was discovered in 18th century. It is one kind of liquid dispersion when a high voltage is applied to the electrically conductive capillary which liquid is passing through. The electrospray jet emerges from the tip of the capillary. At the tip of the electrospray emitter, the liquid form a conical shape, which is popularly known as “Taylor cone”, and the highly charged micro droplets are emitted from Taylor cone apex owing to Coulomb repulsion (Figure 2). When the charged droplet becomes smaller close to the Rayleigh limit due to evaporation, offspring charged droplet will be ejected from the precursor droplet. The size of the offspring droplet is much smaller than the precursor droplet. Further evaporation of offspring droplet will lead to the chain like process that lead to the formation of nanometer size droplet, in which the ionization of solute can take place.
The idea of ionization with electrospray is proposed by Dole. The working electrospray ionization mass spectrometry was first developed by John Fenn and successfully used to analyze large biomolecule, and that work earns him the Novel prize in 2002. There are some parameters which can influence the ionization efficiency of ESI. Those parameter include the diameter of a capillary emitter, the distance of emitter and the ion sampling inlet, the diameter of ion transport tube, the surface tension and conductivity of the solution, etc.
The electric field around the emitter is given by the following equation,
Ec=2Vc/[rcln(4d/rc)]………. (1)
Where rc is the outer radius of ESI emitter, Vc is the applied electric potential and d is the
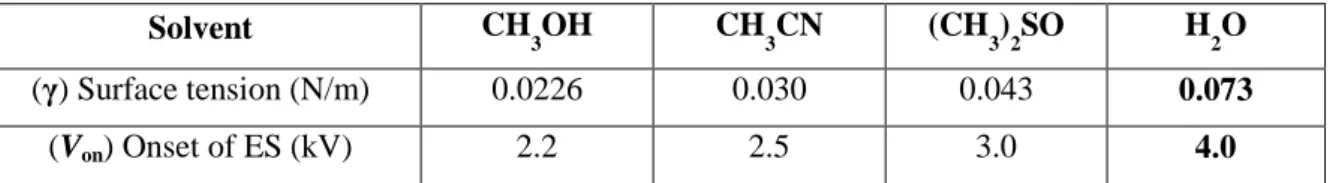
distance from the capillary tip to the counter electrode. The threshold for the onset of electrospray is dependent on the surface tension of the solution, and the geometry of the emitter and electrode distance, and is given as;
Von=2x10⁵ (γrc)1/2ln (4d/rc)……….(2)
where, Von is the onset potential, γ is the surface tension of the solvent and rc is the radius of
the capillary. The threshold voltage of electrospray for different solvent is given in the table 1. Due to the high surface tension of water, it requires higher voltage to obtain stable
9
electrospray. Thus it is easier to induce electrical discharge during electrospray ionization. This problem can be overcome by using the mixture of organic solvent and water.
Figure 2. Typical arrangement of ESI source: The liquid is pumped through a metallic
capillary, and upon the application of high voltage, Taylor cone is formed and a jet of highly charged droplet is emitted. The charged droplet is dispersed by the coulomb repulsion to forms ion. The ion is introduced to the mass spectrometer via an inlet capillary.
Table 1.Onset voltages, Von, for solvents with different surface tension, γ
Solvent CH
3OH CH3CN (CH3)2SO H2O
(γ) Surface tension (N/m) 0.0226 0.030 0.043 0.073
(Von) Onset of ES (kV) 2.2 2.5 3.0 4.0
ESI capillary Taylor cone MS inlet HV
10
1.13.1 Mechanism of electrospray ionization
The study of ionization mechanism is important not only for the better understanding of nature, but also for the further improvement of ESI based ion source. Two models which are widely accepted for the ionization mechanism are:
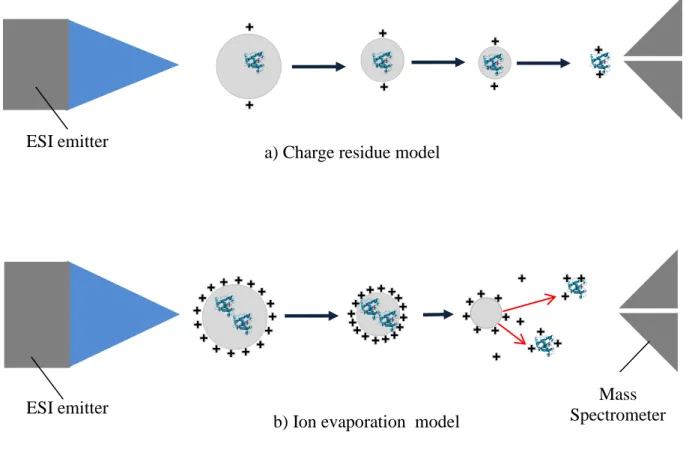
i) charged residue model (CRM), and ii) ion evaporation model (IEM).
CRM was originally proposed by Dole. The process of CRM is illustrated in Figure 3.a. In this case, a protein stays inside the charged liquid droplet as a neutral. When solvent is completely evaporated, the charge will eventually be attached to the protein molecule. This process is likely to be gentle to preserve the structure of native protein if the pH of the solution is adjusted to be neutral. Thus it is believed that CRM model is responsible for the production of native protein ions with minimum number of charge state.
The ion evaporation model (IEM) is proposed by Iribarne and Thomson in 1976. This model involved the production of small ions such as inorganic and organic ions as shown in Figure 3.b. If the charged droplet had been shrink to certain size due to solvent evaporation, and under that condition, if the ions can overcome the attraction force from the droplet surface, some ion can escape from the liquid surface directly, even before the solvent is completely evaporated. Coulomb repulsion between the escaping ion and the charges on the surface of the dropletplay an important role for the reduction of attraction force.
The ion generated from this mechanism should appear in the gas phase earlier than those from the CRM model.
11
Figure 3. Two theoretical models that explain the ionization mechanism for the ESI.
a) Charge residue model (CRM): Charges produced by the electrospray ultimately reach the
analyte droplet when the solvent evaporate completely.
b) Ion evaporation model (IEM): Gaseous ion is desorbed directly from the charged droplet
due to coulomb repulsion before the complete evaporation of solvent.
1.1.4 ESI based ambient ion source
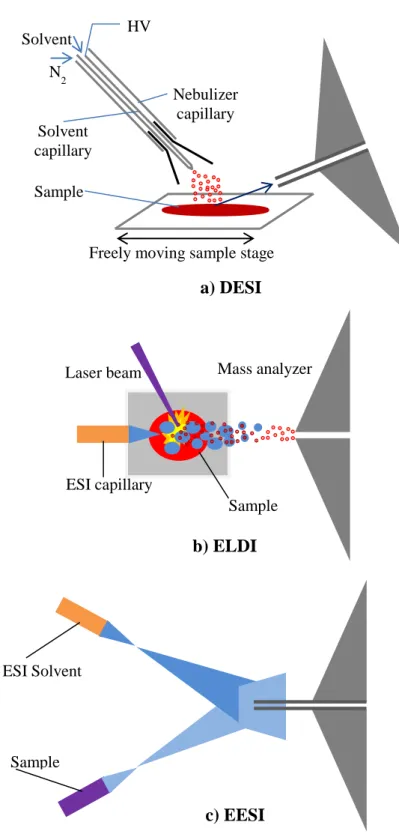
Many ionization methods based on ESI has been developed recently. Among them, DESI, EESI, PESI and ESSI are very popular to ionize intact protein as good as ESI or nanoESI. The characteristic of those ion sources will be is given here briefly. In DESI, the target surface is impinged by a high speed charge droplet jet, and the analyte dissolved into the solvent is carried away and ionized by ESI related process (Figure 4.a). In EESI, nebulized solution droplets jet is mixed with the ESI jets in front of the ion sampling orifice (Figure 4.c). In ESSI, nebulized solution is introduced to form ion in front of the inlet of mass spectrometer. Compared to the pure ESI, which is without any pneumatic assistance, some researcher has claimed that it would be more convenient and efficient to achieve high
a) Charge residue model
b) Ion evaporation model ESI emitter
ESI emitter
Mass Spectrometer
12
detection of native protein with DESI,9 EESI10 and ESSI11. In the case of DESI, and EESI, the high voltage is not applied directly to the protein solution or solid surface, therefore, the unwanted electrochemical reaction that happened on the ESI electrodes can be avoided. There are some limitations for those methods. These three methods are not more sensitive as than the nanoESI, ESI or MALDI.
ELDI is another technique where analyte on the target surface is ablated/desorbed by laser, and mixed with the electrospray plume (Figure 4.b). Shiea et al. demonstrated that ELDI-MS can be used for the direct analysis of solid-state proteins from surfaces without addition of MALDI matrix. `Although, the addition of typical MALDI matrix to ELDI is possible, it is found that the addition of matrix in fact can affect the performance of ELDI in the case of the analysis of cytochrome c.12 For all these, certain degree of sample cleanup is still required to achieve high performance of analyze detection from complex mixtures, biological cells and tissues.
13
Figure 4. The variants of ESI ambient ion source: a) Desorption electrospray ionization
(DESI): The target surface is impinged by a high speed charge droplet jet, and the analyte dissolved into the solvent is carried away and ionized by ESI related process. b) Electrospray assisted laser desorption ionization (ELDI): Analyte on the target surface is ablated/desorbed by laser, and mixed with the electrospray plume. c) Extractive electrospray ionization (EESI): Nebulized solution droplets jet is mixed with the ESI jets in front of the ion sampling orifice.
b) ELDI ESI capillary Laser beam Sample Mass analyzer Solvent N2 HV
Freely moving sample stage Sample Nebulizer capillary Solvent capillary a) DESI ESI Solvent Sample c) EESI
14
1.1.4 Nano-electrospray ionization (NanoESI)
The variant of ESI, known as nano-electrospray ionization or nanospray mass spectrometry,
13
has become a popular technique since 1994. It is theoretically and experimentally described by Mann14. The tip size and the inner diameter of the nanoESI emitter is in the order of < 10µM, which is much smaller than the typical ESI emitter (Figure 5.) NanoESI has several advantages over the conventional ESI. For example, less sample is consumed in nano-ESI because the the flow rate of nano-ESI is in the order of ~10 nL/min, in contrast to ~10 µL/min of typical ESI. Nano-ESI is more sensitive than conventional ESI due to less sample consumption, small droplet size and less flow rate. The initial droplet size emitted from the of nanoESI capillary can be as small as 200 nm in diameter. It is much smaller than conventional ESI (1-2 µm in diameter). Thus, nanoESI can overcome suppression effect over conventional ESI.
The commercial nanoESI emitters are available for off-line and on-line application. Most of the people prefer to use the offline line emitter to online emitter for the handling of precious proteomic sample, which is very limited in volume and concentration. The shortcoming of online nanoESI is that, the capillary is very difficult to clean and the residues left from previous measurement can lead to the problem of memory effect, and that can severely affect the quantitative accuracy of the measurement. Because the inner diameter of the nanoESI capillary is much smaller than that of the ESI, besides, cross contamination, the clogging of the tip is also a problem. Offline nanoESI uses metal coated pulled-glass capillary, and syringe pump, or LC pump is necessary, and flow rate is controlled by the applied high voltage. These offline emitter are designed to be used in a disposable basis, thus the running cost can be higher for handling a large number of sample.
15
Figure 5. Nano electrospray ionization (nanoESI): This figure shows the offline nESI using
a metal coated glass capillary which tip diameter of <100µm. The capillary is positioned at ~90° angle. (Source: New Objective)
16
1.1.5 Probe electrospray ionization
Instead of capillary, a relatively new ion source, namely, probe electrospray ionization (PESI)9 is developed in the University of Yamanashi that uses a solid needle to achieve electrospray. With this simple method, clogging of capillary can be avoided. High voltage is applied to the solid needle. The needle is moved up and down along a vertical axis using a custom made linear actuator system. It has no chance to produce clogging during operation. Figure 6. shows the schematic diagram of PESI system. It has several advantages over nanoESI. For example, nanoESI is not able to detect and analyze biomolecule from high concentration of salt and buffer solution due to clogging problem. This problem can be overcome slightly breaking the capillary tip. Thus, the reproducibility and sensitivity of nanoESI flow rate is not satisfactory11. The great merit of PESI is the diameter of needle tip about 300 nm where the diameter of nanoESI tip is 1 µm. PESI tolerate high concentration of salts and detergents solution and ionize biomolecule sequentially than that of nanoESI15,16.
Figure 6. Probe electrospray ion source (PESI): The needle or wire is moved up and down
along a vertical axis using a linear actuator system. When the needle is at the bottom position, the tip of the needle is adjusted to touch the surface of the sample. When the needle is moved to the upper position, a high voltage is applied on it to generate ESI and ions. The distance between the the needle and inlet is about 3-5 mm.
Sample x,y,z stage Needle Charged droplet HV Needle motion
17
1.1.6 High pressure ESI
Under atmospheric pressure, stable electrospray is more difficult to be maintained for 100% aqueous solution using ESI, nanoESI and PESI. High pressure ESI has been developed in our laboratory recently, in order to achieve sensitive detection of analyte in pure aqueous solution. Organic solvent, such as methanol, is usually added to the ESI spray solution to reduce surface tension of liquid. Acid is used to increase the liquid conductivity to produce stable electrospray. Organic solvent and acid with water is routinely used for ESI of proteins which results in the denaturation, aggregation, and subunit dissociation of protein.
Although nanoESI has been reported to produce stable electrospray of aqueous solution without the use of organic solvent13, the reproducibility is not always guaranteed particularly in the negative ion mode due to the high surface tension of liquid.17
Figure 7. Paschen’s curve: This curve show the relationship between the breakdown voltage
with pressure and two electrode distances. It is expressed as a function of breakdown voltage, pressure and two electrode distances. Different gases (helium, neon, argon, hydrogen and nitrogen) were used to know the efficiency of discharge.
18
Friedrich Paschen studied the breakdown voltage of various gases between parallel metal plates as the gas pressure and gap distance. He gave one equation that explained the threshold voltage to initiate electric arc/discharge between two electrodes as a function of surrounding gas pressure and gap length. This Paschen's equation is given below.18
( )
Where V is the breakdown voltage in Volts, p is the pressure, and d is the gap distance. The constants a and b depend upon the composition of the gas.
According to the paschen’s curve (Figure 7.), if the pressure is increased, the onset potential of for discharge is also increased (Figure 8.a). If the pressure of the ion source is high enough, we can apply sufficient high voltage to the ESI emitter without having the problem of discharge. The H.V. can be even increased up to the appearance of multi cone jet under high pressure condition (Figure 8.d). The first HP-ESI source use an indirect coupling method, and the second prototype used a ion transport tube with 0.25 mm inner diameter without the modification of the mass spectrometer pumping system 19,20.
19
b) c) d)
Figure 8. (a) Plot of the onset voltage for the occurrence of corona discharge versus pressure
for positive (square) and negative (circle) ion modes. Also shown are the onset voltage for the electrospray of pure water, and the voltages required to establish the steady cone-jet, two cone-jet, and multi cone-jet modes.
(b)-(d): Photographs showing the electrospray of pure water in jet mode (b), two
cone-jet mode (c), and multi cone-cone-jet mode (d). The electrospray was conducted under an operating pressure of 4 bar (~4 atm) in negative ion mode.
20
1.1.6.1 Alternative ESI emitter using laboratory consumable
Instead of using the standard and delicate ESI emitter, several research groups are trying different kind’s materials, which are widely available as in the laboratory, as an alternative for low cost ESI emitter.
Aksyonov et al has used a plastic pipette tip as an ESI emitter. High voltage is applied using a platinum wire through solution and electrospray is generated. This pipette tips is suitable for high throughput analysis21. A paper spray ionization techniques has been developed by Cooks group. The paper is cut to make a triangle shape. The sample is kept on the surface of the paper and high voltage is applied to obtain electrospray22. Hu et al. reported a simple and economical ESI technique using a disposable wooden tips that can be used for loading and ionizing the samples23
Gel loading tip is another plastic pipette tips commonly used in gel electrophoresis that can be used as an ESI emitter. Typical inner and outer diameters for the commercial gel loading tip are about 100 m and 300 m, respectively. Although, it is possible to generate nanoelectrospray with these tips by, for example, inserting a conductive wire into the tip to provide the necessary high potential to the loaded liquid.
1.1.6.2 Short Summary
Ionization source is an important part for the mass spectrometry. Although there exist a number of high performance ion source such as vacuum and ambient API ionization sources, there is still a need to provide innovative idea to this research field to provide an ideal ion source that is suitable for all types of samples with high detection sensitivity. This goal forms the basis of this study. In particular, this dissertation is focused on the development of novel ionization methods based on electrospray, field desorption (Figure 1.c), atmospheric pressure chemical and probe electrospray ionization24. These novel methods have the potential to contribute to the analysis of real world application using little or no sample preparation without sacrificing the detection sensitivity.
21
Chapter 2
2.1 Mass spectrometer
2.1.1 Time of flight mass spectrometer
The development of a time-of-flight (TOF) analyzer can be dated back to 1946 by Stephens25. The mechanism of TOF is this. Ions of different m/z are separated in time during their travel along a field-free drift path of known length. Provided all the ions start their travelling at the same time or at least within an adequately short time interval, the lighter ones will arrive earlier at the detector than the heavier ones (Figure 9. )
Figure 9. Schematic diagram of a Time-of-flight mass spectrometer. The ions are accelerated
by the HV electrode to a field free region. Ions of different m/z arrive at the ion detector at different time, and the mass spectrum can be constructed from the precise measurement of their time of flight.
Ion detector
Time
22
2.1.2 Ion Trap
Since the birth of ion trapping techniques in 1960s, it has been fruitfully applied in physics and chemistry, which eventually lead to the award of the 1989 Nobel Prize in Physics to W. Paul26 and H.G. Dehmelt27. The original Paul trap is a three dimensional circular quadrupole
28
. The first linear ion traps were constructed and demonstrated for the storage of 3He+ and H+ ions for several minutes by Church29. Beaugrand et al. used a pentaquadrupole mass spectrometer system to confine ions in the collision cell to study ion-molecule chemistry30. At about the same time, Dolnikowski et al. also used a triple quadrupole system to trap ions in the collision cell to enhance the ion-molecule reactions. This technique has recently been used by others to study ion-molecule chemistry31.
Owing to the ease of fabrication, the use of linear ion trap mass spectrometry has growth rapidly32.Although the radiofrequency (rf) ion traps were used largely for high resolution atomic spectroscopy, spin exchange experiences, and lifetimes of atomic levels33. The new ion trap mass spectrometers were reported recently that make use of the basic structure of a QMF (quadrupole mass filter), that is, of an assembly of four rods in a parallel array, for ion trapping, ion trajectory manipulation, and mass-selective ion ejection.
The principal advantage of a LIT is that a greater number of ions can be confined in the physically larger device than can be confined in a three dimensional QIT (quadrupole ion trap). Thus, the onset of space charge repulsion and accompanying loss of mass resolution and change in mass assignment is experienced commonly at greater ion loading of the trapping device. Virtually all of the useful operating characteristics of the three-dimensional QIT are retained in the LIT that is, collisional focusing, resonant excitation and ejection, multiple stages of mass selectivity for tandem mass spectrometry (MSn), axial modulation, and variation of mass resolution as a function of mass-selective ion ejection scanning rate34.
23
2.1.2.1 LTQ mass spectrometer
Most of the experiment in this study was performed on the commercial linear ion trap mass spectrometer from Thermo Fisher Scientific. There are two version of linear ion trap from Thermo. One is LTQ-XL, and another one is called LTQ-Velos. Their simplified schematics are shown in Figure 10.
LTQ-XL has already been in the, market for quite some time, and it is popularly used for the analysis that involve tandem mass spectrometry (MS/MS) using collisional induced dissociation. MSMS is very essential to know the fragmentation pathway of the molecule during the ionization, and it is very useful for the structure elucidation of ions.
LTQ-Velos (Figure 10.) is a recently released version in which the length of the ion transport capillary (~6 cm) is nearly half of that used in the LTQ-XL. A focusing stacked ring ion guide is employed instead of a standard inlet-skimmer arrangement20. The ring ion guide which is useful to faster ion scans and increase overall instrument sensitivity (Figure 10.). This faster ion scan includes quantitative and qualitative analysis of metabolite profiling in in
vivo and in-vitro studies. More experiment can be done in shorter chromatographic runs due
to faster scan.
2.1.2.2.1 The setting of instrument parameters
There are some instrumental settings which are important for the optimum detection of ions. For example, one may need to adjust the ion injection time to get the satisfactory sensitivity. However, if the injection time is too long, the resolution of the mass spectrum will be sacrificed. There are three selections for the scanning window. The normal one is m/z 50-2000. When the LTQ is operated at low scanning window (20-200 m/z), the intensity of a dominant peak is about 10 times smaller than the normal scanning window (50-200 m/z), because of low ion transmission by the ion guide at low RF amplitude. High mass scan also shows less sensitivity compare to normal scan (50-200 m/z).
2.1.2.2.2 The Limitation of LTQ
Linear ion trap such as LTQ has limited mass range compared to other instrument like TOF mass spectrometer. This could be a problem for native protein analysis. For example, the peaks for the folded protein lay at the high m/z region,35 which is beyond the scanning window of our linear ion trap mass spectrometer (<m/z 4000). However, if the protein is unfolded, the high charged-state species could be detected with good sensitivity.
24
Figure 10.
a) Photograph of LTQ ion trap mass spectrometer.
b) Schematic diagram for the LTQ-XL mass spectrometer with standard heated
capillary-skimer arrangement.
c) Schematic diagram of LTQ-Velos mass spectrometer, that adopts a relatively new ion
transmission technique with stacked-ring ion lens (S-lens) and dual pressure collision cell.
(a)
(b) LTQ-XL
25
2.1.2.4 Modification of mass spectrometer for high pressure ion source
In this thesis, several novel ionization techniques such as high pressure probe electrospray ionization36, high pressure nano electrospray ionization (metal coated glass capillary)37, high pressure nanoESI using disposable pipette tips (gel loading tip)38, high pressure field desorption ionization39 and high pressure chemical ionization40 were coupled to the first pumping stage of LTQ-Velos mass spectrometer directly.
A Roots booster pump with variable pumping speed was connected in between the pump port of the LTQ and the original rotary vane pumps (Figure 11.a) to maintain the pressure in the first pumping stage. The pressure in the vacuum stage is measured with a convection-enhanced Pirani vacuum gauge (Granville Phillips 275 Convectron Gauge) which was equipped in the LTQ-Velos instrument (Figure 11.b). The three phase A.C. motor of the booster pump was controlled by a variable frequency controller (VF-AS1, Toshiba Schneider Inverter, Japan) to adjust the pumping speed. For a proper operation of the mass spectrometer instrument, the pressure in the first pumping stage is kept below 2 Torr. Throughout the experiment, the pressure in the first pumping stage was adjusted in order to maintain a same operating condition for ion guiding lenses under all ion source pressures.
26
Figure 11.The photographs showing the addition modification to the mass spectrometer to
accommodate the high pressure ion source used in this study.
a) A Roots booster pump: It is connected in between the pump port of the LTQ and the
original rotary vane pumps to maintain an operating vacuum condition for mass spectrometer when the ion source is pressurized.
b) Variable frequency controller (VF-AS1, Toshiba Schneider Inverter, Japan) used to
adjust the speed of the three phase A.C. motor of the booster pump, and hence pumping speed.
27
Chapter 3
3.1 Development of high pressure probe electrospray ion
source for aqueous solution
3.1.1 Abstract
Probe electrospray ionization (PESI) is a recently developed method that uses a sharp solid needle as electrospray emitter and the sample is loaded to the needle tip by repetitive movement of the needle probe. This method has been previously used for the analysis of sample with high salt concentration and real-world samples without sample pretreatment. Although PESI is also applicable to aqueous solution, the ion signal stability and reproducibility were not satisfactory due to the spontaneous occurrence of corona discharge taking place on the metallic needle tip. In the previous version of PESI, the ionization was performed under an open environment, thus ambient condition such as humidity and the presence of environmental contaminant also affected the performance of PESI. In this chapter, we report a modified version of PESI in which the electrospray and the desolvation of charged droplets were performed inside an enclosed chamber which was pressurized to > 1atm with dry air. Under a super atmospheric condition, the dielectric strength of the ambient gas was enhanced and stable electrospray could to be initiated without the occurrence of corona discharge even for liquid sample with high surface tension such as pure water. A comparative study of atmospheric pressure PESI and high pressure PESI (HP-PESI) was performed to demonstrate the improvement of PESI in sensitivity and signal stability for the detection analytes in aqueous solution.
28
3.1.2 Introduction
Electrospray ionization is conventionally performed by pumping the sample solution through a metallic capillary held at high potential5,41. Besides the standard way, there also exist several ESI based techniques. For example, non-analyte containing electrospray plume can be mixed with volatile gaseous sample or non-volatile samples aerosol, and ions can be formed by gaseous charge transfer or, if the analytes are re-dissolved into the charged droplets, the analyte ions are formed by ion evaporation or charge residue mechanism of ESI process42,43,44,45,46. With pneumatic assistance, high speed jet of charged droplets can also be impinged onto solid surface to carry away the dissolved compounds for subsequent ionization47. Besides capillary, electrospray can also be generated from solid ESI emitters,48,49,50,24,51 porous material such as paper, or even from the specimen itself.52,53
This chapter is concerned about the further development of probe electrospray ionization (PESI) source which was initially reported in 200724,51. In this method, a solid needle probe is actuated along a vertical axis near the ion-inlet of the mass spectrometer, and liquid or wet sample which is repeatedly loaded onto the needle is electrosprayed when a high voltage of ~2kV is applied to the needle. The mechanism of PESI is the same as ESI where the strong electric field causes the adhered droplet to move toward the needle tip, and disperse the liquid into small and highly charged droplets.54Analytes ions are desorbed and transferred into atmosphere as the solvent of the charged droplets evaporates. Because solid needle is used instead of capillary, this method is completely free from clogging problem, and the cleaning of the ESI emitter is much easier. By optimizing the size and the material of the needle probe, PESI has also been demonstrated to be more tolerant to high concentration of salts and detergents present in the sample solution.15,55 With the use of auxiliary solvent supply, direct measurements of relatively dry sample or living animal are also possible.56,57 Recently, by concentrating all the adhered liquid into one droplet on the needle tip, a slow but sequential electrospraying of different analytes according to their hydrophobicity has also be observed.16
Because a sharp solid needle is at the same time a good corona discharge emitter, in certain case such as the electrospray of aqueous solution with high surface tension, the stability of electrospray and reproducibility of ion signal are not satisfactory, particularly in the negative ion mode where the gaseous breakdown is more prone to occur. The problem arises when the electric potential which is necessary to establish a stable electrospray becomes higher than the onset of corona discharge or arc discharge. The corona discharge
29
affects the electric field near the needle tip and degrades the performance of ESI. This corona discharge problem can be avoided by using a mixture of aqueous and organic solvents like those used in the standard ESI ion source to reduce to surface tension, and hence the onset potential of electrospray. However, in certain cases such as the analysis of native protein, it is desirable to achieve efficient ESI for aqueous solution in both positive and negative ion mode operations.
Besides using electron scavenging gases such as SF6,58 increasing the pressure of the
gas that surrounds the electrodes has long been known to increase the threshold potential for inducing the gaseous breakdown.18 We have recently utilized this feature in a conventional electrospray ion source and coupled the high pressure ion source to a commercial mass spectrometer. Besides increasing the dielectric strength of the working gas, higher collision frequency between the charge droplets and the gas molecules under a higher pressure condition is also beneficial for the desolvation of charged droplets.19,20
In this work, we had constructed a new prototype of PESI in which the needle probe and the sample holders are located inside an enclosed high pressure vessel in order to combine the benefits of PESI and high pressure ion source. Also under an enclosed environment, PESI ionization process would also be less susceptible to the environmental factor such as humidity, and the environmental contaminants.
3.1.3 Experimental
3.1.3.1 Mass spectrometer
The experiments were performed using a linear ion trap mass spectrometer (LTQ-Velos, Thermo Fisher Scientific, San Jose, CA). The settings for the MS instrument were as follow: capillary temperature was300~400°C, magnitude for S-lens was 80%, auto gain control was enabled with maximum ion injection time of 10 ms, and the number of micro scan was 5.The pressure in the first pumping stage was 1.95Torr. The original ion transport capillary was substituted with a set of custom made stainless steel ion transport capillaries. These capillaries are slightly longer (~7cm) and the inlet could protrude into the ion source chamber to sample the ion rich gas. There were two different inner diameters (i.d.) for these ion transport capillaries. One was 0.25 mm and another one was 0.5 mm. With the capillary of 0.25 mm inner diameter, the high pressure ion source could be coupled directly to the LTQ without any modification on the vacuum pumping system, and the pressure in the first
30
pumping stage would reach to a normal level when the ion source was pressurized to 4 bars (~4 atm). For the case when the capillary of 0.5 mm was used, an additional pumping system which was consisted of a Roots booster pump (connected in between the pump port of the LTQ and the original rotary vane pump) was necessary to keep the pressure of the first vacuum chamber under 1.95 Torr. The three phase A.C. motor of the booster pump was controlled by a variable frequency controller (VF-AS1, Toshiba Schneider Inverter, Japan) to adjust the pumping speed.
3.1.3.2 High pressure probe electrospray ion source
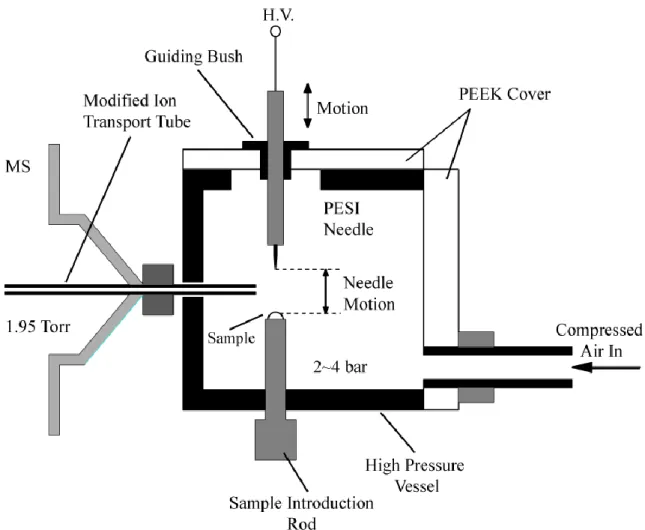
The schematic of the high pressure PESI ion source is shown in Figure 12., and photographs showing the set-up of the experiment are depicted in Figure 13. The PESI emitter and the sample holder were housed inside a high pressure vessel made of aluminum alloy. The PESI needle probe was mounted to a stainless steel shaft and the movement of PESI needle was controlled by a linear actuator (SCN5, Dyadic Systems, Ishikawa, Japan) located outside the ion source chamber. The PESI ion source chamber was pressurized to 2~4 bars with dry air supplied from an air compressor (Anest Iwata, Yokohama, Japan). The gap between the shaft and the guiding bush is small enough that the leak was negligible. The high pressure chamber also had two view port made of polycarbonate disc for the inspection and alignment of needle probe. Two insulating covers were made of polyether ether ketone (PEEK).
31
Figure 12. Schematic diagram of the high pressure probe electrospray ion source. The ion
source was pressurized with dry air to 2~4 bars. A Roots pump with variable pumping speed was introduced in the pumping system to keep the first pumping stage of the mass spectrometer at 1.95 Torr regardless of the ion source pressure. The PESI solid needle probe was mounted to a metallic shaft which was moved along a vertical axis close to the ion sampling inlet. The horizontal and vertical distance between the needle tip and the ion sampling inlet were 3~5 mm and 2~3 mm, respectively, when the needle was at the highest position. The position of the sample was adjusted with the sample introduction rod so that the tip of the needle just touched on the liquid surface when the needle was at the lowest position.
32
Figure 13. Photographs showing a) arrangement of the high pressure PESI ion source, b)
close-up of the inside of the ion source chamber, and c) custom made ion transport capillary used in the experiment. d) Plot for the magnitude of the threshold voltage for inducing corona discharge versus ion source pressure for positive (open circle) and negative (solid square) ion modes. For aqueous solution, the optimum needle potential to generate stable ion signal by PESI was 2.7~3 kV. 1 bar 1 atm.
33
The general operating procedures of PESI were similar to those described in our previous report. In brief, the needle was moved up and down along a vertical axis at a repetitive frequency of 3 Hz. The height of the sample holder was adjusted so that the tip of the needle just to touch the surface of the sample when it is at the bottom position. When the needle was moved up and reaches the highest position, a high voltage of about 2-2.5 kV was applied to the needle. The vertical and horizontal distances between the needle tip and the ion inlet when the needle was at the highest position were 2~3 mm and 3~5 mm, respectively.
Disposable acupuncture needles (Seirin, Shizuoka, Japan) with sub-micrometer tip diameter were used as electrospray emitters throughout the PESI-MS experiment. The geometrical shapes of the needles were found to be almost identical, and all were of sub-micrometer size. The sterilized needles were hermetically sealed when purchased and was used directly without any further washing. New needle was used in each measurement to avoid the possibility of cross contamination.
3.1.3.3 Sample preparation
Ammonium acetate, trifluoro-acetic acid (TFA) and proteins (bovine insulin, bovine cytochrome c, ubiquitin, myoglobin and lysozyme) were purchased from Sigma- Aldrich. All samples were used without further purification. The primary stock solution of bovine insulin was prepared with 0.1 % TFA in aqueous solution, and was diluted with pure water and MeOH/H2O (1:1) to 106 M. Stock solutions of protein samples were initially prepared with
pure water and were diluted with 100 mM ammonium acetate aqueous solution. Pure water was prepared using Simplicity UV (Millipore, Bedford, MA).
3.1.4 Results and discussion
3.1.4.1 Comparison of HP-PESI and PESI
Figure 14 shows a comparison of high pressure PESI (HP-PESI) and normal PESI (which was operated at one atmospheric pressure) with bovine insulin dissolved in pure water as the test sample. Pure water has high surface tension, and this sample was also difficult to be handled with conventional ESI if sheath gas and sheath liquid assistance were not used. In this measurement, both HP-PESI and PESI were performed using the same ion source chamber and the same PESI needle and sample. Most of the experimental conditions such as the needle alignment and the settings for MS instrument were the same, except the type of ion transport capillary used. For HP-PESI, the i.d. for the ion transfer capillary was 0.25 mm, and for PESI, the i.d. was 0.5 mm. No ion could be detected with 0.25 i.d. capillary when the ion source was not pressurized to > 2 bars.
34
Figure 14. a)-d) Positive and negative HP-PESI and PESI mass spectra for 10-6 M insulin prepared in pure water. All peaks are originated from the protonated ([M+nH]n+) and deprotonated ([M-nH] ) species of insulin. For HP-PESI, the absolute pressure of the ion source was 5 bar, and the inner diameter of the ion transport capillary was 0.25 mm. For PESI, the inner diameter of the capillary was 0.5 mm. The applied potential to the needle was optimized at around 2.7 kV. The temperature of the ion transfer tube was400 °C for both cases.
Figure 14.a&c show that peak intensities of the insulin ion signal acquired with HP-PESI were much higher than those of HP-PESI even though the inner diameter of the ion transport capillary was smaller. The operating pressure in Figure 14.a was 4 bars. At this pressure, there was nearly no occurrence of corona discharge for needle potential below 5kV. This allows us to apply several hundred volts higher than the onset potential of electrospray for signal optimization. Besides higher signal intensity, the ion signal stability and reproducibility of mass spectra for HP-PESI were better than atmospheric pressure PESI. Also for PESI, occasional retuning of needle potential was necessary when the gaseous breakdown spontaneously takes place, and the needle potential needed to be reduced to <1kV
35
to quench the discharge. This indicates that the threshold for the corona discharge was only slightly higher than the onset of ESI in the positive ion mode. In the case of negative ion mode as shown in Figure 14.c&d, no insulin ion could be detected with normal PESI because the threshold potential that induces the gaseous breakdown was lower than the onset of stable electrospray. For HP-PESI, the tuning for the high voltage to get an optimize ion signal was much easier, and it could handle the aqueous solutions more efficiently with good mass spectral quality.
In another measurement as shown in Figure 15., ionization efficiency and ion transmission for HP-PESI and PESI were compared using the same ion transfer capillary with inner diameter of 0.5mm. Here, an additional Roots booster pump was installed in the pumping system and the pumping speed in the first stage of the mass spectrometer could be adjusted from 500 to ~3160 L/min by varying the rotation speed of the driving motor. The pressure in the first pumping stage of LTQ was kept at 1.95 Torr for both HP-PESI and PESI operation. The sample used here was 10-6 M insulin in methanol/water 1:1. The organic solvent mixture was used so that the performance of HP-PESI and normal PESI could be made in the condition that both were free from corona discharge problem. With the use of organic solvent, insulin ion signal could also be detected with PESI in negative mode, but overall, the performance of HP-PESI was still superior to PESI in term of peak intensities and spectral quality. This could be due to a better desolvation and a higher intake of ion rich gas under a higher pressure condition.
36
Figure 15. a)-d) Positive and negative HP-PESI and PESI mass spectra for 10-6 M insulin prepared in MeOH/H2O (1:1 v/v). Same ion transfer tube with inner diameter 0.5 mm was
used for both cases. High potential applied to the needle was 2.0 kV. For HP-PESI, the ion source pressure was 3 bar and the pressure in the first pumping stage was kept at 1.95 Torr by increasing the pumping speed of the additional Roots booster pump.
37
Figure 16. Positive HP-PESI MS spectra of a) myoglobin, b) cytochrome c, c) lysozyme, and
d) ubiquitin, each of 10-6 M prepared in 100 mM ammonium acetate (NH4Ac) aqueous
solution. The ion transport capillary with 0.25 mm i.d. was used and the operation pressure of the ion source was 5 bar. The temperature of the ion transfer capillary was 150 C.
38
3.1.4.2 Detection of native proteins
The ability of HP-PESI to handle aqueous solution easily is useful for the analysis of native proteins. Figure 16. shows the HP-PESI mass spectra of four protein samples: myoglobin, cytochrome C, lysozyme, and ubiquitin, which were prepared in 100 mM of ammonium acetate to keep the native conformation of protein in the solution phase. Positive ion mass spectra are shown here because according to the study by Konermann and Douglas, only positive-ion spectra could provide a reasonable charge stage distribution that reflects the protein shapes in solution.
As shown in Figure 16.a-c, with the use of ammonium acetate buffer, the major peaks in the mass spectra have a narrower charge-state distribution and with lower charge states compared to the case where acidic and organic solvent mixtures are used, owing to a small number of basic sites which are available on the outer surface of the folded protein molecule. For ubiquitin, in addition to the dominant peaks of lower charge states (5+ to 7+), a series of lower abundance peaks with higher charge states (8+ to 11+) were also observed. This distribution had also been found in other previous study of native ubiquitin,59,60,61,62 and it was attributed to the presence of two populations of conformers, a tightly folded one, and another less tightly folded one, in the protein solution.60,61
3.1.5 Conclusion
High pressure probe electrospray ionization mass spectrometry with operating pressure of higher than the atmospheric pressure has been demonstrated on a commercial mass spectrometer. Gaseous breakdown that leads to the corona discharge or arc discharge could be quenched using pressurized air as the working gas and this feature allowed HP-PESI to deal with aqueous sample solution more easily than the atmospheric pressure PESI. Even with the use of organic solvent, HP-PESI offers a higher sensitivity and signal stability over PESI possibly owing to better desolvation and higher ion sampling rate by the mass spectrometer.
39
Chapter 4
4.1 High pressure nano electrospray ionization mass
spectrometry for analysis of aqueous solution
4.1.1 Abstract
Nano electrospray ionization (nanoESI) with a very fine emitter and nano liter solution flow rate is known to work with aqueous solution. However, under atmospheric pressure, its stability with aqueous solution is not always guaranteed particularly in the negative ion mode where corona and arc discharge tend to occur more easily. Electrical discharge can be quenched to certain extent by adding electron scavenging gases like SF6 or CO2 to the ion
source. The onset potential that is required to induce the discharge also increases with the rise of gas pressure. Recently, we have reported a series of high pressure electrospray ion sources that could work stably in both positive and negative ion modes using air or N2 as working gas.
In this chapter, we compare the performance of nano electrospray under atmospheric pressure and super-atmospheric pressure for the analysis of samples in aqueous solution. The comparative study was performed using the same ion source chamber that could be pressurized up to 6 bar. The pressure in the first pumping stage of the mass spectrometer was kept constant when the ion source pressure was changed by using an additional pump with variable pumping speed. High pressure nanoESI optimized at 2~3 bar demonstrated a 3~5 times improvement in ion signal intensity compared to atmospheric pressure (AP) nanoESI, and the signal stability was significantly improved particularly in the negative mode.
40
4.1.2 Introduction
Nano electrospray ionization source with a very fine capillary emitter that operates at several tens nanoliter per min solution flow rate was developed and theoretically described by Wilm and Mann.14,13 In their theoretical model, they treated the electrospray in analogy to the electro dispersion of liquid metal ion source, and derived a relationship between the size of the emitted droplet and the solution flow rate.14 Smaller charged droplet produced under nanoliter flow rate regime has higher surface to volume ratio, and that increases the proportion of analyte that can be ionized by ESI. Owing to this reason, the nanoESI is more tolerant to the presence of matrix or buffer salts which usually cause the ion suppression in the conventional ESI.13,63 The term nano electrospray ionization was initially coined for ESI with < 100 nl/min flow rate to mark the difference with other existing micro electrospray sources.64,65 Despite some controversies, this term is also used nowadays by some researchers for the ESI with < 1 L/min flow rate.66 Early nanoESI practitioners used to hand made their own capillary emitters by glass pulling. Owing to its popularity, online or disposable offline nanoESI emitters are now available commercially. While standard pneumatic-assisted electrospray that operates at > 1 L/min is widely used for routine analysis like LC/MS, nanoESI is generally a preferred choice in the proteomic research to handle precious samples which are extremely limited in quantity and concentration. When the sample is properly loaded and electrospray is stably initiated, it can produce long lasting ion signal, which is beneficial for tandem mass spectrometry.
Analysis of aqueous samples such as native protein and DNA is important for biological study. However, the pure aqueous sample is notoriously difficult to handle with conventional electrospray due to its high surface tension. The onset potential for stable electrospray depends on the surface tension of liquid,67,68 and for pure water or aqueous solution, it requires higher potential for the onset of stable electrospray compared to that for organic solvent. Depending on the emitter geometry and ambient environment, if the onset potential for ESI is higher than the threshold that triggers the gaseous breakdown, corona or arc discharge can take place first before the initialization of stable ESI. The corona or arc discharge seriously affects the electric field near the ESI emitter and degrades the performance of electrospray ionization. A common practice to circumvent this problem is to add organic solvent (like methanol or acetonitrile) to the sample solution to reduce its surface tension and hence, the onset potential for electrospray. In the case where organic solvent is not desirable, pneumatic-assisted ESI like ion spray,69 or electrosonicspray,11 are the
41
alternatives. Because the droplet in these sprayers is formed by breaking the liquid with fast flowing gas, they are not charged up to the Rayleigh limit, and the initial charged droplet ought to carry less charge compared to that of pure electrospray. It has been demonstrated by Chowdhury and Chait that by using a sharp metallic emitter with 150 m in inner diameter, electrospray of pure aqueous solution could be achieved in the positive ion mode without any pneumatic or sheath flow assistance.70 For a sharp emitter, the generated electric field becomes more concentrated at the emitter’s tip where the liquid emerges, and although the onset potentials for electrospray and corona discharge are both reduced with smaller tip diameter, the inhomogeneous electric field can provide a chance for the onset of ESI to drop faster than that of corona discharge. Emitter used for nanoESI is much sharper and its inner diameter is of the order of 1~10 m, and it is also known to work with aqueous solution.
Recently, we have reported a series of super atmospheric pressure ion sources using electrospray,20,19 probe electrospray,36 field desorption,39 and APCI.40 In the cases of electrospray and field desorption, the high pressure condition increased the dielectric strength of the ambient gas,71 and this enabled a stable ion production in both positive and negative ion modes using air or N2 as working gas. The approach was different from those using
electron scavenging gas like SF6,58,72 and it added more gas molecules into the ion source for
the desolvation process. In this chapter, we compare the performance of nanoESI under standard atmospheric pressure and super-atmospheric pressure for the analysis of samples in aqueous solution.
4.1.3 Experimental
4.1.3.1 Mass spectrometer
The experiment was performed using commercial linear ion trap mass spectrometers (LTQ-Velos, Thermo Fisher Scientific, San Jose, CA). LTQ-Velos is a recently released linear ion trap from Thermo Fisher Scientific in which the length of the ion transport capillary (~6 cm) is nearly half of that used in the previous version, and a focusing stacked ring ion guide (S-lens) is employed instead of a standard inlet-skimmer arrangement. This focusing ion guide is somewhat different from Smith’s ion funnel in such a way that ring electrodes with same inner diameter are progressively spaced rather than with progressively reduced inner diameters.73The instrumental settings for the mass spectrometer were as follow: temperature for the ion transport tube was150~200 °C, magnitude for S-lens was 80%, and magnitude for the RF ion guide was 800V. Auto gain control was enabled with maximum ion injection time