〈Articles〉Is Health Care a Necessity for the Elderly in Japan ?
13
0
0
全文
(2) 第2巻. 1.. The current creasing. demographic. life expectancy. a severe strain population.. 第2・3号. Introduction. transition. includes. has been continued. on public. finances. According. declining. in Japan.. tal public expenditures. associated. with aging. burden. (Economic. are expected. GDP over the next five decades.. The main. the rise in expenditures. care and long term care.. taxes. on health. and contributions. to social insurance. rise to intergenerational From whether. component. and in-. will create. on the working. Outlook,. No. 69), to-. to rise by 3 percent. of these expenses The resulting. by the young. generation. of. will be hikes in. could give. inequalities.. the viewpoint. of resource. the characteristics. a necessity. rates. The transition. and raise the economic. to 2001 OECD projections. fertility. allocation,. of health. or a luxury.. therefore,. care expenditures. If the magnitude. it should. be discussed. for the elderly. of income elasticity. make them. exceeds one, health. care is a luxury. Can health luxury that. at the country income. cross-national of health. elasticity estimate. However,. the nation's. Because. and health aggregated. is small. to increases analysis. and market. by Newhouse within-country,. care is largely. response in income. is important. levels and a. (1977) revealed and. that. the. as a whole faces the full costs financed. data such as national. do not necessarily. the individual's. in an empirical. care. study. exceeds one since the nation. highly. response. at the individual. A pioneering. of health. care expenditures. al. 1987).. vation. level ?. care consumption. country.(1) health. care be both a necessity. imply individual to increases. by the state or the income or national behavior. (Parkin. in income differs. et. from. (see Getzen 2000), the level of obserin this matter.(2). (1) It is known that in contrast with time-series studies, cross-section analysis commonly produces estimates of income elasticity of less than one. Cross-section estimates may have been misspecified because of omitted variables (McGuire et al. 1993). In the meantime, to avoid complicated calculations, the variance of income elasticity as a function of both a constant and the slope of a regression equation allows an approximation (Parkin et al. 1987). (2) Getzen (2000) notes that symptoms of illness and pain are often more important reasons for individuals to seek out a doctor, while available health care resources and technologies at the national level often reflect the nation's economic well-being. — 20 ( 268 )—.
(3) Is Health Care a Necessity for the Elderly in Japan ? (Kumagai) On the other short-Tun. hand, most estimates. in previous works. in nature since there has been no long-run. ables in the estimation function. terpretation,. the estimate. among non-stationary. relationship. among vari-. In order to provide a more accurate economic in-. should be constructed. variables. can be considered. as a stationary. relationship. (Kumagai 2000, Kumagai and Ginama 2001) .(3). The purpose of this study is to reconsider whether health care is a necessity or a luxury. at the macro. The implications. level in Japan.. of estimating. The paper is organized. the income elasticity. as follows.. of health care expenditures. are presented in Section 2. Section 3 shows a data set by age group of household heads in Japan, and health care functions the elderly.. are estimated using quarterly. In this section, the representative. individual's. income with regards to the changes in out-of-pocket. data of. response to increased. payments is discussed . Fi-. nally, we make some concluding remarks in Section 4.. 2.. Income. Elasticity. The relationships. between. of Health. health. care. Care. Expenditures. expenditures,. the. representative. individual's health status,. the provider behavior of the health sector and the ex-. tent of income distribution. can be analyzed by investigating. health care expenditures. using aggregated. the characteristics. data (Newhouse 1977) . If the magni-. tude of estimated income elasticity exceeds one, health care is interpreted a luxury.. The fact that the elasticity. is greater. It is necessary to investigate,. find an appropriate. out-of-pocket. as being. than one by aggregated. means that increases in total health care expenditures income.. of. data. tend to grow faster than. on the demand side, the matters of how to. rate, and how to sustain the national health in-. surance system.(4) (3) Recent articles have focused on non—stationarity and cointegration of health care expenditures and GDP using panel data for OECD countries (Hansen and King 1996, Blomqvist and Carter 1997,McCoskey and Selden 1998,Gerdtham and Lothgren 2000, Clementeet al. 2004). (4) Income differences and health status usually imply better or worse insurance coverage and larger or smaller health care premiums on an individual basis in a private system. On the contrary, this is not usually the case in public health care systems based on the social insurance model. — 21 ( 269 ).
(4) On the supply side, an excess supply of medicine and increases in charges for medical tests must be examined.. It is considered that health care is a necessity. when the elasticity. is positive but less than one.. quality. services and the diffusion. of health. Matters of health. such as improving the technologies. must be. analyzed.(5). 3.. Empirical. In this section, first, the transition on the elderly is summarized.. in the amount of health care expenditures. Second, a data set arranged by age group of house-. hold heads in Japan is presented.. Third, we estimate health care functions. discuss changes in the representative with regards to out-of-pocket. 3-1.. Analyses. individual's. and. response to increased income. expenses.. General Medical Care of the Elderly. Descriptive statistics. on General Medical Care for persons 65 years and over. in Japan are presented in Table 1. It is clear that the amounts of both outpatients and inpatients. dramatically. increased in the 1990s. It can be considered. that the increases were mainly caused by demographic tence of a supplier-induced. demand in the framework. changes and by the exisof a fee-for-service. system.. The latter is conjectured from observed values of per capita variables in Table 1. The sample period of the regression analysis that follows ends in 1999. The coverage of individuals by national medical care expenditure troduction. changed with the in-. of public long term care insurance in 2000. To expand the sample pe-. riod, we would need to broaden the sense of health care expenditures conventional. long term care services.. to include. This work will be conducted in a future. study.. (5) Blomqvistand Carter (1997)findthat 11income elasticities are either less than one or close to one using a large set of countries over time, in which cases the null hypothesis that the incomeelasticity equaled one could not be ruled out. — 22 ( 270 )—.
(5) Is Health Care a Necessity for the Elderly in Japan ? (Kumagai) Table 1. Comparison of Medical Care Expenditures of the Elderly FYAmounts. (1000. 1990 19996408.2 Inpatient155.3, 1990 1999 Outpatient5726.6. Per Capita 1999/1990 (%) (1000 yen) Amounts, Per Capita 276.4 302.5 109.4 223.2 270.3171.8, 121.1. million yen) 4126.0 3332.1. Sources : General Medical Care Expenditures of 65 years and over (National Medical Care Expenditures). 3-2.. Data by Age Groups. Following. Masubuchi. heads were as follows.. income of households. data of both worker's of households. households. series of income per month. puted. services. of owner-occupied. of the elderly a quarterly. To control health. of persons. generation. The number. of the calculation.. Second,. the. data,. add-. for annual. with. surplus. elderly. income of persons. from the series of total aged 60 years. to the young. shifts,. of. (im-. persons).. aged 60 years. with 93SNA, we had the series of dispos-. series of the disposable. for demographic. average. households.. of households. the se-. was derived from. care and (b) operating. income as the disposable. income. the weighted. appropriately. medical. Since the series were linked. and the disposable. estimates,. parameter. of arranging. per month. "no occupation". dwellings. generation. First,. persons. was transformed. able income of the working. ratio. and. income (a) old-age. We could use aggregated and over.. with elderly. was used as the weight. ing to the annual. Characteristics. (2000), the steps in the procedure. ries of income of household disposable. and Their. and over.. generation. disposable Finally,. regarding. income using. annual. the. income. income of the elderly was calculated.. income per capita. was used to estimate. the. care function.. The calculation of the series. of income.0. was transformed nual health. of health. to annual. care expenditure. care expenditures. First, data.. of the elderly. the series of health After old-age. of senior population,. was similar. care expenditure. medical. to that. per month. care was added to the an-. a quarterly. series of health. care. (6) Medicines, medical fees and medical appliances such a manometer are included in medical care. Health care expenditures of the elderly might be underestimated because the series is based on health care expenditures by the age group 60 to 64 years old. — 23 ( 271 )—.
(6) expenditures was calculated.. The relative price of health care is the ratio of medi-. cal care costs to the deflator of private consumption. used to capture changes in the cost-sharing. A dummy variable was. rule of public health insurance in Sep-. tember 1997. The main changes were that the coinsurance rate of employees was raised from 10 percent to 20 percent and the deductible paid by the elderly was successively increased. The health care expenditures of the senior population are financed in a scheme called Health Services for the Aged (HSA, Rojin-hoken-seido).. It is well known. that one of the major causes for the financial difficulty for health insurers is their Contribution utsukin),. to the Health Services for the Elderly (CHSE, Rojin-hoken-kyosy-. which is imposed on insurers to finance the health care expenditures. the elderly.. of. The ratio of elderly, therefore, is used as a proxy variable of the ex-. tent of financial burden on workers.. The definitions and descriptive statistics. of. variables for this study are presented in Table 2. As the result of Dickey-Fuller. tests for unit roots (Dickey and Fuller 1979) ,. the unit root hypothesis was not rejected at 5 percent significance level for any. Table 2. Definition and Descriptive Statistics of Variables. ariables l nipr lnmepr rp raged. Definition. Sample : 1991: 1-1999 : 4 Standard V Mean Deviation. Real income per In (income per' capita of the elderly) 1.64 capita Real health care expenditure In (medical care per capita of the elderly) 3.67 per capita Relative price (the deflator of medical care/ 99.83 of health care the deflator of private consumption) x 100 Ratio of the the population of the aged 60 and over/ 0.20 elderly total population. dum97Q4 Dummy variable. 1997: 4-1999 : 4=1, the other. 0.25. 0,038 0.083 1.811 0.015 0.439. Number of Observations=36, Base year is CY 1995. Sources : Income of persons aged 60 years and over and health care expenditures by the age group 60 to 64 years old, Annual Report on the Family Income and Expenditure Survey ; relative price of medical care, System of National Accounts. — 24 ( 272 )—.
(7) Is Health Care a Necessity for the Elderly in Japan ? (Kumagai) variable in Table 2 except the dummy variable.. Continuing. with the tests, the. unit root hypothesis was rejected at the 1 percent significance level for the first difference series of those variables. variables are integrated. 3-3.. Therefore, we can consider that all stochastic. with an order of one.. Methodology. The absence of a stationary run relation. linear combination. implies that there is no long-. among the variables, so that these variables may drift away from. each other over time.. In addition to representing. necessary to represent any short-run employ a cointegration. interactions. the long-run relationship, among the variables.. model as vector autoregressions. it is. Thus, we. involving variables in dif-. ferenced form in the following : Let z, be the n x 1 vector of time series in the model and )8 of stationary. linear combinations.. Then the variables. be the r number. in the system are con-. nected by the set of n dynamic equations : p -1. AZt=+"'"71~ja-1 7-. +1.1,(1). represents n Xn coefficient matrices, ,a is a vector of constants, r matrix of adjustment parameters,. j3 is the n x r matrix and u, is an n x 1 vector of. white noise error processes in equation determined,. the corresponding. of the r cointegrating tegrating. a is an n X. 1. Once the cointegrating. maximum likelihood estimates. equations are contained in the matrix. relation is found, the parameters. rank has been. of the parameters. 13. If only one coin-. of this equation are unique up to a fac-. tor of proportionality. Johansen's integrating. method (Johansen. relationships. 1988, 1992, 1995) was adopted to test for the co-. among variables.. The number of cointegrating. rela-. tionships and the problem of whether an intercept and/or trend terms should be considered can be simultaneously. treated in this method.. If the null of no cointe-. gration is rejected for the model tested, then the number of cointegration is also determined.. As Engle and Granger. (1987) showed, in the case of p vari-. ables system, the maximum number of cointegration -. vectors. 25 ( 273 )—. vectors is p -1.. If the esti-.
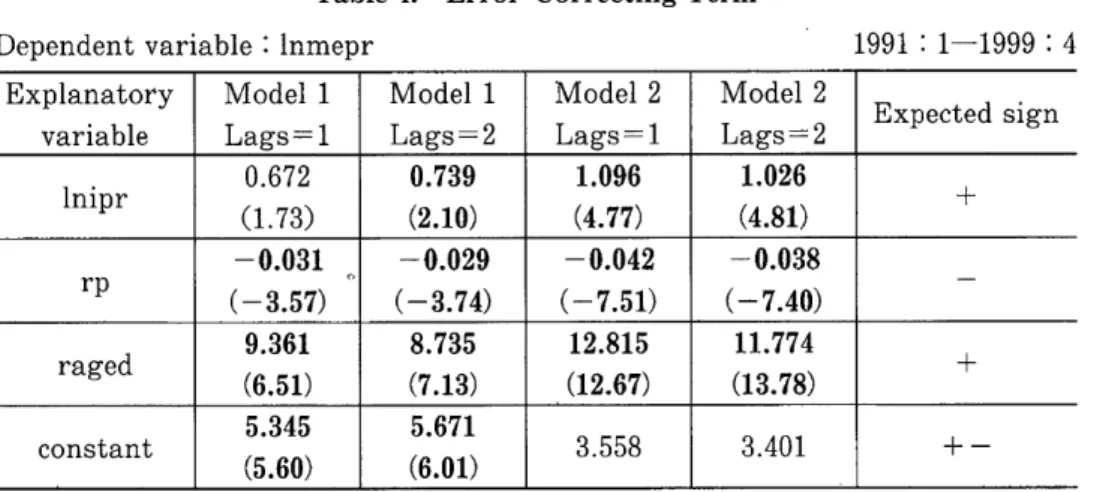
(8) mated. error. correcting. test, statistical. term satisfies. interpretation. The null hypothesis pothesis. Empirical. As a result. The results. tested.. [1] lnmepr,. of cointegration. is given to the term .. number. hy-. of cointegration. respectively. test, one cointegrating. The variables. vec-. .. that. relationship. constituted. was found. combinations. lnipr,. rp, raged [2] lnmepr , lnipr, rp, raged,. tests. are shown in Table 3 .. to be an exogenous. change in out-of-pocket. payments. constant. dum97q4.. Since the dummy. , the effect. on the cointegrating. were. vari-. of an institutional. relationships. was not con-. in this test.. The results. of the estimation. function. are presented. whether. changes. As a result,. in Table 4.. in out-of-pocket. the estimate. variable. of the error-correcting It is noted payments. in the vector error. significant,. of income elasticity can be concluded that effect of changes. that. correction. model.. one when there. in out-of-pocket. the representative. payments. individual's. The dummy. rung). response. difference. variable. for changes However,. or not . is a. is stain rela-. the estimate. variable .. care expenditures. in the short. care. than one when there. is no dummy. of health. a great. into consideration. is negative. in the short. the characteristics. it makes. is greater. and the sign of the variable. is less than. term of the health. are taken. of income elasticity. tive price and in the ratio of the elderly. declare. of the. test is Ho : r<k ; the alternative. in the system,. of the cointegration. able was assumed. tistically. as a result. Results. as the following:. dummy. equilibrium. of the cointegration. of variables. for each combination. sidered. of the long-run. condition. is H1 : r> k, where r and k are the maximum. tors and the number. 3-4.. the stationary. Thus, it. depend on the. run ; however , we cannot. to structural. changes. in payment. in the long run. We can also infer that fects the relationship. among. the difference variables. of lags in the specification. in the error-correcting. slightly. af-. term in Table 4, but. (7) For the dependent variable, the difference in rp, the coefficient of durn97q4, is around —0.8. This means that a rise in out-of-pocket lessens the increase in relative price of health care. — 26 ( 274 )—.
(9) Is Health Care a Necessity for the Elderly in Japan ? (Kumagai) Table 3. Cointegration Tests No deterministic trend in the data for Model 1 Linear deterministic trend in the data for Model 2 1991: 1-1999 : 4 Ei Likelihood 5 Percent 1 Percent Hypothesized genvalue ratio Critical Value Critical Value Number of CE (s) Model 1 0.72 74.27 53.12 60.16 None** Lags =1 0.33 27.45 34.91 41.07 At most 1 Model 1 0.74 80.70 53.12 60.16 None** Lags=2 0.39 31.65 34.91 41.07 At most 1 Model 2 0.65 55.16 47.21 54.46 None** Lags=1 0.25 17.20 29.68 35.65 At most 1 Model 2 0.70 67.02 47.21 54.46 None** Lags =2 0.30 23.21 29.68 35.65 At most 1 Note:Two asterisks denote rejection of the hypothesis at the 1 percent significance level. there is little difference regarding the coefficients. the value of AIC and SBC for the models.o. except one variable. All. in the case of Model 1 are statistically. significant. Table 5 shows the adjustment represents. coefficient of the error-correcting. no error correction if all of the adjustment. lowing Johansen. term, which. coefficients are zero.. (2002), we checked whether the adjustment. Fol-. coefficients derived. from such small samples have a reasonable size by using the correction factor to the test for a linear hypothesis in a cointegrated a result, we confirmed that the adjustment of adequate size.0 role of adjusting contrary,. model.. As. coefficients in bold type in Table 5 are. It can be argued that the relative price in Model 2 plays the short-run. the relative. interactions.. vector autoregressive. interactions. among the variables in Table 5. On the. price in Model 1 does not result. It seems that the difference in the estimate. in adjustments. of. is caused by the exis-. tence of the dummy variable in the short-run. It is noteworthy and statistically. that all the coefficients of the ratio of elderly are positive. significant.. elderly should be reconstructed. A scheme to finance health care expenditures. of the. if the result indicates that the determination. of. (8) For example, AIC of Modell are -24.59 and -23.89. (9) Podivinsky (1998) pointed out the problem that using asymptotic critical values can be misleading for sample sizes of 100or smaller and that linear restrictions against Johansen's test would seem to result in a strategy most likely to detect true cointegrating relationships in moderately sized samples. -. 27 ( 275 )-.
(10) •. whether. such. health. of contributions. care. to social. expenditure insurance. by the. Table 4. Dependent. variable. Explanatory variable lni0.672 pr. ra9.361 ged. Error-Correcting. depends. 1991 : 1-1999 Model 1. Model 2. Model 2. Lags =2. Lags =1. Lags= 2. 0.739 (2.10). 1.096 (4.77). 1.026 (4.81). .73). .51). 5.345 (5 .60). the. -0.029. -0.042. -0.038. (-3.74). (-7.51). (-7.40). 12.815 (12.67). 11.774 (13.78). 8.735 (7.13) 5.671 (601)3.558. extent. Term. Lags =1 (1. upon. generation.00. Model 1. (6. constant. working. or not. : lnmepr. -0 .031 (-3 .57). rp. is a luxury. E. :4. xpected sign. 3.401. + -. Note : All explanatory variables are current time period values. The T-values of the coefficients are presented in parentheses. The constant terms of Model 2 are arbitrary ones.. Table 5. Adjustment Coefficient of Error Correcting Term Model 1 : the model for lnmepr, lnipr, rp, raged Model 2 : the model for lnmepr, lnipr, rp, raged, dum97q4 V. ector autoregression l. nmepr l. nipr rp. raged. Model 1 L ags =1 0.025 (0 .57) 0.036 (0 .62) -1 .377 ( -0 .56) -0 .001 ( -7 .31). Model 1 Lags =2 0.027 (0.45) -0.068 (-0.88) -2.160 (-0.68) -0.001 (-6.28). 1991 : 1-1999 : 4. Model 2 Lags =1 0.145 (1.57) 0.272 (2.31) -13.503 (-2.96) -0.001 (-2.67). Model 2 Lags =2 0.140 (1.23) 0.269 (1.94) -14.138 (-2.57) -0.001 (-3.25). Note : The T-values of the coefficients are presented in parentheses.. (10) The other key factor to sustaining the social insurance system is the elimination of behaviors that are harmful to health. Kumagai (2004) revealed that, for the elderly, quitting smoking is important in shrinking health care expenditures in the long run. He presents a 2-step calculation that if the smoking rate of males would decreased by 3 percent (while the smoking rate of females remained constant), the risk of the elderly based on their lifestyle would decrease by 1 percent and the health care expenditures of the elderly would be reduced by 10 thousand yen per capita. -. .. 28 ( 276 )-.
(11) Is Health Care a Necessity for the Elderly in Japan ? (Kumagai). 4.. Conclusion. The hypothesis that health care for the elderly is a necessity or a luxury was investigated. in this paper.. was arranged. Quarterly. data from the period 1991-1999 in Japan. by age group of the senior population,. the elderly were estimated.. and health care functions of. The magnitude of income elasticity exceeds one when. there was a dummy variable to capture the effect of changes in out-of-pocket ments in the vector error correction role of adjusting. short-run. models.. interactions. on the representative. individual's. changes in out-of-pocket such structural. generation's. in the model.. of health care expenditures. depend to. If an econometric estimation model captures. changes in payment, it can be considered that health care expendiTherefore, the scheme to finance health care ex-. of the elderly should be reconsidered contribution. if the extent. to social insurance is a major determinant. teristics of health care for the elderly. introduction. the variables. response to expanded income with regards. payments.. ture for the elderly is a luxury. penditures. The relative price also played the. among. We can then conclude that the characteristics. pay-. of the working of the charac-. Further, it should be studied whether the. of public long term insurance. has affected the luxury. status. of. health care for the elderly.. References (1) (2). (3). (4) (5). Blomqvist, A. G. and R. A. L. Carter (1997) "Is health care really a luxury ?," Journal of Health Economics, 16, 2, 207-229. Clemente, J., Marcuello, C., Montaries, A. and Pueyo, F. (2004) "On the international stability of health care expenditure functions:are government and private functions similar ?," Journal of Health Economics, 23, 589-613. Dickey, D. A. and W. A. Fuller (1979) "Distribution of the estimators for autoregressive time series with a unit root," Journal of the American Statistical Association, 74, 427-431. Engle, R. F. and C. W. J. Granger (1987) "Cointegration and error correction : Representation, estimation and testing," Econometrica, 55, 251-276. Gerdtham, U-G. and M. Lothgren (2000) "On stationarity and cointegration of international health expenditure and GNP," Journal of Health Economics, — 29 ( 277 ).
(12) 19, 461-475. Getzen, T. E. (2000) "Health care is an individual necessity and a national luxury : applying multilevel decision models to the analysis of health care expenditures," Journal of Health Economics, 19, 259-270. 7) Hansen, P and A. King (1996) "The determinants of health care expenditure : A cointegration approach", Journal of Health Economics, 15, 1, 127-137. 8) Johansen, S. (1988) "Statistical analysis of cointegrating vectors," Journal of Economic Dynamics and Control, 12, 231-254. 9) Johansen, S. (1992) "Determination of cointegration rank in the presence of a linear trend," Oxford Bulletin of Economics and Statistics, 54, 3, 383-397. [10) Johansen, S. (1995) Likelihood-Based Inference in Cointegrated VectorAutoregressive Models, Oxford University Press. (11) Johansen, S. (2002) "A small sample correction for tests of hypotheses on the cointegrating vectors," Journal of Econometrics, 111, 195-221. (12) Kumagai, N. (2000) "Income elasticity of health care expenditures," in Econometric Analysis on the Demandfor Health and Public Pension (Iryo-juyo to Kotekinenkin no Keiryo-Keizaibunseki) : Doctoral Dissertation, Hiroshima University, 1-21 (in Japanese). (13) Kumagai, N. and I, Ginama (2001) "Cointegration and the conditional variances of the income elasticity of medical care expenditures," mimeo. (14) Kumagai, N. (2004) "On the Demand for Health in Japan: An Econometric Analysis by Two Age Groups," paper presented at the 2004 annual meeting of the Japanese Economic Association, Okayama University. (15) Masubuchi, K. (2000) "Estimation of household consumption functions by age groups of household heads," (KoureisyaSetai HiKoureisyaSetaiBetsu No Macro SyouhiKansuu no Suikei), The Quarterly of Social Security Research (Kikan Shakai Hosho Kenkyu), 36(1), 113-121 (in Japanese). (16) McCoskey, S. K. and T. M. Selden(1998) "Health care expenditure and GDP: panel data unit root test results," Journal of Health Economics, 17, 369-376. (17) McGuire, A., Parkin, D., Hughes, D. and G, Karen (1993) "Econometric analyses of national health expenditures : Can positive economics help to answer normative questions ?," Health Economics, 2, 113-126. (18) Newhouse, J P. (1977) "Medical care expenditure:A cross-national survey," Journal of Human Resources, 12, 115-125. (19) Parkin, D., McGuire, A. and B. Yule (1987) "Aggregate health expenditure and national income," Journal of Health Economics, 6, 109-127. (20) Podivinsky, J. M. (1998) "Testing misspecified cointegrating relationships," Economics Letters, 60, 1-9. 6). Appendix : Two-stage. technique. of Engle and Granger. The E-G method was applied for estimation. sult of estimation. (1987). The following function is the re-. by ordinary least squares (OLS) in the first stage.. ual series of the regression. was stationary. The resid-. since the unit root hypothesis. — 30 ( 278 )—. was.
(13) Is Health Care a Necessity for the Elderly in Japan ? (Kumagai) rejected ters. at the 1 percent. estimated. Thus,. significance. by recursive. it seems that. It is shown that. OLS fluctuated. the E—G method. mate of the income elasticity. level.. in the sample. is not adequate. of health. most of the parameperiod. for obtaining. care expenditures. in Figure a stable. 1.. esti-. in the long run.. lnmepr=2.700+0.4591nipr-0.013rp-7.482raged (6.53) Te=.942. (2.52). S.E.=.020. The variable. (-3.42). (11.38). D.W.=.58. le is adjusted. and D.W., the Durbin—Watson. 1991:1-1999:4. R— squared statistics.. ; S.E., standard. error. of regression. T—values are in parentheses.. Figure 1. Coefficients estimated by recursive OLS. — 31 ( 279 )—. ;.
(14)
図

関連したドキュメント
This study examined the influence of obstacles with various heights positioned on the walkway of the TUG test on test performance (total time required and gait parameters)
This study was performed to examine attitudes toward evacuation(wish to stay at home, access evacuation sites)among elderly community residents that were able to choose
Using Corollary 10.3 (that is, Theorem 1 of [10]), let E n be the unique real unital separable nuclear c- simple purely infinite C*-algebra satisfying the universal coefficient
In the last section, the model is applied to the per capita GDP ratio data in West European countries for the period 1956–1996.. The one step ahead forecasting is per- formed for
Then it follows immediately from a suitable version of “Hensel’s Lemma” [cf., e.g., the argument of [4], Lemma 2.1] that S may be obtained, as the notation suggests, as the m A
Definition An embeddable tiled surface is a tiled surface which is actually achieved as the graph of singular leaves of some embedded orientable surface with closed braid
“Indian Camp” has been generally sought in the author’s experience in the Greco- Turkish War: Nick Adams, the implied author and the semi-autobiographical pro- tagonist of the series
[r]
