<Original>
Relationships between medical expenditures and the Specific Health
Checkups scheme in Japan:
A Study of outpatient medical expenditures and questionnaire responses
concerning lifestyle that form part of the Specific Health Checkups scheme in Japan
Yoshimune H
iratsuka1 , 2 ),Yoh T
amaki1 ),Etsuji O
kamoto3 ),
Hiroe T
subaki4 ),Toshiro K
umakawa1 )1 )Department of Health and Welfare Services, National Institute of Public Health 2 )Department of Ophthalmology, Juntendo University School of Medicine 3 )The University of Fukuchiyama
4 )National Statistics Center
Abstract
Background: Seven years have passed since the implementation of the Specific Health Checkups and Specific Health Guidance scheme in Japan, and now it is possible to investigate long-term factors relating to medical expenditures at a local level by comparing data from Specific Health Checkups with health insurance claims. The aim of this study is to investigate long-term relationships between outpatient medical expenditures and questionnaire responses concerning lifestyle that form part of the Specific Health Checkups scheme, accumulated during a 5 year period.
Methods: A cumulative total of 43,740 recipients of Specific Health Checkups (representing 14,848 unique individuals) collected between 2008 and 2012, in Mishima City in Shizuoka Prefecture, Japan were included in this study. The average age was 65.3±7.8 of which 60% were female. Questionnaire responses concerning lifestyle forming part of the Specific Health Checkups scheme, along with health insurance claims data accumulated over 5 years were used. Long-term relationships between outpatient medical expenditures and patient s lifestyle were analyzed using panel data analysis.
Results: Medication of low blood pressure, blood glucose or cholesterol levels, a history of stroke or heart disease along with weight change (gain or loss of ≥3kg) exhibit a relationship with increases in outpatient medical expenditures. Lifestyle factors such as physical activities, fast walking and good sleep patterns each displayed relationships with reductions in outpatient medical expenditures. Further, Health Guidance is also seen to have an association with lowering outpatient medical expenditures in the same year that the guidance was given, as well as the following year.
Conclusions: Low-cost and easily executable questionnaires as part of the Specific Health Checkups scheme enable not only risk assessments of lifestyle-disease of the targeted individuals but also the prediction of long-term trends in outpatient medical expenditures. Physical activities, fast walking, good sleep patterns and Health Guidance have an association with lowering medical expenditures.
keywords: medical expenditures, Specific Health Checkups, Specific Health Guidance, physical activities
(accepted for publication, 13th January 2017)
Corresponding author: Yoshimune Hiratsuka. 2-3-6 Minami, Wako, Saitama, 351-0197, Japan. Tel: 048-458-6338
I. Introduction
Each year, national health expenditure is increasing in Japan. During fiscal 1999 national health expenditure exceeded 30 trillion Japanese yen for the first time, currently stands at almost 40 trillion Japanese yen, and the ratio of national health expenditure to gross domestic products has reached 8.3% [1]. In particular, medical care costs for the elderly is growing at the rate of about 9% annually as the aging population increases rapidly. When we compare the medical examination fee per person, the fee for the elderly is 5 times greater than that for the non-elderly [2]. Considering these factors, it is necessary that we continue to promote the improvement and management of lifelong health as well as to offer adequate medical care for the elderly in an efficient manner. At the same time, evidence based preventive measures are needed to control the burden placed on society caused by rapidly
increasing medical expenditure .
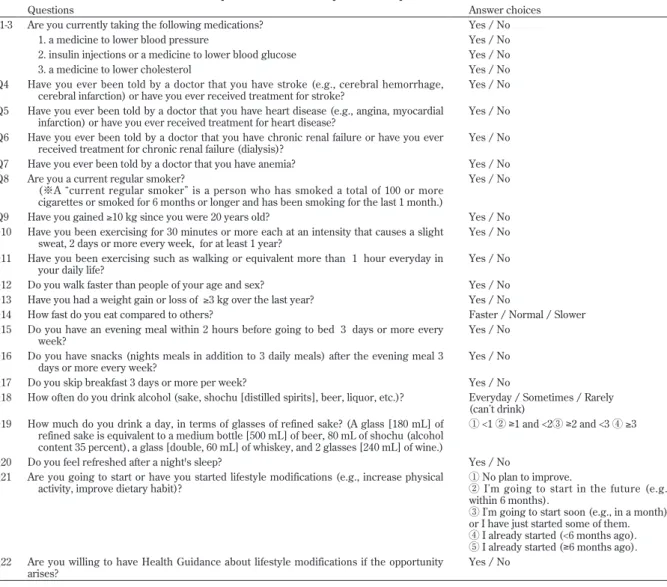
In 2008, the Japanese Ministry of Health, Labour and Welfare implemented a standard program of health checkups to identify persons at high-risk of Metabolic Syndrome as part of a series of measures carried out to achieve appropriate levels of medical expenditure. Seven years have passed since the implementation of the Specific Health Checkups and Specific Health Guidance scheme. While it is technically possible to investigate long-term factors relating to medical expenditure at a local level through the comparison of data relating to Specific Health Checkups with health insurance claims of medical fees today, long-term reports of this nature are limited [3, 4]. The Specific Health Checkups scheme uses a low-cost and easily executable, standard questionnaire to assess the lifestyle-disease risks for a patient [5]. Several studies indicate that answers to 22 simple questions (Table 1) can help to predict an individual’s state of health [6-9]. If such
Table 1 The Specific Health Checkups standard questionnaire
The Specific Health Checkups standard questionnaire
Questions Answer choices
Q1-3 Are you currently taking the following medications? Yes / No
1. a medicine to lower blood pressure Yes / No
2. insulin injections or a medicine to lower blood glucose Yes / No
3. a medicine to lower cholesterol Yes / No
Q4 Have you ever been told by a doctor that you have stroke (e.g., cerebral hemorrhage,
cerebral infarction) or have you ever received treatment for stroke? Yes / No Q5 Have you ever been told by a doctor that you have heart disease (e.g., angina, myocardial
infarction) or have you ever received treatment for heart disease? Yes / No Q6 Have you ever been told by a doctor that you have chronic renal failure or have you ever
received treatment for chronic renal failure (dialysis)? Yes / No Q7 Have you ever been told by a doctor that you have anemia? Yes / No Q8 Are you a current regular smoker?
(※A current regular smoker is a person who has smoked a total of 100 or more cigarettes or smoked for 6 months or longer and has been smoking for the last 1 month.)
Yes / No Q9 Have you gained ≥10 kg since you were 20 years old? Yes / No Q10 Have you been exercising for 30 minutes or more each at an intensity that causes a slight
sweat, 2 days or more every week, for at least 1 year? Yes / No Q11 Have you been exercising such as walking or equivalent more than 1 hour everyday in
your daily life? Yes / No
Q12 Do you walk faster than people of your age and sex? Yes / No Q13 Have you had a weight gain or loss of ≥3 kg over the last year? Yes / No
Q14 How fast do you eat compared to others? Faster / Normal / Slower
Q15 Do you have an evening meal within 2 hours before going to bed 3 days or more every
week? Yes / No
Q16 Do you have snacks (nights meals in addition to 3 daily meals) after the evening meal 3
days or more every week? Yes / No
Q17 Do you skip breakfast 3 days or more per week? Yes / No
Q18 How often do you drink alcohol (sake, shochu [distilled spirits], beer, liquor, etc.)? Everyday / Sometimes / Rarely (can t drink)
Q19 How much do you drink a day, in terms of glasses of refined sake? (A glass [180 mL] of refined sake is equivalent to a medium bottle [500 mL] of beer, 80 mL of shochu (alcohol content 35 percent), a glass [double, 60 mL] of whiskey, and 2 glasses [240 mL] of wine.)
① <1 ② ≥1 and <2③ ≥2 and <3 ④ ≥3
Q20 Do you feel refreshed after a night's sleep? Yes / No
Q21 Are you going to start or have you started lifestyle modifications (e.g., increase physical
activity, improve dietary habit)? ① No plan to improve. ② I m going to start in the future (e.g., within 6 months).
③ I m going to start soon (e.g., in a month), or I have just started some of them. ④ I already started (<6 months ago). ⑤ I already started (≥6 months ago). Q22 Are you willing to have Health Guidance about lifestyle modifications if the opportunity
simple questionnaires can be used to predict trends in long-term medical expenditures, it will be a very cost-effective measure for the integration of health delivery systems that bring together clinicians, managers, funders and deliverers. The purpose of this study is to investigate long-term relationships between the questionnaire responses that form part of the Specific Health Checkups scheme and outpatient medical expenditures using panel data analysis, by comparing Specific Health Checkups data and the claims accumulated during a 5 year period in Mishima City in Shizuoka Prefecture, Japan.
II. Methods
Targeted population
Our target population comprised of a cumulative total of
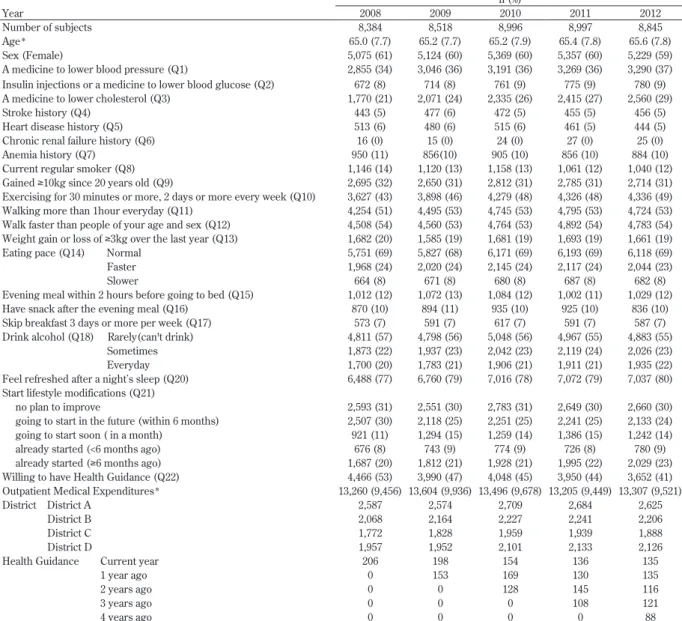
43,740 recipients of Specific Health Checkups, representing 14,848 unique individuals, observed between 2008 and 2012. The sample population forms part of the 31,072 National Health Insurance beneficiaries (a health insurance program administered by municipal governments for self-employed people, workers engaged in agriculture, forestry and fisheries, workers of small business and aged younger than 75) in Mishima City (population circa 110,000) in Shizuoka Prefecture, Japan. The beneficiaries’ average age was 65.3±7.8, of which 60% were female. Three hundred and fifteen Specific Health Checkups recipients were excluded from this study, because they died during the study period. The total number of recipients under the Specific Health Checkups scheme are: 8,384 in the year of 2008; 8,518 in 2009; 8,996 in 2010; 8,997 in 2011, and 8,845 in 2012 (Table 2).
Table 2 Descriptive statistics of the panel data n (%)
Year 2008 2009 2010 2011 2012
Number of subjects 8,384 8,518 8,996 8,997 8,845
Age* 65.0 (7.7) 65.2 (7.7) 65.2 (7.9) 65.4 (7.8) 65.6 (7.8)
Sex (Female) 5,075 (61) 5,124 (60) 5,369 (60) 5,357 (60) 5,229 (59)
A medicine to lower blood pressure (Q1) 2,855 (34) 3,046 (36) 3,191 (36) 3,269 (36) 3,290 (37) Insulin injections or a medicine to lower blood glucose (Q2) 672 (8) 714 (8) 761 (9) 775 (9) 780 (9) A medicine to lower cholesterol (Q3) 1,770 (21) 2,071 (24) 2,335 (26) 2,415 (27) 2,560 (29)
Stroke history (Q4) 443 (5) 477 (6) 472 (5) 455 (5) 456 (5)
Heart disease history (Q5) 513 (6) 480 (6) 515 (6) 461 (5) 444 (5)
Chronic renal failure history (Q6) 16 (0) 15 (0) 24 (0) 27 (0) 25 (0)
Anemia history (Q7) 950 (11) 856(10) 905 (10) 856 (10) 884 (10)
Current regular smoker (Q8) 1,146 (14) 1,120 (13) 1,158 (13) 1,061 (12) 1,040 (12) Gained ≥10kg since 20 years old (Q9) 2,695 (32) 2,650 (31) 2,812 (31) 2,785 (31) 2,714 (31) Exercising for 30 minutes or more, 2 days or more every week (Q10) 3,627 (43) 3,898 (46) 4,279 (48) 4,326 (48) 4,336 (49) Walking more than 1hour everyday (Q11) 4,254 (51) 4,495 (53) 4,745 (53) 4,795 (53) 4,724 (53) Walk faster than people of your age and sex (Q12) 4,508 (54) 4,560 (53) 4,764 (53) 4,892 (54) 4,783 (54) Weight gain or loss of ≥3kg over the last year (Q13) 1,682 (20) 1,585 (19) 1,681 (19) 1,693 (19) 1,661 (19)
Eating pace (Q14) Normal 5,751 (69) 5,827 (68) 6,171 (69) 6,193 (69) 6,118 (69)
Faster 1,968 (24) 2,020 (24) 2,145 (24) 2,117 (24) 2,044 (23)
Slower 664 (8) 671 (8) 680 (8) 687 (8) 682 (8)
Evening meal within 2 hours before going to bed (Q15) 1,012 (12) 1,072 (13) 1,084 (12) 1,002 (11) 1,029 (12) Have snack after the evening meal (Q16) 870 (10) 894 (11) 935 (10) 925 (10) 836 (10) Skip breakfast 3 days or more per week (Q17) 573 (7) 591 (7) 617 (7) 591 (7) 587 (7) Drink alcohol (Q18) Rarely(can't drink) 4,811 (57) 4,798 (56) 5,048 (56) 4,967 (55) 4,883 (55)
Sometimes 1,873 (22) 1,937 (23) 2,042 (23) 2,119 (24) 2,026 (23)
Everyday 1,700 (20) 1,783 (21) 1,906 (21) 1,911 (21) 1,935 (22)
Feel refreshed after a night s sleep (Q20) 6,488 (77) 6,760 (79) 7,016 (78) 7,072 (79) 7,037 (80) Start lifestyle modifications (Q21)
no plan to improve 2,593 (31) 2,551 (30) 2,783 (31) 2,649 (30) 2,660 (30)
going to start in the future (within 6 months) 2,507 (30) 2,118 (25) 2,251 (25) 2,241 (25) 2,133 (24) going to start soon ( in a month) 921 (11) 1,294 (15) 1,259 (14) 1,386 (15) 1,242 (14)
already started (<6 months ago) 676 (8) 743 (9) 774 (9) 726 (8) 780 (9)
already started (≥6 months ago) 1,687 (20) 1,812 (21) 1,928 (21) 1,995 (22) 2,029 (23) Willing to have Health Guidance (Q22) 4,466 (53) 3,990 (47) 4,048 (45) 3,950 (44) 3,652 (41) Outpatient Medical Expenditures* 13,260 (9,456) 13,604 (9,936) 13,496 (9,678) 13,205 (9,449) 13,307 (9,521)
District District A 2,587 2,574 2,709 2,684 2,625
District B 2,068 2,164 2,227 2,241 2,206
District C 1,772 1,828 1,959 1,939 1,888
District D 1,957 1,952 2,101 2,133 2,126
Health Guidance Current year 206 198 154 136 135
1 year ago 0 153 169 130 135
2 years ago 0 0 128 145 116
3 years ago 0 0 0 108 121
4 years ago 0 0 0 0 88
Statistics and Analyses
We calculated the annual outpatient medical expenditures for the target individuals between 2008 and 2012 by adding up each year’s claim points. Using official medical fee tariffs in Japan, 1 point represents 10 Japanese yen. We combined this data with 5-year results gathered from the Specific Health Checkups questionnaires to obtain longitudinal panel data for each individual, year by year (Table 2).
In order to narrow down relationships between the questionnaire responses and outpatient medical expenditures, we conducted advance analysis. For simplicity’s sake, here we analyzed data in a cross-sectional manner in the advance analysis without giving consideration to serial correlation of outpatient medical expenditures over the 5 year period. Since outpatient medical expenditures, defined as dependent variables, included zero and were skewed, we first adjusted these using logarithmic transformations (log10(outpatient medical expenditure +
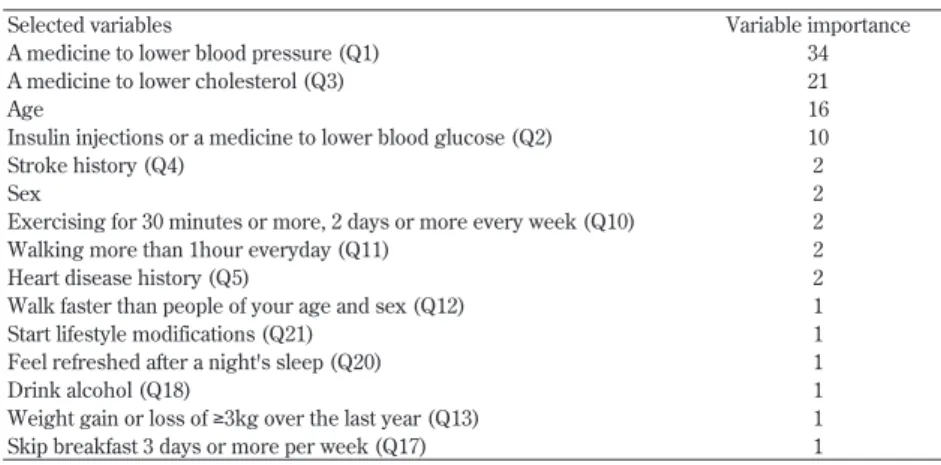
250), adding the positive value to make the results more normally distributed. Next, we conducted decision tree analysis (Classification And Regression Tree analysis : CART) [10], using log-transformed outpatient medical expenditure as dependent variables, we defined sex, age and 21 questionnaire items (item Q19 was omitted since both items Q18 and Q19 in Table 1 related to drinking) as explanatory variables, and thus identified variables that contributed to predicting outpatient medical expenditures. Applying CART advance analysis, 15 explanatory variables were selected from: sex, age, and 21 questionnaire items for the panel data analysis, on the basis that they demonstrated greater possibilities of reducing prediction errors associated with outpatient medical expenditures (Table 3).
Long-term relationships between outpatient medical expenditures and the questionnaire responses concerning lifestyle for the Specific Health Checkups accumulated during the 5 year period, were investigated through the use of panel data analysis. Panel data analysis is a
statistical method, widely used in econometrics and social science, dealing with panel data (also known as longitudinal or cross-sectional time-series data) in which the behavior of entities, such as individuals, organizations, and countries are observed across time. The data is usually collected over time for the same individuals and then a regression is conducted across these two dimensions. Panel data analysis has two independent approaches: the random-effects models, and the fixed-effects models. An advantage of the random-fixed-effects model is that we can include time invariant variables (e.g. sex). In the fixed-effects model these variables are absorbed by the intercept. Therefore, if the key explanatory variable is constant over time, we cannot apply fixed-effects models to estimate effects on a dependent variable [11]. In this study, we used a random-effect model to identify the influences by factors that did not change chronologically on each individual’s level, such as sex and district. Random-effect models can be expressed by the following: Yit = bXit + a + uit + fit
Where: i and t are indices for individuals and time, Y is the dependent variable for i and t, X represents one independent variable for i and t, and, a and b are coefficients. uit is the between-entity error, and fit is the within-entity error which is also assumed to vary stochastically over i or/and t and requires special treatment of the error variance matrix.
We then conducted a panel data analysis of outpatient medical expenditures as dependent variables using highly predictive factors as explanatory variables. On this occasion, we added squares of ages as explanatory variables in order to validate the assumption that an increase in outpatient medical expenditures accelerated with aging. As explanatory variables, we also forcibly applied annual dummy variables to remove the influence of factors such as revisions of official medical fee tariffs on annual medical expenditures, as well as a further set of dummy variables representing “districts” in order to
Table 3 15 selected variables through the advance analysis by CART
Selected variables Variable importance
A medicine to lower blood pressure (Q1) 34
A medicine to lower cholesterol (Q3) 21
Age 16
Insulin injections or a medicine to lower blood glucose (Q2) 10
Stroke history (Q4) 2
Sex 2
Exercising for 30 minutes or more, 2 days or more every week (Q10) 2
Walking more than 1hour everyday (Q11) 2
Heart disease history (Q5) 2
Walk faster than people of your age and sex (Q12) 1
Start lifestyle modifications (Q21) 1
Feel refreshed after a night's sleep (Q20) 1
Drink alcohol (Q18) 1
Weight gain or loss of ≥3kg over the last year (Q13) 1
investigate district-by-district variations among the four districts in Mishima City. Further, in order to identify the influences of having received Specific Health Guidance (assistance to improve lifestyle such as diet and exercise habits according to lifestyle disease risks, hereinafter referred to as the “Health Guidance”), guidance states for the current year and guidance histories of the previous 1 to 4 years were applied as lagging variables. We defined those patients who received actual Health Guidance (i.e. intermediate guidance and/or aggressive guidance) as those recipients who received Health Guidance. Intermediate guidance represents a single counseling session with health professionals whereas aggressive guidance represents further series of counseling for more than three months. We used R and Stata MP12 for the analyses and set a significance level at 5%.
Ethical consideration
This study was approved by the National Institute of
Public Health (NIPH-IBRA#12061).
III. Results
The total annual number of checkups undertaken by the recipients ranged approximately from 8,400 to 9,000. The average age of the patients was approximately 65 years, of which approximately 60% were female across all sample periods (Table 2).
With regard to all questionnaire items, the following two: “taking medicine to lower cholesterol” (Q 3 ), and “exercising for 30 minutes or more, 2 days or more every week (exercise)” (Q10: exercise), showed an increasing trend every year. On the other hand, the number of: current regular smokers (Q8); people who rarely drink (Q18), and people who are willing to receive Health Guidance (Q22) showed a declining trend every year (Table 2).
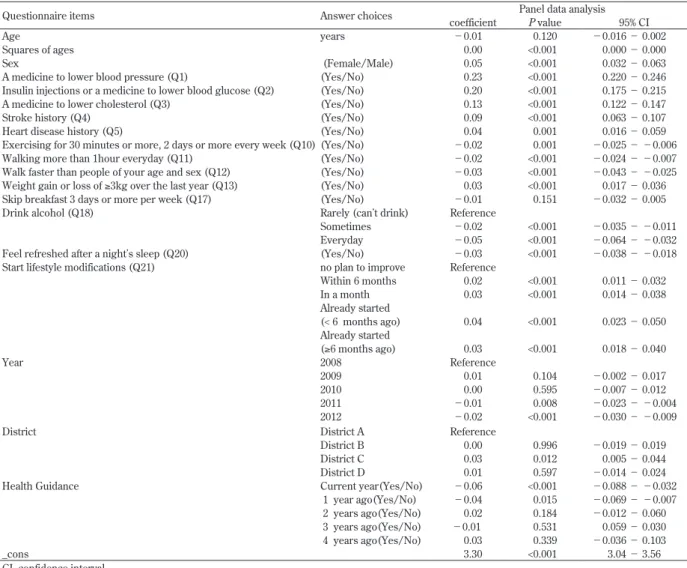
Table 4 Results of the longitudinal relationship between questionnaire items and outpatient medical expenditures using panel data analysis (n=14,848, 43,740 records)
Questionnaire items Answer choices coefficient Panel data analysisP value 95% CI
Age years −0.01 0.120 −0.016 − 0.002
Squares of ages 0.00 <0.001 0.000 − 0.000
Sex (Female/Male) 0.05 <0.001 0.032 − 0.063
A medicine to lower blood pressure (Q1) (Yes/No) 0.23 <0.001 0.220 − 0.246
Insulin injections or a medicine to lower blood glucose (Q2) (Yes/No) 0.20 <0.001 0.175 − 0.215
A medicine to lower cholesterol (Q3) (Yes/No) 0.13 <0.001 0.122 − 0.147
Stroke history (Q4) (Yes/No) 0.09 <0.001 0.063 − 0.107
Heart disease history (Q5) (Yes/No) 0.04 0.001 0.016 − 0.059
Exercising for 30 minutes or more, 2 days or more every week (Q10) (Yes/No) −0.02 0.001 −0.025 − −0.006
Walking more than 1hour everyday (Q11) (Yes/No) −0.02 <0.001 −0.024 − −0.007
Walk faster than people of your age and sex (Q12) (Yes/No) −0.03 <0.001 −0.043 − −0.025 Weight gain or loss of ≥3kg over the last year (Q13) (Yes/No) 0.03 <0.001 0.017 − 0.036 Skip breakfast 3 days or more per week (Q17) (Yes/No) −0.01 0.151 −0.032 − 0.005
Drink alcohol (Q18) Rarely (can t drink) Reference
Sometimes −0.02 <0.001 −0.035 − −0.011
Everyday −0.05 <0.001 −0.064 − −0.032
Feel refreshed after a night s sleep (Q20) (Yes/No) −0.03 <0.001 −0.038 − −0.018 Start lifestyle modifications (Q21) no plan to improve Reference
Within 6 months 0.02 <0.001 0.011 − 0.032 In a month 0.03 <0.001 0.014 − 0.038 Already started (< 6 months ago) 0.04 <0.001 0.023 − 0.050 Already started (≥6 months ago) 0.03 <0.001 0.018 − 0.040 Year 2008 Reference 2009 0.01 0.104 −0.002 − 0.017 2010 0.00 0.595 −0.007 − 0.012 2011 −0.01 0.008 −0.023 − −0.004 2012 −0.02 <0.001 −0.030 − −0.009
District District A Reference
District B 0.00 0.996 −0.019 − 0.019
District C 0.03 0.012 0.005 − 0.044
District D 0.01 0.597 −0.014 − 0.024
Health Guidance Current year(Yes/No) −0.06 <0.001 −0.088 − −0.032
1 year ago(Yes/No) −0.04 0.015 −0.069 − −0.007 2 years ago(Yes/No) 0.02 0.184 −0.012 − 0.060 3 years ago(Yes/No) −0.01 0.531 0.059 − 0.030 4 years ago(Yes/No) 0.03 0.339 −0.036 − 0.103
_cons 3.30 <0.001 3.04 − 3.56
Annual average outpatient medical expenditures ranged between 13,205 and 13,604 points, with medians between 9,449 and 9,936 points. There were no large annual variations in the number of health-checkup recipients at the district level either. The number of Health Guidance recipients showed a decreasing trend every year, from 206 individuals in 2008 to 135 individuals in 2012 (Table 2). Table 4 displays the results of the panel data analysis (random-effect model, p<0.001, Breusch-Pagan Lagrange multiplier test). There was a significant, nonlinear increase in outpatient medical expenditures associated with advancing age, as indicated by the significant age-squared terms (Table 4).
The following questionnaire items: sex (female); medication (medicine to lower blood pressure (Q1); insulin injections or medicine to lower blood glucose (Q2); medicine to lower cholesterol level (Q3)); stroke history (Q4); heart disease history (Q5), and “weight gain or loss of ≥3kg over the last year” (Q13: weight change), each displayed significant positive coefficients. Medication had the greatest influence on outpatient medical expenditures, with the highest coefficient being 0.23 for antihypertensive agents which showed an influence 1.7 times greater than hypolipidemic agents and 1.2 times greater than hypoglycemic agents.
With regard to the issue of starting lifestyle modifications (Q21), all groups (e.g. going to start in the future, going to start soon, etc.) showed significant positive coefficients in comparison to the “no plan to improve” group.
Meanwhile, “exercise” (Q10), “walking” (Q11), “walk fast” (Q12), and “good sleep” (Q20) showed significant negative coefficients. In particular the “walk fast” (Q12) and “good sleep” (Q20) items showed lower coefficient than the others.
With respect to drinking frequency (Q18), a comparison between a group that “rarely drink”, with groups that “drink sometimes” or “every day”, showed significant negative coefficients. Results for 2011 and 2012 showed significant negative coefficients in comparison to 2008. With regard to districts, only district C showed a significant positive coefficient compared to district A. Health Guidance in a given year and a year earlier showed significant negative coefficients, however Health Guidance given 2 years before, or earlier, showed no significant relationships.
IV. Discussion
This study investigated relationships between outpatient medical expenditures and lifestyle disease risks identified by the questionnaires, based on large-scale data comprising of the total Specific Health Checkups data and the claims of one local government accumulated over 5 years that
covered about 44,000 people on a cumulative basis. This study indicated that questionnaire responses relating to the Specific Health Checkups scheme were a useful information source and as a possible predictor of trends in long-term outpatient medical expenditures. It was natural to assume that medication and disease histories would strongly influence medical expenditures, however it was also found that physical activities, fast walking, and good sleep independently related to a reduction of medical expenditures. Moreover, Health Guidance was also seen to have an association with the reduction of medical expenditures for the same year that such guidance was given, as well as in the following year.
Our previous study [3] identified significant relationships between: a) stroke, heart disease histories, “walking” (Q11) and an increase in medical expenditures and b) between females, “walk fast” (Q12), “good sleep” (Q20) and a decrease in medical expenditures, observed 4 years after the Specific Health Checkups and notably at the 80% quantile, where a large increase was observed. However, our previous study investigated relationships between medical expenditures (inpatient and outpatient) on two distinct occasions i.e. the year of the Specific Health Checkups (2008) and 4 years later (2012), and referencing the questionnaire responses collected in 2008. Consequently, chronological changes in medical expenditures as well as questionnaire responses for the years between 2008 and 2012 were not investigated. Furthermore, the individuals who received Health Guidance were not included. In spite of those inconsistencies, both our present and previous studies indicated that “walk fast” (Q12) and “good sleep” (Q20) as lifestyle items that relate to a reduction in medical expenditures.
The most influential factor on increased outpatient medical expenditures turned out to be medication, i.e. medicine to lower blood pressure (Q1), insulin injections or medicine to lower blood glucose (Q2) and medicine to lower cholesterol level (Q3). The average expenditures for antihypertensive agents, hyperlipidemia agents and antidiabetic agents per prescription in Japan in 2013 were 683, 357, and 340 Japanese yen, respectively [12]. The results of the current study showed that outpatient medical expenditures, represented by examination costs and treatment costs, were also higher for patients who took antihypertensive agents as compared to those patients who took antidiabetic or hyperlipidemia agents. Stroke history that had hypertension as an underlying disease also showed relatively high positive coefficients. “Weight change” (Q13) exhibited a trend to increase outpatient medical expenditures. There is a report indicating that weight gain (more than 2 kg) is strongly related to an increased risk of hypertension and hypercholesterolemia after adjustments for possible confounding factors [13] while the current study goes
further to suggest that weight change (gain or loss of ≥3 kg) may have led to the advent of these diseases and influenced medical expenditures.
Two physical activity items, “exercise” (Q10) and “walking” (Q11), both showed significant negative coefficients. This result indicates that those patients with daily exercise habits paid approximately 5 % lower medical expenditures. In particular the “walk fast” (Q12) item exhibited a lower coefficient than the other factors. It is a widely known that exercise has a positive influence on health [14], however our study has identified a similar influence on medical expenditures.
Non-restorative sleep, which includes short sleep duration and poor sleep quality, is also associated with lifestyle factors [15]. Wakasugi et al’s cross-sectional study using Japanese Specific Health Checkups data in 2008 [16] reported that unhealthy lifestyle factors were associated with non-restorative sleep, after adjustment for possible confounders such as hypertension, hypercholesterolemia, diabetes, and chronic kidney diseases. In this current study, a significant relationship was identified between “good sleep” (Q20) and reduction of medical expenditures, after adjustment for possible confounders (Table 4).
Regarding drinking of alcohol (Q18), it turned out that the groups that “sometimes drink” and “drink every day” incurred lower outpatient medical expenditures than the group that rarely drink alcohol. The results this time showed that coefficients of the “drink every day” group were higher than the ones of the “sometimes drink” group. Preventive effects of moderate drinking of alcohol on many diseases have been reported [17, 18], however the result might also be indicating that those patients who were healthy enough to drink every day consequentially incurred less medical expenditures. On the issue of starting lifestyle modifications (Q21), the groups that were “going to start,” have “already started,” etc., showed positive links with an increase in medical expenditures, compared to the group that did not have plans to undertake lifestyle improvements. This might indicate that many patients who were not healthy and needed to go to hospitals worked on lifestyle modifications. From this, we also cannot deny the possibility of the existence of an opposite causal relationships linked between medical expenditures and drinking and lifestyle modifications. When taking account of medical expenditures, a series of revisions of official medical fee tariffs implemented every 2 years changed medical data reference points requiring further analysis in order to exclude the effect of that influence. For the purposes of this study, we investigated each individual year’s results by applying annual “dummy” variables and in so doing we observed a reduction in medical expenditures in 2011 and 2012 compared to 2008. Between these years, revisions of
official medical fee tariffs were implemented in 2010 and 2012 in Japan. In both years, the policy focus was on enhancing acute medical care mainly through hospitalization [19, 20], and it is possible that an influence from such a policy was reflected.
Comparing district characteristics, district C showed a significant increase in medical expenditures compared with district A. This indicated that local variation existed even on a city level. This also suggests that implementation of medical service delivery systems should also consider local characteristics, even within a city.
A report by Mitsutake et al [21] discusses the relationship between the Health Guidance and medical expenditures in a study of relationships between outpatient medical expenditures and Health Guidance for 1 year commencing in 2008. After adjusting differences among medical insurers, age, sex, and the presence of medication, a significant relationship was identified between the group that received intermediate guidance and a reduction in medical expenditures. On the other hand, no relationships were identified with aggressive guidance. Okamoto [22] conducted a propensity score analysis to investigate a causal relationship between Health Guidance (both intermediate and aggressive), metabolic syndrome-related outpatients and pharmaceutical expenditures during the three year period following the initial Health Guidance. Although no difference was observed between the health guidance group and the matched control group, regression analysis suggested a small but no significant reduction in health care expenditures. Our study covered five years and included adjustments for patients' lifestyles, as well as data relating to their ages, sex, and medication histories. As a result, it was found that Health Guidance, including both intermediate guidance and aggressive guidance, was related to a reduction in medical expenditures in the same year that the guidance was given, as well as the following year, however Health Guidance received two or more years earlier did not exhibit a relationship with medical expenditures. The size of such effects was interpreted to be approximately a 15% reduction in medical expenditures in the same year and approximately 10% reduction in the following year. It was also found that Health Guidance had three times more influence than “exercise” (Q10) or “walking” (Q11) in the same year, and had twice as much influence as “exercise” (Q10) or “walking” (Q11) in the following year. Health Guidance (aggressive guidance) was reported to significantly reduce the values of weight, body mass index (BMI), abdominal circumference, hemoglobin A1c and neutral fat, and to significantly increase the values of HDL cholesterol 1 year following the guidance, even after the influences of background factors were adjusted for [23]. It was suggested that these changes were possible causes of medical expenditure
reductions.
It is widely accepted that smoking is closely associated with morbidity and mortality from lifestyle diseases [24, 25], and therefore, smoking has a major impact on both health status and medical expenditures. However, a report on the relationship between smoking and medical expenditures in Japan by Izumi et al. showed that while male smokers incurred 11% more medical costs compared to “never smokers”, however costs remain almost the same for females (after adjustment for age, physical functioning status, alcohol consumption, BMI, and average time spent walking) [26]. In our study, smoking was excluded from the explanatory variables in the panel data analysis by applying CART advance analysis. This may be because about 60% of the samples are female in our study.
We acknowledge that the current study has certain limitations. Firstly, the study analyzed only outpatient medical expenditures and did not include inpatient medical expenditures, expenditures on medicines dispensed at pharmacies, etc. The general proportions of outpatient medical, inpatient medical, pharmacy and dental treatment expenditures are approximately 10:11:5:2 in Japan, so outpatient medical expenditures alone cannot rightly represent overall medical expenditures. However, inpatient medical expenditures did not seem to be an appropriate analysis subject to investigate relationships using the questionnaire. Inpatient medical expenditures had strong influences from diseases and conditions that necessitated hospitalization, rather than from daily lifestyle items represented by the questionnaire responses we reviewed. On the other hand, outpatient medical expenditures were expected to have stronger relationships with lifestyle because, to a large extent, they involved day-to-day outpatient medical expenditures. Secondly, the study only investigated beneficiaries insured by a municipal National Health Insurance program and did not cover the entire population. However, the study was an investigation from the standpoint of a local government as a National Health Insurance insurer, and useful information to formulate future medical policies at a local level was obtained. In addition, the study reports the results of the investigation in Mishima City only, therefore any generalizations drawn from of these results must be examined cautiously. The fact that significant variation in medical expenditure was found on a district level within one city seems to call for investigations on subdivided levels rather than across all of Japan or at the prefecture level. In relation to the loss of follow up subjects, while we did not consider subjects relocating out of Mishima City between 2008 to 2012, we did however excluded 315 subjects who died during this period. The data relating to deaths was not derived from health insurance claims but rather from a list of fatalities provided by Mishima City,
therefore, the subjects that moved out of Mishima City during this period may not necessarily be included in the list. Finally, lifestyles and medical expenditures are not connected by direct causal relationships. There are many diseases other than lifestyle diseases that may be caused by the influence of lifestyle. Medical expenditures are reflections of all those diseases and many other factors, other than lifestyle, also have influences on them. We will follow up this study with more detailed investigations using results of the Specific Health Checkups scheme, diagnoses recorded in claims and details of medical services provided.
V. Conclusion
Low-cost and easily executable questionnaires under the Specific Health Checkups scheme enable not only risk assessment of target individuals but also prediction of long-term trends in outpatient medical expenditures. Physical activities, fast walking, and good sleep displayed relationships with reductions in outpatient medical expenditures. Furthermore, Health Guidance can also be associated with lowering outpatient medical expenditures in the same year as the giving of that guidance, as well as in the following year.
References
[1] Japanese Ministry of Health, Labour and Welfare. The Current State of National Medical Expenditure 2012. http://www.mhlw.go.jp/toukei/saikin/hw/ k-iryohi/12/index.html (accessed 2016-04-28) [2] Japanese Ministry of Health, Labour and Welfare.
Providing health care for all people without worries. http://www.mhlw.go.jp/english/org/policy/p34-35. html (accessed 2016-04-28)
[3] Tamaki Y, Hiratsuka Y, Okamoto E, Kumakawa T. A Study on Risk Factors That Increase Medical expenditures through Comparison with Data of Medical Fee Receipts: Analyses of Questionnaires of Specific Health Checkups and Each Inspection Item. Journal of Health and Welfare Statistics. 2014; 6 : 1 -5. (In Japanese)
[4] Okamoto E, Hiratsuka Y, Otsubo K, Kumakawa T. Evaluation of the health check up and guidance program through linkage with health insurance claims. Journal of the National Institute of Public Health. 2013;62:13-30. https://www.niph.go.jp/ journal/data/62-1/201362010003.pdf (accessed 2016-04-28)
[5] Japanese Ministry of Health, Labour and Welfare. Standard Medical Checkups and Health Guidance Program (Final Version) 2007. http://www.mhlw. go.jp/bunya/kenkou/seikatsu/pdf/02.pdf (accessed
2016-04-28)
[6] Kawakami R, Miyachi M. [Validity of a standard questionnaire to assess physical activity for Specific Health Checkups and health guidance]. Japanese Journal of Public Health. 2010;57:891-899. (In Japanese)
[7] Horie H, Eguchi Y, Mizuta T, Kitajima Y, Ishibashi E, Hirakawa M, et al. Is It Possible to Presume Visceral Fat Accumulation by a Standard Questionnaire Used in the Specific Health Checkups? The Journal of Japan Mibyou System Association. 2010;15:259-261. (In Japanese)
[8] Mizoshita M, Akamatsu R, Yamamoto K, Takemi Y. Is the Stage of lifestyle Change Consistent with Health Behaviors among Japanese Adults ?: A Study of a Standard Questionnaire for Specific Health Checkups. The Japanese Journal of Nutrition and Dietetics. 2011;69(3):318-325. (In Japanese)
[9] Suzuki A, Fukkoshi Y, Akamatsu R. Eating Behaviors of Non-obese Individuals with Long-term Weight Gain: A Self-administered Questionnaires Survey at Specific Health Checkups. The Japanese Journal of Nutrition and Dietetics. 2013;71(5):282-289. (In Japanese)
[10] Breiman L, Friedman J, Stone CJ, Olshen RA. Classification and regression trees. Belmont, CA: Wadsworth International; 1984.
[11] Wooldridge JM. Introductory Econometrics: A modern approach. Canada: South-Western Cengage Learning; 2009.
[12] Japanese Ministry of Health, Labour and Welfare. A Trend in Dispensing Fees 2013 (Computer Processed Portion). http://www.mhlw.go.jp/topics/medias/ year/13/gaiyou.html (accessed 2016-04-28)
[13] Ishikawa-Takata K, Ohta T, Moritaki K, Gotou T, Inoue S. Obesity, weight change and risks for hypertension, diabetes and hypercholesterolemia in Japanese men. Euro Journal of Clinical Nutrition. 2002;56(7):601-607.
[14] U.S. Department of Health and Human Services. Physical activity and health: a report of the Surgeon General. National Center for Chronic Disease Prevention and Health Promotion. Atlanta: CDC; 1996.
[15] Shochat T. Impact of lifestyle and technology developments on sleep. Journal of Nature and Science of Sleep. 2012; 4 :19-31.
[16] Wakasugi M, Kazama J, Narita I, Iseki K, Moriyama T, Yamagata K, et al. Association between combined lifestyle factors and non-restorative sleep in Japan: a cross-sectional study based on a Japanese health
database. PLoS One. 2014;9(9):e108718. doi: 10.1371/ journal.pone.0108718.
[17] Reynolds K, Lewis B, Nolen JD, Kinney GL, Sathya B, He J. Alcohol consumption and risk of stroke: a meta-analysis. JAMA. 2003;289(5):579-588.
[18] Costanzo S, Di Castelnuovo A, Donati MB, Iacoviello L, de Gaetano G. Alcohol consumption and mortality in patients with cardiovascular disease: a meta-analysis. Journal of the American College of Cardiology. 2010;55:1339-1347.
[19] Japanese Ministry of Health, Labour and Welfare. An Overview of the Revision of Medical Treatment Fees 2010. http://www.mhlw.go.jp/bunya/iryouhoken/ iryouhoken12/dl/index-002.pdf (accessed 2016-04-28)
[20] Japanese Ministry of Health, Labour and Welfare. An Overview of the Revision of Medical Treatment Fees 2012. http://www.mhlw.go.jp/file/06-Seisakujouhou-12400000-Hokenkyoku/0000039891.pdf (accessed 2016-04-28)
[21] Mitsutake N, Fukuda T, Furui Y. A Study on Specific Health Guidance Targets Using Specific Health Checkup Data and Medical expenditure Data. Journal of Health and Welfare Statistics. 2010;57:8-13. (In Japanese)
[22] Okamoto E. Effects of health guidance on outpatient and pharmacy expenditures: a disease- and drug-specific 3-year observational study using propensity-score matching. Journal of Epidemiology. 2013;23: 262-269.
[23] Ishikawa Y, Imai H, Nakao H, Saito S, Fukuda Y. A Study on the Effects of Preventive Intervention Policy for Specific Health Guidance: A Causal Analysis by Trend Scores Using a Large-Scale Database. Journal of Health and Welfare Statistics. 2013;60:1-6. (In Japanese)
[24] LaCroix AZ, Lang J, Scherr P, Wallace RB, Cornoni-Huntley J, Berkman L, et al. Smoking and mortality among older men and women in three communities. New England Journal of Medicine. 1991;324:1619-1625.
[25] Ezzati M, Lopez AD. Estimates of global mortality attributable to smoking in 2000. Lancet. 2003;362:847-852.
[26] Izumi Y, Tsuji I, Ohkubo T, Kuwahara A, Nishino Y, Hisamichi S. Impact of smoking habit on medical care use and its costs: a prospective observation of National Health Insurance beneficiaries in Japan. International Journal of Epidemiology. 2001;30:616-621.