Nano-visualization of proteins in action using high-speed AFM
Takayuki Uchihashi, Noriyuki Kodera, and Toshio Ando
1. Abstract
Direct and real-time visualization of single protein molecules is a powerful approach to understanding how they operate to function. Recent advances of high- speed atomic force microscopy (HS-AFM) provide a new opportunity to visualize dynamic events of label-free proteins in action under physiological conditions, at subsecond to sub-100 ms temporal and submolecular resolution. This chapter first overviews HS-AFM techniques essential for fast and low-invasive imaging of pro- teins. Then, are highlighted recent imaging studies on myosin V walking on an ac- tin filament, rotary catalysis of rotorless F1-ATPase, and processive run of cellu- lase hydrolyzing cellulose fibers.
2. Introduction
Dynamic action of proteins, such as their conformational change and dy- namic interplay with interaction partners, are crucial to their biological functions.
To reveal the dynamic behavior of proteins, single-molecule approaches are indis- pensable because the molecules behave in an unsynchronized manner and there- fore it is difficult to monitor their dynamics by ensemble-average experiments.
Fluorescence microscopy has been widely used to study the functional behavior of single protein molecules (Peterman et al., 2004; Joo et al., 2008; Roy et al., 2008;
Yanagida and Ishii, 2008). However, it only visualizes featureless fluorescent spots. Moreover, what we can know thereby is only about the behavior of a se- lected portion of the labeled protein. Namely, protein molecules themselves are invisible in the observations. Therefore, inferences have to be made to bridge the gap between the observed behavior of fluorescent spots and the actual behavior of labeled protein molecules. Consequently, it takes a considerably long time until reaching a persuasive conclusion on how a protein dynamically acts while func- tioning.
Atomic force microscopy (AFM) (Binnig et al., 1986) has made it possible for the first time to visualize the surface topography of samples at single- nanometer resolution even in liquid environments (Drake et al., 1989; Weisenhorn et al., 1989). In the early stage, pioneering studies explored this new capability by visualizing various biological samples under physiological conditions (Lindsay et al., 1989; Weisenhorn et al., 1989; Hansma et al., 1993; Schabert and Engel, 1994;
Müller et al., 1995; Shao and Yang, 1995; Walz et al., 1996; Müller and Engel, 1999). Moreover, several groups attempted to visualize dynamic biological processes (Bezanilla et al., 1994; Guthold et al., 1994; Kasas et al., 1997; Lin et al., 1999; Oberleithner et al., 2000). For example, the clotting process of fibrin (Drake et al., 1989), viral infection of isolated cells (Häberle et al., 1992), and an- tibody binding to an S-layer protein (Ohnesorge et al., 1992) were imaged at ~1 min or longer intervals. So, in the early stage after the advent of AFM, researchers were already well aware that innovative biological studies would be opened by a new approach, i.e., visualization of dynamic events occurring with biological samples using AFM. In fact, one of the inventers of AFM, Gerd Binnig, men- tioned as “In biology, use of the force microscope will probably become quite common because of its ability to deliver films of processes” (Binnig, 1992). Nev- ertheless, we had to wait long until 2008 for the establishment of the high-speed AFM (HS-AFM) instrumentation (Ando et al., 2008).
Establishing both high-speed and low-invasive performances of AFM re- quired lengthy efforts at solving various technical problems. In the early stage, small cantilevers (Schäffer et al., 1997; Ando et al., 2001), a fast scanner (Ando et al., 2001), a fast amplitude detector (Ando et al., 2001), and an optical beam def- lection (OBD) sensor for detecting deflection of a small cantilever (Schaሷffer et al., 1996; Ando et al., 2001) were developed. Using HS-AFM equipped with some of these devices, fast imaging were attempted to visualize dynamic events of proteins (Viani et al., 2000; Ando et al., 2001). However, it was evident that the bandwidth of feedback control to maintain the tip-sample interaction force constant was not high enough. Then, we further developed smaller cantilevers (Kitazawa et al., 2003; Ando et al., 2008), a faster z-scanner (Fukuma et al, 2008), an active damp- ing technique for the z-scanner (Kodera et al., 2005), a new proportional-integral- derivative (PID) feedback controller (Kodera et al., 2006), a compensator for drift in cantilever excitation efficiency (Kodera et al., 2006), and a fast amplitude de- tector with low noise performance (Ando et al., 2008).
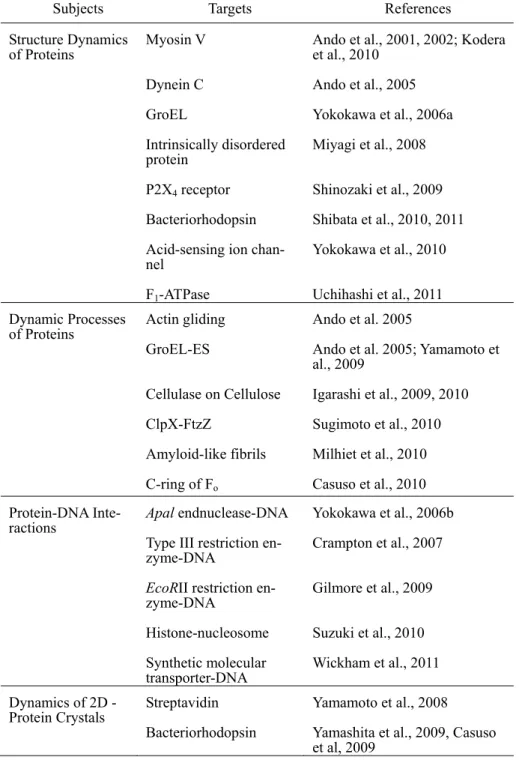
Going through these developments and the proof-of-principle stage, HS- AFM has now moved to a new stage where this new microscopy can be used to provide new insights into the functional mechanism of proteins. Various objects and dynamic events have already been imaged by HS-AFM (Table 1). Although only imaged from the top direction, the whole topography of proteins and their minute temporal changes are visualized in some of these studies. Unlike fluores- cence microscopy, various dynamic events of a molecule appear in the AFM mov- ie without planned selection, meaning that both expected and unexpected dynamic molecular behaviors can appear simultaneously. Therefore, we can have a great chance of learning details of several facts of molecular action in one imaging ex- periment. Moreover, the molecular action that appears on video can often be inter- preted straightforward without sophisticated analysis, leading to attainment of convincing conclusions. These excellent general features of HS-AFM imaging significantly facilitate and accelerate our understanding of the functional mechan- ism of proteins. In this chapter we first briefly overview the key techniques for realizing HS-AFM, and then highlight recent representative results on functioning proteins obtained by my group. For more imaging studies, see a recent review (Ando, 2012).
3. Overview of High-speed-AFM Instrumentation 3.1. Overall Design of HS-AFM System
Among various operation modes of AFM, our HS-AFM system (Fig. 1) uses the tapping mode in which the cantilever tip is vertically oscillated at the first resonant frequency of the cantilever (Hansma et al., 1993; Zhong et al., 1993;
Putman et al., 1994). The intermittent tip-sample contact eliminates the lateral force acting between tip and sample and thus prevents weakly adsorbed proteins from being dislodged from the substrate surface. Upon tip-sample contact, the cantilever oscillation amplitude decreases. During lateral scanning of the sample stage, the change in the amplitude is measured and then the sample stage is moved in the z-direction to recover the amplitude back to a given value (i.e., set point) through feedback control. For fast and nondestructive imaging of biological sam- ples, the feedback control should be performed fast and precisely. Therefore, all devices contained in the feedback loop; i. e., the cantilever, the OBD sensor, the amplitude detector, the PID feedback circuit, the piezoactuator-based scanner, and the piezodriver, are optimized for their fast response.
The HS-AFM system includes an original inverted optical microscope. An objective lens with a long working distance used for the optical microscope is a part of the OBD sensor, and is also used for viewing the cantilever and sample stage under the optical microscope, via a digital camera or a CCD camera. A glass slide, to which a cantilever holder and a liquid cell are attached, is placed on the optical microscope stage. A cantilever chip is held in the holder so that its tip points upwards (opposite to the way in conventional AFM). A sample stage at- tached to the z-scanner and facing downwards is placed over the cantilever. The instrument is now commercially available from the Research Institute of Biomole- cule Metrology, Ltd. (Tsukuba, Japan).
3.2. Small Cantilevers and OBD Sensor
The cantilevers to be used in HS-AFM should have a high-resonant fre- quency and a small spring constant to meet both fast and low-invasive imaging capabilities, and thus, should be fabricated to a small size. We use small rectangu- lar cantilevers, so-called beak-like cantilevers, made of silicon nitride (Kitazawa et al., 2003). The dimensions are ~6 μm long, ~2 μm wide and ~90 nm thick (BL- AC7DS-KU2, custom-made by Olympus). They have resonant frequencies ~3.5 MHz in air and ~1.2 MHz in water, a spring constant ~0.2 N/m, and a quality fac- tor ~2 in water. Slightly larger cantilevers (9-10 μm long, 2 μm wide, and 130 nm thick; BL-AC10DS, Olympus, Tokyo) with resonant frequencies 1.5 MHz in air and 0.6 MHz in water, a spring constant 0.1 N/m, and a quality factor Q ~2 in wa- ter are available from Olympus, Atomic Force F&E GmbH (Mannheim, Germa- ny), Asylum Research (Santa Barbara, USA), and Bruker (Calle Tecate, USA).
The apex of the beak-like tip is not small enough (25-100 nm) to acquire high-resolution images. We usually use electron-beam-deposited (EBD) tip grown
on the original beak-like tip using a field emission scanning electron microscope (FE-SEM) (Wendel et al., 1995). As a sublimate for the EBD tip, phenol powder is used. A spot-mode electron beam is focused onto each original tip to produce a
~1µm long needle composed of amorphous carbon at a growth rate of ~17 nm/s.
The EBD tip is sharpened by oxygen or nitrogen plasma etching to an apex radius of ~4 nm (~0.5 nm at the best case).
In our OBD sensor (Ando et al., 2001), an incident laser beam is focused onto a small cantilever through a ×20 objective lens with a long working distance 24 mm (Fig.1). The light reflected back from the rear side of the cantilever is col- lected and collimated using the same objective lens and guided to a quadrant-cell Si PIN photodiode. The focused spot is 3-4 μm in diameter. The incident and re- flected beams are separated using a quarter wavelength plate and a polarization beam- splitter. The small cantilevers provide the OBD sensor with high deflection detection sensitivity (10-20 times higher than conventional large cantilevers) be- cause the angle change at the cantilever’s free end is 10-20 times larger for a given vertical displacement of the tip.
3.3. Amplitude Detector and Feedback Controller
The oscillation amplitude of the cantilever should be detected as fast as possible with a high signal-to-noise ratio. A conventional RMS-to-DC converter and a lock-in amplifier require at least several oscillation cycles to output an accu- rate amplitude signal. We developed two types of fast amplitude detectors, a peak- hold type (Ando et al., 2001) and a Fourier type (Kokavecz et al., 2006; Ando et al., 2008). In the peak-hold analogue circuit, the peak and bottom voltages of the output signal from the OBD senor are held and their difference is output as an am- plitude signal. The amplitude signal is renewed every half cycle of cantilever os- cillation. In the Fourier type (analogue/digital hybrid system), Fourier cosine and sine coefficients (a1, b1) are calculated every one cycle of cantilever oscillation and a signal proportional to (a12 + b12)1/2 is output. The Fourier method is less sus- ceptible to cantilever’s thermal fluctuations in the deflection than the peak-hold method.
For the feedback control under a small tapping force condition, the ampli- tude set point should be set close to the free oscillation amplitude of the cantilever.
Under this condition, tip ‘parachuting’ often occurs and thus the error signal is sa- turated at a small value for a while. ‘Parachuting’ means that the cantilever tip completely detaches from the sample surface at a steep down-hill region of the sample and time elapses until the tip lands on the surface again. To reduce or elim- inate the parachuting time, we developed a dynamic PID controller in which the gain parameters are dynamically changed depending on the cantilever oscillation amplitude (Kodera et al., 2006). This dynamic PID controller can maintain the feedback bandwidth at a high level even when the amplitude set point is close to the cantilever free oscillation amplitude, making high-speed imaging compatible with low-invasive imaging. In addition, an electronics developed to compensate for the drift in the cantilever excitation efficiency allows stable imaging under the small tapping force condition (Kodera et al., 2006).
3.4. Scanner and Active Damping
We developed three types of scanners with different maximum scan ranges.
Type-1: x = 1 μm, y = 4 μm, z = 1 μm; Type-2: x = 5 μm, y = 5 μm, z = 2 μm; and Type-3: x = 40 μm, y = 40 μm, z = 6 μm. Type-1 is used for dynamic imaging of isolated proteins, while the latter two types are used for dynamic imaging of larger objects such as bacteria and eukaryotic cells. Each type of scanner is composed of three piezoactuators that displaces the sample along the x-, y-, and z-axes. The slowest y-scanner displaces a block of the x- and z-scanners, the x-scanner dis- places a block of the z-scanner and the z-scanner displaces a glass-rod sample stage. Each block is connected with the surrounding base through a pair of flex- ures to achieve small crosstalk between the three displacement axes (Ando et al., 2008). Since the x-piezo is sandwiched between two flexures, the center of mass of the x-piezo is unchanged, minimizing impulsive force exerting to the surround- ing base and thus minimizing induction of vibrations. To counteract the impulsive force produced by the z-scanner displacement, two identical piezoactuators are at- tached to a supporting base and are displaced simultaneously with the same length in the opposite direction (Ando et al., 2001). For the fastest z-scanner with a first resonant frequency 370 kHz, a piezoactuator is held at the four rims parallel to the displacement direction in order to counteract the impulsive force (Fukuma et al., 2008).
The first resonant frequencies of the z-scanners are those of the actuators used, meaning that resonance arising from the designed structure occurs at higher frequencies. We developed an active damping technique to eliminate the resonant vibrations of the z-scanners using a new Q-controller with corresponding mock z- scanners comprised of LRC circuits (Kodera et al., 2005).
3.5. Highest Possible Imaging Rate
As a consequence of the whole development described above, we have achieved the highest feedback bandwidth fB ~110 kHz. This is at least 10-times higher than other nominal high-speed AFM instruments. The highest possible imaging rate Rmax is a function of fB, the scan range in the x-direction W, the number of scan lines N, the smallest sample surface corrugation to be observed λ, and the sample fragility (Ando et al., 2008; Ando, 2011). The overall relationship can be ex- pressed as
Rmax = 2λfBθm /(πWN), (1)
where θm represents an sample fragility-dependent allowable maximum phase de- lay in tracing the sample surface. Even for relatively fragile molecules (θm <
~20°), we can capture images at 12 frames/s (fps) under the condition of W = 200 nm, N = 100, and λ = 10 nm without disturbing the physiological function of the molecules. .
4. Imaging of Protein Molecules in Action
Some HS-AFM movies showing the dynamic behavior of proteins described below can be seen at http://www.s.kanazawa-u.ac.jp/phys/biophys/index.htm or at the corresponding publishers’ homepages.
4.1. Myosin V
4.4.1. General Properties of Myosin V
Myosin V (M5) is a two-headed molecular motor that transports intracellu- lar vesicles along actin filaments from the central regions of cells to the periphery (see a review; Sellers and Weisman, 2008). Each N-terminal motor domain con- taining actin-binding and ATP hydrolysis sites is connected to an extended neck with six calmodulins (or five calmodulins and a light-chain). The region contain- ing the motor and neck domains is called “head”. After the neck region, M5 is di- merized by a coiled-coil tail which is followed by a C-terminal globular tail do- main capable of binding to various cargos via adapter proteins (Fig. 2a). In order to elucidate the functional mechanism of M5, numerous studies have been done using biophysical and biochemical techniques. Using fluorescence microscopy and optical tweezers, it has been demonstrated that the single molecules move processively along actin filaments towards the plus ends of the filaments (Mehta et al., 1999; Sakamoto et al., 2000) in a hand-over-hand fashion (Forkey et al., 2003;
Yildiz et al., 2003) with a 36-nm step for every ATP hydrolysis cycle (Sakamoto et al., 2008). Here, “hand-over-hand” means that the two heads alternate the lead- ing and trailing positions at each step, very analogous to “walking”. However, the protein molecules themselves are invisible in the observations and have therefore been visualized by electron microscopy only in the stationary states (Walker et al., 2000; Burgess et al., 2002; Oke et al., 2010). Thus, a comprehensive description of the molecule in action has not been accomplished until our recent HS-AFM study (Kodera et al., 2010). We describe below the outline of the results.
4.4.2. Unidirectional Hand-over-hand Movement
As a substrate, we used a mica-supported lipid bilayer composed of an elec- trically natural phospholipid, a biotinylated phospholipid, and a positively charged phospholipid. The bilayer is in a gel-phase at room temperature (Yamamoto et al., 2010). Partially biotinylated actin filaments were immobilized on the surface through streptavidin molecules with a low surface density (Fig. 2b). The positively charged lipid facilitated observing the characteristic sideways configuration of moving M5, allowing us to acquire high resolution images. The successive AFM images captured at 7 fps in the presence of ATP (Fig. 3a) shows M5-HMM (tail- truncated M5, bottom in Fig. 2a) moving processively along an actin filament with discrete ~36-nm steps. The two-headed bound M5-HMM showed unique structur- al features without exception, as illustrated in the bottom of Fig. 3a; the neck- motor domain junction appears smooth in the leading head whereas it is V-shaped in the trailing head, because the neck regions emerge from different parts of the motor domain. The short coiled-coil tail was mostly tilted towards the direction
opposite to the moving direction. These features are totally consistent with those shown in electron micrographs (Walker et al., 2000), and can be used to determine the actin polarity when bound M5-HMM is stationary. However, the AFM movie could not resolve detailed stepping behaviors because the step completed within a frame.
To slow down the step motion, we additionally attached streptavidin mole- cules on the substrate surface as moderate obstacles to the advance, which suc- cessfully allowed us to directly visualize the detailed molecular processes during a step (Fig. 3b). After trailing head detachment from actin, the nearly straight lead- ing head appeared to spontaneously swing from the reverse arrowhead orientation toward the arrowhead orientation, irrefutably showing for the first time the swing- ing lever-arm motion initially proposed for muscle myosin (Huxley, 1969). The detached trailing head rotationally diffused around the advancing neck-neck junc- tion and then bound to a frontward actin site as a new leading head, completing one step. Thus, the detailed molecular behavior during hand-over-hand movement was directly visualized at unprecedented high spatiotemporal resolution. In the AFM movie, we did not observe other behaviors of M5-HMM expected from the
“inchworm” (Hua et al., 2002) model proposed for kinesin and the “biased diffu- sion” (Okada et al., 2007) model proposed for myosin, at least with the temporal resolution used.
4.4.3. Tension Generation and Foot Stomp
The seemingly spontaneous rotation of the leading head following trailing head detachment suggests that intramolecular tension for the advance has already existed in the two-headed bound molecule. In this bound state, the trailing head is in the arrowhead orientation. This orientation is natural one at least for the ADP- bound and nucleotide-free myosin heads, and hence, the intramolecular tension is not produced by the bound trailing head. On the other hand, the leading head is not in the natural orientation (i.e., in the reverse arrowhead orientation) and hence pays energy cost to generate the intramolecular tension. In fact, the bound leading head is slightly curved outwards while the trailing head is straight (Fig. 3a). Upon trailing head detachment, the constraint keeping the bound leading head in the un- natural orientation is removed and hence the leading head spontaneously rotates forwards, meaning that the bound leading head is in the strained pre-stroke state and thus the lever arm swing is not accompanied by chemical transitions. This in- ferred view was reinforced by the observation that the short coiled-coil of two- headed bound M5-HMM was sometimes unfolded and then the leading head ro- tated from the reverse arrowhead orientation to the arrowhead orientation (Fig.
4a), very much similar to the swinging lever arm motion observed as powerstroke in the hand-over-hand movement.
In general, during the actomyosin ATPase cycle, the strained pre-stroke state has been thought to be always formed through Pi release from an ADP-Pi bound head weakly interacting with actin (Goldman, 1987; Geeves and Holmes, 1999). Thus, it may be considered that the strained pre-stroke state, which is formed directly by the binding of ADP-bound leading head to actin, does not par- ticipate in the forward step in ATP. However, we observed a molecular behavior
in ATP that indicates that it does participate. In two-headed bound M5-HM, both of the motor domains frequently exhibited brief dissociation and reassociation on the same actin filament (or a brief translocation by around ± 5nm along the actin filament), whereas M5-HMM remained at approximately the same position on the filament (Fig. 4b). We have termed this behavior “foot stomp”. The briefly de- tached leading head does not carry bound Pi because Pi is already released from an ADP-Pi-bound M5 head immediately after its initial binding to actin (De La Cruz et al., 1999). This immediate release of Pi is a general feature of the acto- myosin ATPase reaction. Nevertheless, the detached leading head with only ADP bound rebinds to actin, still in the reverse arrowhead orientation, and then swings forward following trailing head detachment. The detachment of leading head dur- ing foot stomp is not caused by ATP binding to the leading head. As described lat- ter, a nucleotide-free leading head is often sharply bent. We never observed a sharply bent leading head before its foot stomp.
4.4.4. Mechanism for Hand-over-hand Movement
The leading head of two-headed bound M5-HMM was always straight (slightly curved outwards) in ADP or ATP, while it was often sharply bent in the nucleotide-free condition (Fig. 4c). Therefore, just by looking at the conformation of leading head, we can judge whether or not the leading head contains nucleo- tides. To estimate the ADP dissociation rate constant at the leading head, M5- HMM bound to actin in various concentrations of ADP was observed, and then, the lifetime of straight leading head was analyzed as a function of ADP concentra- tion. The ADP dissociation rate constant at the leading head was estimated to be 0.1/s. This means that ADP is released from the leading head every 10 s, on aver- age. However, M5-HMM walks many steps for 10 s, meaning that ADP does not dissociate from the leading head. That is, before ADP dissociation, the leading head is switched to the trailing head during walking. ADP dissociation, and the subsequent ATP binding, and the resulting detachment from actin solely occurs at the trailing head. This is the basis underlying the processive hand-over-hand movement. This mechanism was inferred previously from various indirect expe- riments (Rosenfeld and Sweeney, 2004; Purcell et al., 2005; Veigel et al., 2005;
Forgacs et al., 2008; Oguchi et al., 2008; Sakamoto et al., 2008) but is now clearly and directly demonstrated by the high-speed AFM observation. Moreover, we found that the foot stomps occurred more frequently at the leading head than at the trailing head. This asymmetry of foot stomp frequency between the two heads suggests that the leading head would be less susceptible to the catalytic activation by actin, which might contribute to some extent to the kinetic asymmetry between the two-heads.
3.2. Rotary Catalysis of Rotorless F1-ATPase
3.2.1. General Properties and Cooperativity of F1-ATPase
ATP synthase, which is one of the most abundant proteins in organisms, synthesizes ATP from ADP and Pi using the electrochemical energy of proton gradient across membranes (Boyer, 1993, 1997). It consists of two coupled rotary motors, called Fo and F1. Fo is embedded in membranes while water-soluble F1 is exposed to the solution. They can be separated and studied individually. F1 is comprised of five different subunits with a composition of α3β3γδε (Todd et al., 1980; Walker et al., 1985). The three α and β subunits are arranged alternately to form a hexameric ring and the central cavity of the hexamer is occupied by the γ subunit. The minimum rotary unit of F1 is the α3β3γ subcomplex, in which the cen- tral γ shaft rotates within the α3β3 stator ring when ATP is hydrolyzed by the ring (Matsui and Yoshida, 1995) . The catalytic site of F1 is formed at the interface be- tween the α and β subunits. The catalytic residues mainly reside in the β subunit (Abrahams et al., 1994). The rotational motion of γ has been demonstrated by sin- gle-molecule optical microscopy in which optical markers are attached to the γ subunit (Noji et al., 1997; Yasuda et al., 1998).
In the earliest obtained crystal structure shown in Fig. 5a, three catalytic sites are in different nucleotide-bound states; one binds to an ATP analog (βTP
and αTP), another binds to ADP (βDP and αDP), and the third binds to none (βE and αE). Both βTP and βDP swing the C-terminal domain toward γ, assuming an in- wardly retracted conformation, whereas βE swings the domain away from γ, as- suming an outwardly extended conformation. Because the two conformational states seem to push γ or be pushed by γ as shown in Fig. 5b and c, it was consi- dered that the β-γ interaction controls the conformational and catalytic states of individual β subunits and thus is essential for sequential torque generation (Wang and Oster, 1998). Some biochemical studies are considered to suggest that the α3β3 ring alone does not possess intrinsic cooperativity and γ mediates interplays among β’s (Kaibara et al., 1996; Capaldi, 1998; Nakamoto et al., 1999) . On the other hand, although very few, there are biochemical studies which suggest that the intrinsic cooperativity is engendered by the α3β3 ring alone (Yoshida and Allison, 1990; Aloise et al., 1991).
Recently, it was reported that even when the most interaction sites between β and γ are abolished, the γ still rotates unidirectionally (Hossain et al., 2006, 2008; Furuike et al., 2008) . However, single-molecule optical microscopy does not allow us to directly examine whether the intrinsic cooperativity in the α3β3 ring is the core responsible for sequential torque generation since attachment of a probe to the rotary shaft is required for visualization. We addressed this issue by directly imaging the ATP-driven conformational transition of β’s in the isolated α3β3 ring using high-speed AFM (Uchihashi et al., 2011).
3.2.2. AFM Observation of α3β3 Subcomplex without ATP
The α3β3 subcomplex with Lys7-tag at the N-terminus of β was covalently im- mobilized on a mica surface treated first with 3-aminopropyl-triethoxysilane and then with glutaraldehyde. Therefore, the C-terminal domain of the α3β3 subcomp- lex is at the top side. As shown in Fig. 6a, a ring structure with six high protru- sions was observed under the nucleotide free conditions. Fig. 6b shows an aver- aged high-resolution image of the α3β3 subcomplex without nucleotide. This
image shows a pseudo-six-fold symmetric ring in which three subunits alternately arranged in the ring are higher than the other three. The simulated AFM image of the C-terminal side of the ring constructed from the crystal structure of nucleotide- free α3β3 subcomplex (Shirakihara et al., 1997) well reproduced the observed im- age (Fig. 6c), indicating that the N-terminal side was in fact selectively attached to the mica, although a smaller crown corresponding to the N-terminal side was occasionally observed (Fig. 6d). The image was similar to a simulated image (Fig.
6e). Three β’s, all assuming the outwardly extended conformation in the crystal structure of the α3β3, gave three protrudent peaks in the simulated image as bright spots and thus the three subunits showing higher protrusions seen in the AFM im- age were identified as β’s.
When AMPPNP, which is a non-hydrolyzable ATP analog, was added, the ring became triangular and the central hole was obscure as shown in Fig. 6f. Three α’s having the lower protrusions retained the same conformation as those under the nucleotide-free condition and two of the three β’s retracted towards the center and at the same time lowered their protrusions. This structure did not change during the observation. A simulated image of α3β3 with bound nucleotides (Fig. 6h) which was constructed using the crystal structure (Abrahams et al., 1994) of F1
without γ (Fig. 6g) showed an asymmetric ring very similar to the observed image.
This excellent agreement indicates that only two β’s can assume the inwardly re- tracted conformation even in saturating AMPPNP, which is consistent with the previous observation that three β’s do not assume the inwardly retracted confor- mation simultaneously (Menz et al., 2001).
3.2.3. HS-AFM Observation of α3β3 Subcomplex in ATP
In the presence of ATP, the ring shape was very similar to that observed in the presence of AMPPNP but the ring showed distinct conformational dynamics;
each β underwent conformational transition between the outwardly extended high state (O-state) and the retracted low state (C-state) (Fig. 7a); the outwardly ex- tended and inwardly retracted conformations are well correlated with the high and low protrusion states, respectively (Fig. 7b). Prominent features observed are that when the O-to-C transition occurs at one β, the opposite C-to-O transition occurs simultaneously at its counterclockwise neighbor β in most cases as shown in Fig.
7a. By this cooperative effect, the CCO conformational state propagates in the counterclockwise direction as seen in the time evolution of the cumulated angle of the open-β position relative to the center of the ring (Fig. 7c).
The rate of rotational propagation of the CCO conformational state increased with increasing ATP concentration (2-4 μM), indicating that ATP binding is rate- limiting. The rate constant of the counterclockwise O-to-C shift in β at each ATP concentration was comparable with the corresponding initial rate of ATP hydroly- sis measured biochemically. Thus, ATP hydrolysis is well coupled with the O-to- C transition of β.
The interplay between β subunits in α3β3 responsible for the rotational propaga- tion of the CCO conformational state was further supported by the following ob- servation. A single subunit was occasionally dissociated from α3β3 during observa- tion (Fig. 7d), due presumably to the imperfect covalent binding of the
subcomplex to the mica surface and to transient strong tip-sample interaction.
Once one β is lost, the rotary propagation completely ceased (Fig. 7e), although some cooperative conformational transitions occurred between the remained β’s.
These results provide clear evidence that the structural basis of unidirection- al rotary catalysis is intrinsically programmed in the stator ring. Thus, the “γ- dictator” model (Furuike et al., 2008), which proposes that only the interaction with γ determines the conformational and catalytic states of β’s (Adachi et al., 2007; Watanabe et al., 2010), is not valid. On the other hand, the ATP-binding rate and the efficiency of unidirectionality of the CCO state propagation are dis- tinctly lower than those of F1 (Uchihashi et al., 2011). Thus, the interaction with γ is dispensable but still important for the rapid and precise rotary catalysis. Our findings are not inconsistent with the observations that the rate of the catalytic reaction are apparently under the control of the rotary angle of γ (Itoh et al., 2004;
Rondelez et al., 2005; Iko et al., 2009). The intrinsic interplay among β’s would reinforce the catalytic control by γ; even if γ tightly interacts with only one β, it still can act on all β’s through β-β interplay.
3.3. Processive movement and traffic jams of cellulase on cellulose surface
3.3.1. Genral Issues of Cellulose Hydrolysis by Cellulase
Cellulase, which is produced mainly by cellulolytic fungi and bacteria, is a group of enzymes that degrade the plant polysaccharide called cellulose, a linear polymer connected by β-1,4 linkages (Ryu and Mandels, 1980; Hon, 1994). Al- though all types of cellulases can hydrolyze amorphous cellulose, only a limited number of cellulases can hydrolyze crystalline cellulose (Teeri, 1997). The en- zymes that hydrolyze crystalline cellulose are called cellobiohydrolases (CBHs) because the major product of the reaction is cellobiose, a soluble β-1,4-glucosidic dimer (Teeri et al., 1998) . CBHs share a similar two-domain structure consisting of a catalytic domain (CD) and a cellulose-binding domain (CBD) (Abuja et al., 1988a; Abuja et al., 1988b; Abuja et al., 1989). The two domains are connected by a highly O-glycosylated linker region (Rouvinen et al., 1990; Divne et al., 1994, 1998). At the initial step of the reaction, the cellulase enzymes adsorb onto the surface of crystalline cellulose via the CBD, and then glucosidic linkages are hy- drolyzed by the CD (Johansson et al., 1989; Ståhlberg et al., 1991). Loss of the CBD causes a significant decrease of crystalline cellulose degradation, but has a less effect on the hydrolysis of soluble or amorphous cellulose, suggesting that ad- sorption of the enzymes on the surface via the CBD is essential for the effective hydrolysis of crystalline cellulose (Ståhlberg et al., 1991). The CD has a relatively long tunnel formed by surface loops with catalytic amino acids extending from the central fold of the CD. A cellulose chain threads through the tunnel and is hydro- lyzed (Divne et al., 1994, 1998). Therefore, it has been considered that CBHs hy- drolyze crystalline cellulose chains in a processive manner, making consecutive cuts without releasing the chain (Davies and Henrissat, 1995; Reverbel-Leroy et
al., 1997), but this idea has not been experimentally verified until recent HS-AFM imaging studies (Igarashi et al., 2009, 2011). The CBHs are categorized into two main types; CBH I hydrolyzes cellulose from the reducing end of cellulose, while CBH II does from the nonreducing end (Henrissat and Bairoch, 1993). The CD of CBH I belongs to the glycoside hydrolase (GH) family 7 and the CD of CBH II belongs to the GH family 6.
Although the kinetics of crystalline cellulose hydrolysis by CBHs has thus far been investigated intensively, the mechanism of crystalline cellulose degradation by CBHs is still elusive. For example, although it is known that the hydrolysis rate decreases rapidly with time (Eriksson et al., 2002), its mechanism has not yet been understood. Furthermore, several studies indicate that CBH I and CBH II types of enzymes display strong synergy for the hydrolysis of cellulose (Henrissat et al., 1985; Boisset et al., 2000) but the reason for the synergy effect is not yet revealed.
The main reason for the difficulty in understanding these issues is the lack of ana- lytical methods to monitor the enzymatic reaction at the solid/liquid interface.
3.3.2. Processive Run of Cellulase on Cellulose Iα
The dynamic behavior of CBHs on a crystalline cellulose substrate were vi- sualized using HS-AFM (Igarashi et al., 2009, 2011). We first observed a CBH I (TrCel7A) secreted from the industrially important cellulolytic ascomycete fungus Trichoderma reesei. TrCel7A is one of the best-studied CBHs (Abuja et al., 1989;
Henrissat, 1991; Henrissat and Bairoch, 1993; Divne et al., 1994; Linder, 1997;
Henrissat et al., 1998; Boraston et al., 2004). We used a crystalline cellulose pre- pared from the cell wall of green algae, which consists of mainly cellulose Iα
(Hon, 1994). As a substrate surface, we chose highly ordered pyrolytic graphite (HOPG) because its hydrophobic surface has a high affinity for the hydrophobic surface of the crystalline cellulose. Fig. 8a shows HS-AFM images of TrCel7A molecules moving unidirectionally and processivly on the cellulose Iα surface.
This movement of TrCel7A was observed only on the top surface of the cellulose crystal where the individual molecules were moving in a line. Interestingly, as shown in Fig. 8b, the movement of molecules was often halted due probably to the presence of an obstruction on the crystalline cellulose surface. When the move- ment of a molecule was halted, following molecules were blocked and/or slowed down (Igarashi et al., 2011). These phenomena resemble the movement of traffic on a road.
To evaluate the velocity of the movement, we tracked the center of each molecule. Fig. 8c shows the time courses of displacement for seven molecules.
Some molecules move continuously without stopping, whereas the movement of some molecules were occasionally halted or slowed down (the open green and closed red plots in Fig. 8c). Fig. 8d shows a histogram of the measured velocity values. The histogram is comprised of two Gaussian distributions of the average velocity with mean ± SD values of –0.32 ± 3.4 and 7.1 ± 3.9 nm/s. This is consis- tent with the idea that TrCel7A has two modes of adsorption on a cellulose sur- face; the productive adsorption mode in which both CD and CBD contribute to the binding and the non-productive adsorption mode in which the enzyme binds only via the CBD (Ståhlberg et al., 1991). The overall average velocity for many mole-
cules was 5.3 ± 4.9 nm/s. From the velocity, the hydrolysis rate is estimated to be 5/s taking into account that one hydrolysis drives the movement of the molecule by 1 nm which is the length of cellobiose. Surprisingly, this value is 500 times larger than that (0.01/s) estimated biochemically (Nidetzky et al., 1994). This in- consistency is presumably because in the biochemical estimation of the hydrolysis rate, it is assumed that all molecules productively work on the cellulose surface.
However, the number of reduced ends available for TrCel7A binding is limited and moreover the movement of many molecules is hampered by the traffic jams.
3.3.3. Processive Run of Cellulase on Cellulose IIII
The fabric form of cellulose Iα can be converted to cellulose IIII polymorph by supercritical ammonia treatment (Igarashi et al., 2007). Although it is known that this conversion dramatically enhances the cellulose hydrolysis by TrCel7A (Igarashi et al., 2007), its mechanism has been unknown. We investigated this is- sue by visualizing the degradation of cellulose IIII (Igarashi et al., 2011). Fig. 9a shows successive images of TrCel7A molecules processively moving on a cellu- lose IIII surface. The number of molecules on the cellulose IIII surface appears larger than that on the cellulose Iα surface shown in Fig. 9a although the velocity of the molecules on both surfaces are similar. In the case of cellulose Iα, the mole- cules only slid along limited lanes, whereas on cellulose IIII TrCel7A molecules moved over almost the whole exposed surface. This is due probably to the differ- ence of affinity for TrCel7A between cellulose Iα and IIII. Comparing the crystal- line shapes of cellulose Iα and IIII (Nishiyama et al., 2003; Wada et al., 2004), cel- lulose Iα has a hydrophobic surface (where the enzyme molecule can bind) at (110) surface (Fig. 9c), whereas cellulose IIII has a hydrophobic surface not only at (110) surface but also at (100) surface as shown in Fig. 9d. Therefore, cellulose IIII has more lanes available for cellulase movement and thus causes less traffic jams. This is the mechanism underlying the enhanced degradation of cellulose IIII.
The traffic jams occurring on cellulose IIII showed a unique feature that did now appear on cellulose Iα. After several additional molecules were blocked, the enzyme molecules started to move again on the surface and at the same time a cel- lulose bundle was peeled off from the crystalline cellulose as shown in Fig. 9b.
This phenomenon suggests that one enzyme molecule is unable to overcome an obstacle to the advance but accumulation of molecules behind the blocked mole- cule overcomes the obstacle. As a result, the blocked molecules re-start linear movement from the point where the first molecule had stopped.
3.3.4. Synergetic Hydrolysis by TrCel7A and TrCel6A
As shown in Fig. 10a, two major CBHs, TrCel7A and TrCel6A synergisti- cally increase the efficiency of cellulose IIII hydrolysis. This effect has been called exo-exo synergy (Nidetzky et al., 1994). Previous transmission electron micro- scopic observations of a crystalline cellulose after partial hydrolysis by both TrCel6A and TrCel7A showed that the two enzymes degrade the cellulose from different ends of the crystal; TrCel7A degrades the crystal from the reducing end, leading to fibrillation, thinning of the crystal, or narrowing of the crystal end, whe-
reas TrCel6A hydrolyzes the crystal from the non-reducing end, less processively than TrCel7A, thereby sharpening the crystal tip (Chanzy and Henrissat, 1985;
Imai et al., 1998). It is however difficult to explain this type of synergistic action based on their exoenzymatic activity. We imaged the hydrolytic process with crys- talline cellulose IIII in the presence of both TrCel6A and TrCel7A to understand the mechanism underlying the synergetic degradation (Igarashi et al., 2011).
Cellulose IIII was first imaged in the presence of TrCel6A alone. The ap- pearance of the cellulose crystals did not significantly change during incubation over ~ 8 min, even though many enzyme molecules were observed on the cellu- lose surfaces (Fig. 10b). After TrCel7A was additionally added, enzyme mole- cules started moving from many points on the cellulose surfaces, and the degrada- tion of crystalline cellulose was dramatically faster than the case with TrCel7A alone as shown in Fig. 10c. Eventually, the cellulose crystals almost disappeared at ~4 min after the addition of TrCel7A. The observed synergy was independent of the order of addition of TrCel6A and TrCel7A. A very similar synergy effect was also observed when both TrCel6A and TrCel7A were added simultaneously.
These results suggest that TrCel6A is also an endoenzyme and the synergy ob- served is therefore endo-exo synergy (Wood and McCrae, 1978), although TrCel6A is generally defined as an exo-glucanase (cellobiohydrolase). If so, TrCel6A generates nicks in the middle of crystalline cellulose, and these nicks be- come starting and ending points for TrCel7A activity.
The present results provide us with some clues to improving the efficiency of conversion from crystalline cellulose to cellobiose by cellulase enzymes. The fol- lowing devices will certainly improve the conversion efficiency; flattening the sur- face of crystalline cellulose to remove obstacles to the advance of the enzymes;
increasing the number of lanes by means of pretreatment of cellulose; combining exo- and endo-cellulase enzymes to increase the number of entrances and exits for the exoenzymes.
4. Concluding Remarks
Through the instrument development and proof-of-principle stages, HS- AFM is now established and can be used to visualize dynamic processes and structure dynamics of proteins and other biological molecules. This capability al- lows us to visually and directly understand how biomolecules operate to function.
As demonstrated by the three recent results highlighted in this chapter, HS-AFM can provide unique new insights into the functional mechanism of proteins unat- tainable with previous single-molecule techniques.
Other than the examples describe here, our HS-AFM instrument has already been applied to studying dynamics of various samples (Table 1); for instances, al- ternate binding of GroES to the two rings of GroEL (Yamamoto et al., 2009), dy- namics of protein 2D crystals (Yamamoto et al., 2008; Yamashita et al., 2009), wiggling motion of intrinsically disordered regions of FACT protein (Miyagi et al., 2008), photo-induced conformational change of bacteriorhodopsin (Shibata et al.,
2010, 2011) and so on. The HS-AFM apparatuses commercialized by RIBM (Tsukuba, Japan) have been used to study various targets (Yokokawa et al., 2006a, 2006b; Crampton et al., 2007; Shinozaki et al., 2009; Casuso et al., 2010; Milhiet et al., 2010; Sugimoto et al., 2010; Wickham et al., 2011). Thus, the application of this new microscopy is now expanding and will become a tool commonly used for biophysical studies in the near future.
Acknowledgements
The authors thank Daisuke Yamamoto, Hayato Yamashita, Mikihiro Shibata, Ryo- ta Iino, Hiroyuki Noji, Kiyohiko Igarashi, Hideki Kandori and present and pre- vious many students in Ando lab for collaborations or contributions to the works described in this chapter. Long-term financial support by NEDO, JST (CREST project), JSPS (Grant-in-Aid for Basic Research (S)), Knowledge Cluster Initia- tive, and the Mitsubishi Foundation is gratefully acknowledged.
References
Abrahams, J.P., Leslie, A.G.W., Lutter, R., and Walker, J.E. (1994). Structure at 2.8 Å resolution of F1-ATPase from bovine heart mitochondri. Nature 370:621–
628.
Abuja, P.M., Pilz, I., Claeyssens, M., and Tomme, P. (1988a). Domain structure of cellobiohydrolase II as studied by small angle X-ray scattering: close resemblance to cellobiohydrolase I. Biochem. Biophys. Res. Commun. 156:180–185.
Abuja, P.M., Schmuck, M., Pilz, I., Tomme, P., Claeyssens, M., and Esterbauer, H.
(1988b). Structural and functional domains of cellobiohydrolase I from trichoder- ma reesei. Eur. Biophys. J. 15:339–342.
Abuja, P.M., Pilz, I., Tomme, P., and Claeyssens, M. (1989). Structural changes in cellobiohydrolase I upon binding of a macromolecular ligand as evident by SAXS investigations. Biochem. Biophys. Res. Commun. 165:615–623.
Adachi, K., Oiwa, K., Nishizaka, T., Furuike, S., Noji, H., Itoh, H., Yoshida, M., and Kinosita, K. (2007). Coupling of rotation and catalysis in F1-ATPase revealed by single-molecule imaging and manipulation. Cell 130:309–321.
Aloise, P., Kagawa, Y., and Coleman, P.S. (1991). Comparative Mg2+-dependent sequential covalent binding stoichiometries of 3’-O-(4-benzoyl)benzoyl adenosine 5'-diphosphate of MF1, TF1, and the alpha 3 beta 3 core complex of TF1. The bind- ing change motif is independent of the F1 gamma delta epsilon sub. J. Biol. Chem.
266:10368–10376.
Ando, T. (2012) High-speed atomic force microscopy coming of age. Nanotech- nology 23:062001 (27 pp).
Ando, T., Kodera, N., Maruyama, D., Takai, E., Saito, K., and Toda, A. (2002). A High-Speed Atomic Force Microscope for Studying Biological Macromolecules in Action. Jpn. J. Appl. Phys. 41:4851–4856.
Ando, T., Kodera, N., Takai, E., Maruyama, D., Saito, K., and Toda, A. (2001). A high-speed atomic force microscope for studying biological macromolecules in action. Proc. Nat. Acad. Sci. USA 98:12468–12472.
Ando, T., Kodera, N., Uchihashi, T., Miyagi, A., Nakakita, R., Namashita, H., and Matada, K. 2005. High-speed Atomic Force Microscopy for Capturing Dynamic Behavior of Protein Molecules at Work. e-J. Surf. Sci. Nanotech. 3:384–392.
Ando, T., Uchihashi, T., and Fukuma, T. (2008). High-speed atomic force micro- scopy for nano-visualization of dynamic biomolecular processes. Prog. Surf. Sci.
83:337–437.
Bezanilla, M., Drake, B., Nudler, E., Kashlev, M., Hansma, P.K., and Hansma, H.G. (1994). Motion and enzymatic degradation of DNA in the atomic force mi- croscope. Biophys. J. 67:2454–2459.
Binnig, G. (1992). Force microscopy. Ultramicroscopy 42-44:7–15.
Binnig, G., Quate, C., Gerber, Ch. (1986). Phys. Rev. Lett. 56:930–933.
Boisset, C., Fraschini, C., Schulein, M., Henrissat, B., and Chanzy, H. (2000). Im- aging the enzymatic digestion of bacterial cellulose ribbons reveals the endo cha- racter of the cellobiohydrolase Cel6A from humicola insolens and its mode of synergy with cellobiohydrolase Cel7A. Appl. Environ. Microbiol. 66:1444–1452.
Boraston, A.B., Bolam, D.N., Gilbert, H.J., and Davies, G.J. (2004). Carbohy- drate-binding modules: fine-tuning polysaccharide recognition. Biochem. J. 382:
769–781.
Boyer, P.D. (1993). The binding change mechanism for ATP synthase--some probabilities and possibilities. Biochim. Biophys. Acta 1140:215-250.
Boyer, P.D. (1997). The ATP synthase--a splendid molecular machine. Annu. Rev.
Biochem. 66:717–749.
Burgess, S., Walker, M., Wang, F., Sellers, J.R., White, H.D., Knight, P.J., and Trinick, J. (2002). The prepower stroke conformation of myosin V. J. Cell Biol.
159:983–991.
Capaldi, R.A. (1998). Unisite Catalysis without Rotation of the γ - ε Domain in Escherichia coli F 1 -ATPase. Biochemistry 273:15940–15945.
Casuso, I., Kodera, N., Le Grimellec, Ch., Ando, T., and Scheuring, S. (2009).
High-resolution high-speed contact mode atomic force microscopy movies of pur- ple membrane. Biophys J, 97:1354-1361.
Casuso, I., Sens, P., Rico, F., and Scheuring, S. (2010). Experimental evidence for membrane-mediated protein-protein interaction. Biophys. J. 99:L47–L49.
Chanzy, H., and Henrissat, B. (1985). Unidirectional degradation of Valonia cellu- lose microcrystals subjected to cellulase action. FEBS Lett. 184:285–288.
Crampton, N., Yokokawa, M., Dryden, D.T.F., Edwardson, J.M., Rao, D.N., Ta- keyasu, K., Yoshimura, S.H., and Henderson, R.M. (2007). Fast-scan atomic force microscopy reveals that the type III restriction enzyme EcoP15I is capable of DNA translocation and looping. Proc. Natl Acad. Sci. USA 104:12755–12760.
Davies, G., and Henrissat, B. (1995). Structures and mechanisms of glycosyl hy- drolases. Structure 3:853–859.
Divne, C., Stahlberg, J., Reinikainen, T., Ruohonen, L., Pettersson, G., Knowles, J., Teeri, T., and Jones, T. (1994). The three-dimensional crystal structure of the catalytic core of cellobiohydrolase I from Trichoderma reesei. Science 265:524–
528.
Divne, C., Ståhlberg, J., Teeri, T.T., and Jones, T.A. (1998). High-resolution crys- tal structures reveal how a cellulose chain is bound in the 50 A long tunnel of cel- lobiohydrolase I from Trichoderma reesei. J. Mol. Biol. 275:309–325.
Drake, B., Prater, C., Weisenhorn, A., Gould, S., Albrecht, T., Quate, C., Cannell, D., Hansma, H., and Hansma, P. (1989). Imaging crystals, polymers, and processes in water with the atomic force microscope. Science 243:1586-1589.
Endo, M., and Sugiyama, H. (2009a). Three-dimensional DNA nanostructures constructed by folding of multiple rectangles. Nucleic Acids Symp. Ser. 53:81–82.
Endo, M., Hidaka, K., Kato, T., Namba, K., and Sugiyama, H. (2009b). DNA prism structures constructed by folding of multiple rectangular arms. J. Am. Chem.
Soc. 131:15570–15571.
Endo, M., Hidaka, K., and Sugiyama, H. (2011). Direct AFM observation of an opening event of a DNA cuboid constructed via a prism structure. Org. Biomol.
Chem. 9:2075–2077.
Endo, M., Katsuda, Y., Hidaka, K., and Sugiyama, H. (2010). Regulation of DNA methylation using different tensions of double strands constructed in a defined DNA nanostructure. J. Am. Chem. Soc. 132:1592–1597.
Endo, M., Sugita, T., Katsuda, Y., Hidaka, K., and Sugiyama, H. (2010). Pro- grammed-Assembly System Using DNA Jigsaw Pieces. Chem. Eur. J. 16:5362–
5368.
Eriksson, T., Karlsson, J., and Tjerneld, F. (2002). A Model Explaining Declining Rate in Hydrolysis of Lignocellulose Substrates with Cellobiohydrolase I (Cel7A) and Endoglucanase I (Cel7B) of Trichoderma reesei. Appl. Biochem. Biotech. 101:
41–60.
Fantner, G.E., Barbero, R.J., Gray, D.S., and Belcher, A.M. (2010). Kinetics of antimicrobial peptide activity measured on individual bacterial cells using high- speed atomic force microscopy. Nat. Nanotechnol. 5:280–285.
Forgacs, E., Cartwright, S., Sakamoto, T., Sellers, J.R., Corrie, J.E.T., Webb, M.R., and White, H.D. (2008). Kinetics of ADP dissociation from the trail and lead heads of actomyosin V following the power stroke. J. Biol. Chem. 283:766–773.
Forkey, J.N., Quinlan, M.E., Shaw, M.A., Corrie, J.E.T., and Goldman, Y.E.
(2003). Three-dimensional structural dynamics of myosin V by single-molecule fluorescence polarization. Nature 422:399–404.
Fukuma, T., Okazaki, Y., Kodera, N., Uchihashi, T., and Ando, T. (2008). High resonance frequency force microscope scanner using inertia balance support. Appl.
Phys. Lett. 92:243119 (3 pp).
Furuike, S., Hossain, M.D., Maki, Y., Adachi, K., Suzuki, T., Kohori, A., Itoh, H., Yoshida, M., and Kinosita, K. (2008). Axle-less F1-ATPase rotates in the correct direction. Science 319:955–958.
Geeves, M.A., and Holmes, K.C. (1999). Structura mechanism of muscle contrac- tion. Annu. Rev. Biochem. 68:687–728.
Gilmore, J. L., Suzuki, Y., Tamulaitis, G., Siksnys, V., Takeyasu, K., and Lyub- chenko, Y. L. (2009). Single-molecule dynamics of the DNA-EcoRII protein complexes revealed with high-speed atomic force microscopy. Biochemistry 48:
10492–10498.
Giocondi, M.-C., Yamamoto, D., Lesniewska, E., Milhiet, P.-E., Ando, T., and Le Grimellec, C. (2010). Surface topography of membrane domains. Biochim. Bio- phys. Acta—Biomembranes, 1798:703–718.
Goldman, Y.E. (1987). Kinetics of the actomyosin ATPase in muscle fibers. Ann.
Rev. Physiol. 49:637–654.
Guthold, M., Bezanilla, M., Erie, D.A., Jenkins, B., Hansma, H.G., and Busta- mante, C. (1994). Following the assembly of RNA polymerase-DNA complexes in aqueous solutions with the scanning force microscope. Proc. Natl Acad. Sci.
USA 91:12927–12931.
Häberle, W., Hörber, J.K.H., Ohnesorge, F., Smith, D.P.E., and Binnig, G. (1992). In situ investigations of single living cells infected by viruses. Ultramicroscopy 42- 44: 1161–1167.
Hansma, H.G., Bezanilla, M., Zenhausern, F., Adrian, M., and Sinsheimer, R.L.
(1993). Atomic force microscopy of DNA in aqueous solutions. Nucleic Acids Res.
21:505–512.
Henrissat, B. (1991). A classification of glycosyl hydrolases based on amino acid sequence similarities. Biochem. J. 280:309–316.
Henrissat, B., and Bairoch, A. (1993). New families in the classification of gly- cosyl hydrolases based on amino acid sequence similarities. Biochem. J. 280:781–
788.
Henrissat, B., Driguez, H., Viet, C., and Schülein, M. (1985). Synergism of Cellu- lases from Trichoderma reesei in the Degradation of Cellulose. Nat. Biotechnol. 3:
722–726.
Henrissat, B., Teeri, T.T., and Warren, R.A. (1998). A scheme for designating en- zymes that hydrolyse the polysaccharides in the cell walls of plants. FEBS Lett.
425:352–354.
Hon, D.N.S. (1994). Cellulose: a random walk along its historical path. Cellulose 1:1–25.
Hossain, M.D., Furuike, S., Maki, Y., Adachi, K., Ali, M.Y., Huq, M., Itoh, H., Yoshida, M., and Kinosita, K. (2006). The rotor tip inside a bearing of a thermo- philic F1-ATPase is dispensable for torque generation. Biophys. J. 90:4195–4203.
Hossain, M.D., Furuike, S., Maki, Y., Adachi, K., Suzuki, T., Kohori, A., Itoh, H., Yoshida, M., and Kinosita, K. (2008). Neither helix in the coiled coil region of the axle of F1-ATPase plays a significant role in torque production. Biophys. J. 95:
4837–4844.
Hua, W., Chung, J., and Gelles, J. (2002). Distinguishing inchworm and hand- over-hand processive kinesin movement by neck rotation measurements. Science 295:844–848.
Huxley, H.E. (1969). The Mechanism of Muscular Contraction. Science 164:
1356–1366.
Igarashi, K., Koivula, A., Wada, M., Kimura, S., Penttilä, M., and Samejima, M.
(2009). High speed atomic force microscopy visualizes processive movement of Trichoderma reesei cellobiohydrolase I on crystalline cellulose. J. Biol. Chem. 284 36186–36190.
Igarashi, K., Uchihashi, T., Koivula, A., Wada, M., Kimura, S., Okamoto, T., Penttila, M., Ando, T., and Samejima, M. (2011). Traffic Jams Reduce Hydrolytic Efficiency of Cellulase on Cellulose Surface. Science 333:1279–1282.
Igarashi, K., Wada, M., and Samejima, M. (2007). Activation of crystalline cellu- lose to cellulose III(I) results in efficient hydrolysis by cellobiohydrolase. FEBS J.
274:1785–1792.
Iko, Y., Tabata, K.V., Sakakihara, S., Nakashima, T., and Noji, H. (2009). Accele- ration of the ATP-binding rate of F1-ATPase by forcible forward rotation. FEBS Lett. 583:3187–3191.
Imai, T., Boisset, C., Samejima, M., Igarashi, K., and Sugiyama, J. (1998). Unidi- rectional processive action of cellobiohydrolase Cel7A on Valonia cellulose mi- crocrystals. FEBS Lett. 432:113–116.
Inoue, S., Uchihashi, T., Yamamoto, D., and Ando, T. (2011). Direct observation of surfactant aggregate behavior on a mica surface using high-speed atomic force microscopy. Chem. Commun. 47:4974–4976.
Itoh, H., Takahashi, A., Adachi, K., Noji, H., Yasuda, R., Yoshida, M., and Kino- sita, K. (2004). Mechanically driven ATP synthesis by F1-ATPase. J. Jap. Bio- chem. Soc. 427:42–45.
Johansson, G., Stahlberg, J., Lindeberg, G., Engstrom, A., and Pettersson, G.
(1989). Isolated fungal cellulose terminal domains and a synthetic minimum ana- logue bind to cellulose. FEBS Lett. 243:389–393.
Joo, C., Balci, H., Ishitsuka, Y., Buranachai, C., and Ha, T. (2008). Advances in single-molecule fluorescence methods for molecular biology. Ann. Rev. Biochem.
77:51–76.
Kaibara, C., Matsui, T., Hisabori, T., and Yoshida, M. (1996). Structural asymme- try of F1-ATPase caused by the gamma subunit generates a high affinity nucleo- tide binding site. J. Biol. Chem. 271:2433–2438.
Kasas, S., Thomson, N.H., Smith, B.L., Hansma, H.G., Zhu, X., Guthold, M., Bustamante, C., Kool, E.T., Kashlev, M., and Hansma, P.K. (1997). Escherichia coli RNA polymerase activity observed using atomic force microscopy. Biochemi- stry 36:461–468.
Kitazawa, M., Shiotani, K., and Toda, A. (2003). Batch Fabrication of Sharpened Silicon Nitride Tips. Jpn. J. Appl. Phys. 42:4844–4847.
Kodera, N., Sakashita, M., and Ando, T. (2006). Dynamic proportional-integral- differential controller for high-speed atomic force microscopy. Rev. Sci. Instrum.
77:083704 (7 pp).
Kodera, N., Yamamoto, D., Ishikawa, R., and Ando, T. (2010). Video imaging of walking myosin V by high-speed atomic force microscopy. Nature 468:72–76.