• 検索結果がありません。

Inward Investment Efficiency Analysis of Mekong Countries under Economic Cooperation with China and Japan

N/A
N/A
Protected

Academic year: 2021

シェア "Inward Investment Efficiency Analysis of Mekong Countries under Economic Cooperation with China and Japan"

Copied!
14
0
0

読み込み中.... (全文を見る)

全文

(1)

Received: 25 September 2018 / Accepted: 25 October 2018

© Social Science Review (2018) Saitama University, Japan

Abstract This paper aims to measure China's and Japan's investment efficiency in Mekong countries i.e. Cambodia, Lao PDR, Myanmar, Viet Nam, and Thailand. Based on the Knowledge-capital model of multinationals, the estimation model is built to examine the degree of Mekong’s inward FDI efficiency with its efficiency determinants (market seeking, factor seeking, export-platform seeking, efficiency seeking) and institutional factors as its inefficiency determinants. Using a stochastic frontier analysis with a panel dataset of bilateral FDI flows from China and Japan to Mekong countries over the years 2009-2016, the investment efficiency scores show that there exists the inward FDI efficiency gap among Mekong countries. The stochastic regression results indicate that an increase in bilateral trade is significantly positive to the inward FDI efficiency in the Mekong region. The similarity of economic size, relative labor endowment, and trade cost are significantly negative to the inward FDI efficiency. It implies that the inward FDI efficiency in Mekong region depends on the advantage of export-platform seeking, market seeking, and efficiency seeking. Mekong’s inward FDI is also significantly restricted by institutional factors. In particular, the high level of control of corruption helps to enhance the investment climate in the Mekong region. These conclusions may be beneficial for making a regional trade and industrial cooperation, and horizontal-and-vertical FDI enhancing policies in the Mekong countries.

Keywords Inward FDI efficiency, Stochastic frontier analysis, Mekong region

JEL Classification C23, F21, O53

1

1 Corresponding author

2 Office of Border Economy and Logistics Study, School of Management, Mae Fah Luang University

Acknowledgements: The authors would like to express their gratitude to Thailand Research Fund (TRF) for financial support under the research project “China’s Foreign Economic Policies through New Normal in Asian Economies”, and to Office of Border Economy and Logistics Study (OBELS), School of Management, Mae Fah Luang University for giving permission to conduct this research.

Inward Investment Efficiency Analysis of Mekong Countries under Economic Cooperation with China and Japan

Nathapornpan Piyaareekul Uttama

1

, Rapipong Promnart

2

《Chapter 3》 FDI, Trade, Global Value Chains and Excahnge Rates Regimes

(2)

1 Introduction

  Mekong region’s economies (Cambodia, Lao PDR, Myanmar, Viet Nam, and Thailand: hereafter CLMVT) have been the emerging countries enhanced by foreign direct investment as a strategy of economic growth. They have grown with a large inflow of annual foreign investment growth rate for over the last decade (Figure 1). The one-third of total foreign direct investment flows to CLMVT during the period 2010-2017 was from Japan (24%) and China (12%). Lao PDR was the fourth-largest recipient of Chinese investment, whereas Thailand and Viet Nam were the top three largest recipients of Japanese investment. From ASEAN Investment Report (2015, 2016, 2017), China and Japan have been notable main players in transport and energy investment in Mekong region that have resulted in the development of regional value chain in various economic sectors.

Fig. 1 Inward FDI flows to Cambodia, Lao PDR, Myanmar, Viet Nam and Thailand, 2010-2017

Source: ASEAN Secretariat (2018)

  In fact, official development assistance in term of aid for trade (AFT) is also important to attract

FDI inflows and improve regional value chain in CLMVT. Recently, China and Japan have become major

players in providing aid for trade for Mekong region, especially AFT for energy-sector and transport-

sector investment. Chinese and Japanese aid for trade to CLMVT grew at an average annual growth rate of

58% and 16% over the period 2009-2016, respectively (Figure 2). Importantly, Greater Mekong Subregion

economic cooperation (with Japan as a leader) and Lancang-Mekong Cooperation (with China as a leader)

are indeed regarded as a primary driver of the foreign investment growth in Mekong region.

(3)

Fig. 2 Aid for Trade to Cambodia, Lao PDR, Myanmar, Viet Nam and Thailand, 2009-2016

Source: OECD (2018) and Institute for the Theory & Practice of International Relations (2018)


  Even though an increase in FDI inflows may be responded to the level of FDI performance, but a discussion about “investment efficiency” issue is still necessary and helpful for improving and upgrading the industrial sector. Furthermore, previous empirical studies tended to examine the FDI determinants, while the FDI efficiency was not well investigated. In fact, FDI efficiency presents the level of actual FDI inflows to the maximum possible level of FDI on the frontier (Dunning, 1980; Dunning and Lundan, 2008).

The recent studies were Zhou et al. (2011) Fan et al. (2016) Stack et al. (2017) and Mourao (2018). They constructed the stochastic FDI model based on the Knowledge-capital model of multinationals (Markusen, 2002) and gravity model of FDI (Brainard, 1997); and then utilized a stochastic frontier analysis (SFA) technique to measure the level of FDI efficiency. These studies suggested that determinants influencing FDI efficiency can be grouped into five categories: market size, export diversity, a difference in factor endowments (skilled and unskilled labor, capital), geography (distance, trade costs, investment costs), and economic agreements. In addition, income per capita, language, trade openness, and government efficiency were included in some studies. Most empirical results pointed out that the statistically significant effects on FDI efficiency were straightforward and intuitive. Importantly, their findings showed that market size, export diversity, and trade cost reduction were effective for enhancing FDI efficiency. From these existing studies, there are still two primary gaps. The first gap is involved in a discussion of the FDI efficiency in Mekong economies, especially FDI inflows from major investing countries such as China and Japan. The second gap is associated with the relationship between bilateral trade and FDI efficiency, and how export- and-import platform driven FDI and global value chain in trade are important to determine the level of FDI efficiency. Most studies neglect to consider the pattern and direction of trade (global value chain activities), and it is great potential for improving FDI efficiency in this paper.

  This paper attempts to measure the level of China’ s and Japan’ s investment efficiency in Mekong

countries (Cambodia, Lao PDR, Myanmar, Viet Nam, and Thailand) covering the period 2009-2016. It also

examines the influential factors on FDI efficiency in Mekong region using a panel data stochastic frontier

(4)

analysis. The estimated results reveal that differences in economic size, bilateral trade, relative labor, trade cost, economic freedom and control of corruption are significant factors on inward FDI efficiency.

The findings also indicate that FDI efficiency scores of Chinese and Japanese investors in the Mekong region are quite moderate and far from the full efficient level. However, to fill the gap between actual FDI inflows to CLMVT and FDI frontier, it is necessary to expand market capacity, stimulate bilateral trade, and promote the particular FDI location in CLMVT. Therefore, horizontal-and-vertical FDI enhancing strategies are a dominant paradigm for improving FDI efficiency in the Mekong region.

  The remainder of this study is organized as follows: Section 2 describes the research methodology.

Section 3 presents the empirical results of the determinants of FDI efficiency and the FDI efficiency scores. Section 4 concludes.

2 Research methodology

2.1 Model specification

  Panel data stochastic frontier analysis (PSFA) (Pitt and Lee, 1981) was generally employed to measure technical efficiencies such as technical efficiency of FDI as shown in Fan et al. (2016) and Stack et al. (2017). In fact, the technical FDI efficiency is measured by the proximity of the actual FDI inflows from the FDI frontier. The FDI frontier presents the maximum FDI inflows (outputs) that are potentially acquired from a certain level of the FDI determinants (inputs), whereas the technical FDI efficiency is defined as how well a country transforms the FDI determinants into FDI inflows. If a country reaches its maximum FDI capacity, it implies that the FDI inflows to a country are fully efficient. Fan et al. (2016) developed the stochastic gravity model to evaluate the technical efficiency of Chinese’s outward FDI using stochastic frontier analysis. Stack et al. (2017) built the stochastic efficiency model of FDI based on the Knowledge-capital model of multinationals to evaluate the FDI efficiency in Eastern Europe. According to these studies, a panel data stochastic frontier analysis is utilized to measure the level of FDI efficiency in this study. Based on Pitt and Lee (1981), the stochastic model with panel data is written by the following equation:

(1)

where i, j, and t are the indexes of the recipient country, investing country, and period, respectively. X

ijt

are explanatory variables determining the frontier of inward FDI, such as economic size of country i and

j, similarity of country i and j, income per capita of country i, export and trade between country i and j,

relative factors (capital, labor) of country i to j, geographical distance between i and j, and trade cost and

level of economic freedom of country i. β is a vector of unknown parameters, to be estimated. U

ijt

and

V

ijt

are error terms. V

ijt

is a two-sided error element representing statistical noise and measurement error

(5)

that is assumed to be the normal distribution with mean zero and constant variance, V

ij

~iidN(0, σ

v2

). U

ijt

is a one-sided inefficiency element capturing the technical efficiency loss. It is assumed to be distributed independently of the random error that is in the form of the truncated normal distribution, U

i

~iidN

+

(µ, σ

u2

).

Technical efficiency of FDI by country j to i is the ratio of the observed FDI and the maximum level of FDI, defined as implies higher FDI efficiency or FDI inflows closer to the FDI frontier. Following Eq. (1), the stochastic frontier specification for FDI model is specified as follows:

(2)

where FDI

ijt

is FDI inflows from country j to country i at year t. SGDPijt and RGDP

ijt

denote the sum of economic size and similarity in economic size of country j and country i at year t, respectively. GDPPC

it

is income per capita of country i. TRD

ijt

and EXP

ijt

denote flows of trade and export between country i and j, respectively. RK

ijt

and RL

ijt

are relative capital and labor of country i to j, respectively. TRDC

it

is country i’s rade cost. DIST

ij

is a geographical distance between i and j. EFI

it

is level of economic freedom of country i. The method of maximum likelihood is employed to estimate the parameters of the stochastic frontier with time-invariant technical inefficiency (Battese and Coelli, 1988) and stochastic frontier with time-varying technical inefficiency (Battese and Coelli, 1995). The level of technical efficiency for each country pair is measured following the conditional expectation of exp(-U

ij

). The range of values is zero to unity. An efficiency score of unity implies the coincidence between the level of actual FDI and maximum FDI on the frontier, whereas scores closer to zero express the far level of actual FDI from the frontier.

With time-invariant technical efficiency, the technical efficiency is measured as TE

ijt

exp(-U

ijt

);

U

it

=U

i

. With time-varying technical efficiency, the technical efficiency is measured as TE

ijt

exp(-U

ijt

);

U

ijt

= η

ijt

U

ij

where U

ij

is assumed to be a non-negative truncation of N(u, σ

u2

), distribution and the scalar parameter η . The technical inefficiency model is defined as follows:

 U

ijt

= η

0

+ η

1

CCI

it

+ η

2

GEI

it

+e (3)

  where CCI

it

denotes a level of control of corruption of country i at year t and GEI

it

denotes a level of

government effectiveness of country i at year t. If η >0 is an increase in the level of efficiency towards the

base level; and if η =0 is insignificant or the level of efficiency that remains constant. Based on the model

estimation, it exhibits the parameter, σ

2

= σ

u2

+ σ

v2

, and γ= σ

u2

/( σ

u2

+ σ

v2

) where γ takes a value

between 0 and 1. The significance of parameter γ is used to test the appropriateness of error term in the

form of the stochastic frontier function: H

0

: γ =0 and H

a

: γ >0. If the null hypothesis is rejected ( γ=0),

it means that the term U

ij

should be in the stochastic frontier model.

(6)

2.2 Data

  This study employs the panel data set of inward foreign direct investment from China and Japan to five recipient countries covering the period 2009-2016. The recipient countries are Cambodia, Lao PDR, Myanmar, Viet Nam, and Thailand. Data on inward FDI stocks deflated by consumer prices (2005=100), are gathered by the ASEAN Economic Community Department of the ASEAN Secretariat. Data on gross domestic products of recipient country (GDPI) and of investing countries (GDPJ) and recipient country’

s GDP per capita, at constant 2005 US$, are collected by the United Nations Conference on Trade and Development. Real GDP is used to calculate bilateral economic size, SGDP=(GDPI+GDPJ), and similarity in economic size, RGDP=1-[GDPI/(GDPI+GDPJ)

2

] - [GDPJ/(GDPI+GDPJ)

2

]. Data on export and trade between the recipient and investing countries at constant 2005 US$ are also gathered by the United Nations Conference on Trade and Development.

  The variables of relative capital and relative labor are measured by the ratio of gross fixed capital formation and of labor force participation between the recipient and investing countries, respectively.

These data were gathered by The World Bank. The variable of trade cost is expressed as the presence of trade restrictions in the recipient countries that is measured by subtracting the ratio of imports and exports to GDP ratio from 100, TRDC=100 - [(TEXP+TIMP)/GDPI] where TEXP and TIMP are total exports and imports of the recipient countries at constant 2005 US$. These data are collected by the United Nations Conference on Trade and Development. Data on geographical distance between capital cities of the recipient and investing countries is measured in kilometers.

 Data on the level of economic freedom of recipient counties are evaluated by the Heritage Foundation.

The higher scores show the economic freedom in the pursuit of greater economic development (Miller

et al., 2008). Data on the recipient country’s control of corruption and government effectiveness as

dimensions of worldwide governance indicator are evaluated by The World Bank Group. They are ranged

from approximately -2.5 (weak) to 2.5 (strong) governance performances. Table 1 shows the descriptive

statistics of the model variables.

(7)

Table 1 Descriptive statistics

Variable Description Unit Mean Standard

deviation Minimum Maximum No. of observations FDI Foreign direct investment of country

i from j Mil.US$ 2,161.79 4,489.46 0.10 23,217.21 80

SGDP Sum of GDP between country i and j Mil.US$ 6,403,024 1,128,732 4,577,048 8,759,540 80

RGDP Similarity in GDP of country i and j Ratio 0.02 0.03 0.002 0.11 80

GDPPC GDP per capita of country i US$ 1,406.93 1,512.85 435.25 4,621.68 80

TRD Bilateral trade of country i and j Mil.US$ 12,807.72 17,862.93 78.53 54,517.29 80 EXP Bilateral export of country i and j Mil.US$ 5,880.21 9,188.53 17.84 35,383.28 80

RK Relative capital of country i to j Ratio 0.02 0.03 0.001 0.11 80

RL Relative labor of country i to j Ratio 0.19 0.18 0.01 0.50 80

TRDC Trade cost of country i Index 98.97 0.52 97.86 99.71 80

DIST Distance between country i and j Kilometers 3,424.90 936.36 1,925.00 4,607.00 80 EFI Economic freedom index of country

i Scores 53.63 7.55 36.70 66.20 80

CCI Control of corruption of country i Scores -0.85 0.39 -1.67 -0.31 80

GEI Government effectiveness of

country i Scores -0.56 0.60 -1.62 0.35 80

Source: Authors’ calculation

3 Empirical results

3.1 The model estimates

  Table 2 exhibits the maximum likelihood estimates for the stochastic frontier model with a time-

varying technical efficiency of Chinese and Japanese FDI into CLMVT countries covering the 2009-2016

period. Column (1) shows the empirical results over the full sample. To reach an insight into the different

economies, columns (2) and (3) separately present the results for Chinese and Japanese FDI into the

Mekong region. The parameter γ is significant which implies the appropriateness of a variation in the

composed error term to the inefficiency component; whereas the insignificance of parameter γ indicates

that the variation in the composed error is attributed to the random error term. The goodness-of-fit of the

chosen model is confirmed by the statistical significance of the log-likelihood value.

(8)

Table 2 Estimation results of the stochastic frontier model with time-varying technical inefficiency

Efficiency determinants CHINA and JAPAN CHINA JAPAN

Coeff. t-stat. Coeff. t-stat. Coeff. t-stat.

SGDP 3.86* 8.39 19.43* 4.15

RGDP -0.89** -2.22

GDPPC -0.17 -0.43

TRD 1.93* 9.45

EXP -0.0005 -0.01 -1.07** -2.14

RK 0.32 0.74 2.74* 3.70

RL -1.72* -4.23 0.49* 3.58

DIST 8.15* 8.80

TRDC -88.44* -2.46 71.28* 2.37 -124.62* -4.61

EFI -0.14* -4.32 0.001 0.14 0.08** 2.01

constant 320.92** 1.96 -379.66* -2.68 297.13*** 1.81

Inefficiency determinants:

CCI -0.79*** -1.85 1.91*** 1.88 36.66*** 1.76

GEI -34.02** -1.99

constant 3.52*** 1.68 1.18 1.20 8.22 1.12

Variance parameters:

Sigma u 10.71 0.93 1.27 0.77 6.33 0.33

Sigma v 0.58* 5.45 0.21* 2.54 0.34* 3.32

Lambda 18.34 1.59 5.94* 3.62 18.41 0.95

Gamma 0.99 0.97 0.99

Log-likelihood -108.27 -23.31 -37.45

Chi-square 301.91* 83.10* 753.73*

LR test 3.89** 3.63** 19.38*

VIF 20.88 2.26 20.65

Obs. 80 40 40

Note: 1) *, **, *** significant at 1, 5, 10 percent levels.

2) Lambda = Sigma u/Sigma v. 3) Gamma = Sigma u squared / Sigma squared.

Source: Authors’ calculation

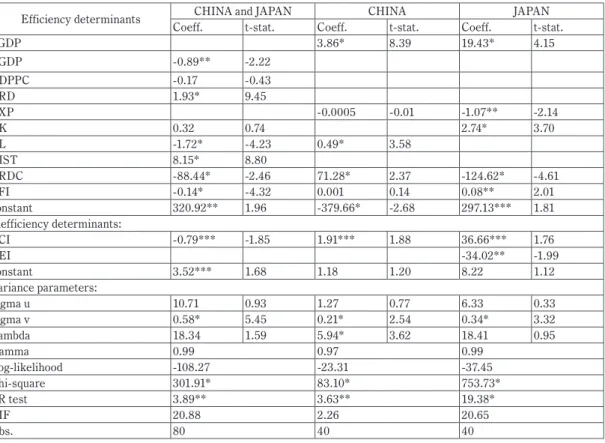
  The estimates of China’s and Japan’s FDI efficiency model can be categorized into four groups.

  First, it concentrates on the relationship between economic size and FDI efficiency including the role of market-seeking FDI (either final goods market or intermediate goods market). In a theoretical context, the difference in market size favors vertical FDI (Multinationals fragment production process internationally), whereas similarity in economic size favors horizontal FDI (Multinationals duplicate the same activities abroad) (Baltagi et al., 2007). The finding reveals that the coefficient of RGDP is negative and statistically significant at the 5% level. The difference in economic size between investing and recipient countries is one of the major drivers enhancing vertical FDI close to the efficient level.

  Second, it focuses on the linkage of trade and FDI efficiency. The estimated coefficient of bilateral

trade between countries is positive, statistically significant at 1% level. It indicates that China’s and Japan’s

trade in Mekong region encourage Chinese and Japanese FDI in CLMVT for taking advantages of market

access, proximity to intermediate goods, and export-and-import platform. In fact, it tends to support

vertical FDI. Moreover, it may reflect that the value chain in trade (both backward and forward value

(9)

chain) between the recipient and investing countries contributes to the CLMVT’s inward FDI efficiency.

Table 3 shows the share of intra-industry trade IIT in manufacturing goods between CLMVT, China and Japan during the period 2009-2016, providing an insight into the trading pattern in the same industries and the CLMVT’ s products in China and Japan market. Higher IIT implies rising and deepening trade flows between CLMVT and Chinese and Japanese partner country. Among CLMVT economies, Vietnam obtained the highest levels of intra-industry trade in resource-based, low-technology and medium- technology manufacture with China and Japan, whereas Thailand has the highest level of intra-industry trade index in high-technology manufactures with them. Hence, it is possible that the high level of the value chain in trade between countries attracts higher FDI inflows at the industry level.

  Third, it concentrates on the relationship between factor endowment and FDI efficiency. The estimated coefficient of relative labor is negative and statistically significant at 1% level. This negative relation indicates that difference in labor endowment is important to attract “resource-seeking and efficiency-seeking” investment from China and Japan, enhancing the efficiency of FDI inflows to Mekong region. This empirical result is consistent with the theory of FDI “Knowledge-capital model” and the existing studies.

Table 3 Intra-industry trade index between China, Japan, and CLMVT countries, 2009-2016

Manufacture Cambodia Lao PDR Myanmar Thailand Viet Nam

China Japan China Japan China Japan China Japan China Japan Resource-based 0.486 0.081 0.117 0.249 0.602 0.373 0.623 0.659 0.751 0.961 Low-technology 0.145 0.146 0.055 0.265 0.112 0.145 0.225 0.580 0.412 0.783 Medium-technology 0.021 0.176 0.077 0.080 0.092 0.010 0.016 0.0005 0.160 0.744 High-technology 0.238 0.127 0.008 0.370 0.028 0.281 0.649 0.678 0.430 0.600

Note: Intra-industry index by is measured by where Xij and Mij are the values of country j’s export and imports respectively for commodity i (Grubel and Lloyd, 1971).

Source: Authors’ calculation and UNCTAD (2018a)

  Finally, it focuses on the relationship between the efficiency factors e.g. geography distance and trade cost and FDI efficiency. The estimated coefficient of geographical distance is positive and statistically significant at 1%. It indicates that the advantage of geographic proximity between investing and recipient countries is not a key driver for improving FDI efficiency in the Mekong region. This empirical result appears to contradict the results obtained from Fan et al. (2016) and Stack et al. (2017). However, the coefficient of trade cost is negative, statistically significant at 1% level. The trade cost reduction or the absence of trade barriers helps to improve China’s and Japan’s FDI flows to Mekong region close to the efficient level, especially vertical FDI inflows.

  Additionally, the coefficient of economic freedom is negative, statistically significant at 1% level.

Economic freedom index represents a degree to which the policies and institutions of countries are

supportive of economic freedom (The Heritage Foundation, 2018). The finding indicates that free market

(10)

in Mekong region discourages an investment from China and Japan, lessening the efficiency of FDI inflows to CLMVT. This empirical result contradicts to earlier hypothesis made in Fan et al. (2016).

  According to the FDI inefficiency model, the coefficient of the institutional factors i.e. controls of corruption is statistically significant at 1% level. Control of corruption is one of the institutional risk factors that has been generally incorporated into the model for FDI analysis. It was also hypothesized that a high level of control of corruption in a recipient country will result in a higher FDI inflow. However, the finding presents that the control of corruption in CLMVT lowers the FDI inefficiency in the Mekong region. The result is consistent with Yao et al. (2018).

  To check the robustness of the CLMVT model, equation (2) is also estimated separately as shown in column (2) for Chinese investment and column (3) for Japanese investment. The empirical results in Column (2) exhibit that economic size, relative labor endowment, and trade cost are positive significant factors for China’s FDI inflows to the Mekong region. It is obvious that China’s FDI in CLMVT is more likely to be a horizontal type for market-seeking. Meanwhile, the empirical results in Column (3) present that economic size, relative capital, and economic freedom are positive significant factors for Japan’s FDI inflows to Mekong region, whereas bilateral export and trade cost is negative significant factors. It ensures that Japan’ s FDI in CLMVT is more likely to be both horizontal and vertical types for market-seeking and efficiency-seeking. In addition, to improve the efficiencies of China’ s and Japan’ s FDI in the Mekong region, horizontal and vertical FDI-enhancing policies are simultaneously implemented.

  Interestingly, the coefficient of CCI is positive statistically significant at 10% level in both China’s FDI

efficiency model, column (2) and Japan’s FDI efficiency model, column (3). It implies that the high level of

control of corruption in the Mekong region increases the FDI inefficiency in CLMVT economies. These

results are different from the whole FDI efficiency model, column (1).

(11)

Table 4 Estimation results of the stochastic frontier model with time-invariant technical inefficiency Efficiency

factors CHINA+JAPAN CHINA JAPAN

Coeff. t-stat. Coeff. t-stat. Coeff. t-stat.

SGDP 3.26* 8.13 26.15* 4.47

RGDP -1.57* -3.22

GDPPC -1.36* -2.47

TRD 1.62* 7.19

EXP 0.10 1.16 0.10 0.19

RK 2.35* 4.16 1.46*** 1.83

RL -2.88* -5.27 0.36*** 1.88

DIST 8.09* 5.32

TRDC -83.88 -1.57 -59.59*** -1.62 -16.85 -0.23

EFI -0.01 -0.59 -0.05* -2.49 0.15* 3.68

constant 309.63 1.27 232.10 1.34 -327.03 -0.83

Variance parameters:

Gamma 0.95 0.99 0.96

Log-likelihood -103.71 -24.17 -49.41

Chi-square 235.52* 176.98* 159.90*

VIF 20.88 2.26 20.65

Obs. 80 40 40

Note: 1) *, **, *** significant at 1, 5, 10 percent levels.

2) Lambda = Sigma u/Sigma v. 3) Gamma = Sigma u squared / Sigma squared.

Source: Authors’ calculation

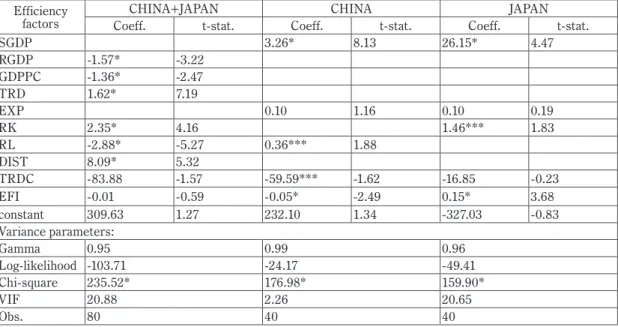
  In addition, Table 4 exhibits the maximum likelihood estimates for the stochastic frontier model with the time-invariant technical inefficiency of Chinese and Japanese FDI flows to Mekong countries covering the 2009-2016 period. Column (1) shows the empirical results for both Chinese and Japanese investment, whereas columns (2) and (3) present the results for China’s and Japan’s investment, respectively. The goodness-of-fit of the models is confirmed by the statistical significance of the log-likelihood value.

Regarding the China’s and Japan’s FDI efficiency model, column (1), the empirical results show that all of the estimated coefficients are quite similar to the estimates of a stochastic frontier model with time- varying technical efficiency. That is, a difference in economic size, bilateral trade, capital abundance, a difference in relative labor, and geographical distance are positive significant factors for Chinese and Japanese FDI inflows to Mekong region. Moreover, the estimated coefficients of China’ s FDI efficiency model, column (2) and Japan’s FDI efficiency model, column (3) are also similar to the estimates of a stochastic frontier model with time-varying technical inefficiency.

  These findings give strong support to the importance of economic size, bilateral trade, factor

endowment, geographical distance, and trade cost on the FDI efficiency. Horizontal and vertical FDI-

enhancing policies are necessary to improve the efficiencies of China’ s and Japan’ s FDI in the Mekong

region.

(12)

3.2 Investment efficiency scores

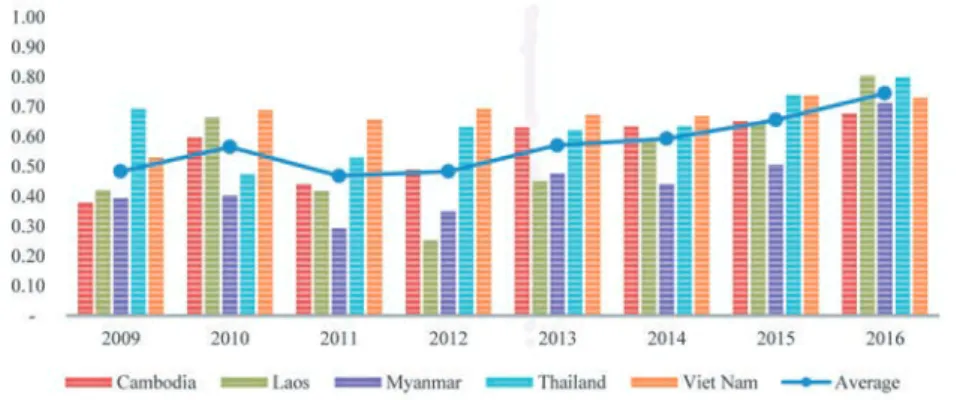
  Figure 3 shows the overall efficiency of Chinese and Japanese investment into CLMVT during 2009-2016 and Table 5 summarizes the efficiency scores from China’ s and Japan’s investment. The FDI efficiency can range from 0 (weakest) to 1 (strongest), where the strongest score means the maximum possible efficiency for FDI inflows. The findings indicate that the efficiencies from Chinese and Japanese investment in the Mekong region have somewhat changed from 2009 to 2016. The average efficiencies from China’s investment arise from 0.58 over the period 2009-2012 to 0.63 over the period 2013-2016, as well as, the average efficiencies from Japan’s investment arise from 0.41 over the period 2013-2016 to 0.64 over the period 2013-2016.

 The Chinese investment efficiencies are rather higher than Japanese investment, but there is a large potential for enhancing inward FDI. In 2016, the average FDI efficiency of Mekong region attained 68-80%

of its maximum FDI capacity. The gap between actual FDI inflows and the maximum possibility frontier remains. It means that the Mekong region has a potential for enhancing inward FDI.

Fig. 3 The overall efficiency of Chinese and Japanese FDI into CLMVT during 2009-2016

Source: Authors’ calculation

  Based on the average FDI efficiency covering the period 2009-2016, the levels of FDI efficiency in Mekong region can be categorized into three groups: somewhat high-average scores (average scores < 0.7), moderate-average scores (0. 5 < average scores < 0.7), and low-average scores (average scores < 0.5).

  Among CLMVT economies, Thailand is ranked in the high level of Japan’s FDI efficiency and the moderate level of China’s FDI efficiency. Cambodia, Lao PDR and Viet Nam are categorized in the moderate level of Chinese and Japanese FDI efficiencies. Myanmar is ranked in the moderate level of China’s FDI efficiency and the low level of Japan’s FDI efficiency.

  However, Chinese and Japanese FDI inflows to Mekong region remain far from taking full inward FDI

efficiency. Hence, CLMVT economies should improve the level of FDI efficiency (in order to eventually

achieve the maximum FDI efficiency).

(13)

Table 5 Efficiency scores for China’s and Japan’s FDI to CLMVT, 2009-2016

China Japan

2009-2012 2013-2016 Average 2009-2012 2013-2016 Average

Cambodia 0.5105 0.6525 0.5815 0.4436 0.6441 0.5439

Lao PDR 0.4823 0.5941 0.5382 0.3962 0.6491 0.5227

Myanmar 0.6957 0.6405 0.6681 0.0232 0.4268 0.2250

Thailand 0.5481 0.5850 0.5666 0.6146 0.8133 0.7139

Viet Nam 0.6633 0.7062 0.6848 0.6203 0.6975 0.6589

CLMVT 0.5800 0.6357 0.6078 0.4196 0.6462 0.5329

Source: Authors’ calculation

4 Conclusion and policy implication

  This study examines the determinants of inward FDI efficiency and the levels of China’s and Japan’s investment efficiency in Cambodia, Lao PDR, Myanmar, Viet Nam, and Thailand. Using the panel stochastic frontier analysis, the findings show that bilateral trade and geographical distance are significantly positive to inward FDI efficiency in Mekong region, whereas similarity in economic size, relative labor, trade cost, and economic freedom are negative significant factors on the FDI efficiency.

Importantly, the higher level of control of corruption in CLMVT helps to reduce the FDI inefficiency in the Mekong region.

  It also found that Chinese and Japanese investment in Mekong countries can generate the FDI efficiencies in Mekong countries at a moderate level. The advantages of market seeking, efficiency seeking, and export-and-import platform seeking are key success factors of an improvement in FDI efficiency in the Mekong region. Therefore, horizontal and vertical FDI-enhancing policies in CLMVT economies are necessary. Several implications for practice and policy can be drawn from these empirical results.

  First, promoting the intra-regional and extra-regional connectivity is essential to boost economic growth in the region. Especially, trade and investment facilitation are an important catalyst for eliminating cross-border trade and investment obstacles and enabling favorable trade and investment environment.

  Second, it is important and necessary to enhance regional value chain participation for approaching the FDI frontier with relatively high-efficiency scores. The adoption and adaptation of modern trade channels could help firms to move their FDI frontier up and become more attractive for investment.

  Third, improving labor skills and labor standard is critical for foreign firms to obtain economies of scale, higher consistent quality, and higher efficient production. It also helps to enhance the investment climate and attract foreign investors.

  Fourth, the regional connectivity of hard and soft infrastructure is a priority for strengthening inclusive investment and equitable development in the Mekong region.

  Lastly, the coherence and synergy among national and international investment policies are important

to build foreign investor confidence in the Mekong region (UNCTAD, 2018b). Investor confidence has an

(14)

important role in foreign investor decision making.

References

ASEAN (2015) ASEAN Investment Report Infrastructure Investment and Connectivity. The ASEAN Secretariat and the United Nations Conference on Trade and Development (UNCTAD).

ASEAN (2016) ASEAN Investment Report Foreign Direct Investment and MSME Linkages. The ASEAN Secretariat and the United Nations Conference on Trade and Development (UNCTAD).

ASEAN (2017) ASEAN Investment Report Foreign Direct Investment and Economic Zones in ASEAN. The ASEAN Secretariat and the United Nations Conference on Trade and Development (UNCTAD).

ASEAN (2018) ASEAN Statistics. The Association of Southeast Asian Nations. https://data.aseanstats.org/.

Battese G E and T J Coelli (1988) Prediction of Firm-Level Technical Efficiencies with a Generalized Frontier Production Function and Panel Data. Journal of Econometrics 38 (3): 387-99.

Battese G E and T J Coelli (1995) A Model for Technical Inefficiency Effects in a Stochastic Frontier Production Function for Panel Data. Empirical Economics 20 (2): 325-32.

Brainard S L (1997) An Empirical Assessment of the Proximity-Concentration Trade-off between Multinational Sales and Trade. American Economic Review 87(4): 520-544.

Dunning J H (1980) Toward an Eclectic Theory of International Production: Some Empirical Tests. Journal of International Business Studies 11(1): 9-31.

Dunning J H and S M Lundan (2008) Multinational Enterprises and the Global Economy, Second Edition. Edward Elgar Publishing Limited. UK.

Fan Z, R Zhang, X Liu and L Pan (2016) China’s Outward FDI Efficiency along the Belt and Road An Application of Stochastic Frontier Gravity Model. China Agricultural Economic Review 8(3): 455-479.

Grubel H G and P T Lloyd (1971) The Empirical Measurement of Intra-Industry Trade. Economic Record 47 (4):

494-517.

Institute for the Theory & Practice of International Relations (2018) AidData’s Geocoded Global Chinese Official Finance. https://www.aiddata.org/china.

Markusen J R (2002) Multinational Firms and the Theory of International Trade. MIT Press.

Miller T, A B Kim, and J M Roberts (2018) 2018 Index of Economic Freedom. The Heritage Foundation. Washington.

Mourao P R (2018) What is China seeking from Africa? An Analysis of the Economic and Politic Determinants of Chinese Outward Foreign Direct Investment based on Stochastic Frontier Models. China Economic Review 48:

258-268.

OCED (2018) OECD Statistics. The Organization for Economic Co-operation and Development. https://stats.oecd.org.

Pitt M M and L F Lee (1981) The Measurement and Sources of Technical Inefficiency in the Indonesian Weaving Industry. Journal of Development Economics 9 (1): 43-64.

Stack M M, G Ravishankar and E Pentecost (2017) Foreign Direct Investment in the Eastern European Countries:

Determinants and Performance. Structural Change and Economic Dynamics 41: 86-97.

The Heritage Foundation (2018) China Global Investment Tracker. http://www.aei.org/china-global-investment-tracker/.

UNCTAD (2018a) “International trade in goods and services” (database), http://unctadstat.unctad.org/EN/Index.html (accessed on 15 October 2018).

UNCTAD (2018b) World Investment Report 2018: Investment and New Industrial Policies. United Nations publication.

Yang J H, W Wang, K L Wang, and C Y Yeh (2018) Capital intensity, natural resources, and institutional risk preferences in Chinese Outward Foreign Direct Investment. International Review of Economics & Finance 55: 259-272.

Yao S, P Wang, J Zhang and J Ou (2018) Dynamic relationship between China’s inward and outward foreign direct investments. China Economic Review 40: 54-70.

Zhou X, K W Li and Q Li (2011) An Analysis on Technical Efficiency in Post-reform China. China Economic Review 22:

357-372.

Fig. 1 Inward FDI flows to Cambodia, Lao PDR, Myanmar, Viet Nam and Thailand, 2010-2017
Fig. 2  Aid for Trade to Cambodia, Lao PDR, Myanmar, Viet Nam and Thailand, 2009-2016
Table 1 Descriptive statistics
Table 2 Estimation results of the stochastic frontier model with time-varying technical inefficiency
+5

参照

関連したドキュメント

Analysis of the Risk and Work Efficiency in Admixture Processes of Injectable Drugs using the Ampule Method and the Pre-filled Syringe Method Hiroyuki.. of

Even though examples from pure geometry are symmetric, many constructions arising in dynamics as well as many constructions in analysis lead naturally to non-symmetric metric

The present paper shows how to assess the contribution made by negative selection relative to other tolerisation mechanisms by deducing the impact of negative selection on the T

The edges terminating in a correspond to the generators, i.e., the south-west cor- ners of the respective Ferrers diagram, whereas the edges originating in a correspond to the

Some useful bounds, probability weighted moment inequalities and variability orderings for weighted and unweighted reliability measures and related functions are presented..

An easy-to-use procedure is presented for improving the ε-constraint method for computing the efficient frontier of the portfolio selection problem endowed with additional cardinality

We present and analyze a preconditioned FETI-DP (dual primal Finite Element Tearing and Interconnecting) method for solving the system of equations arising from the mortar

The approach based on the strangeness index includes un- determined solution components but requires a number of constant rank conditions, whereas the approach based on