STUDY OF ELECTRICAL AND DIELECTRIC PROPERTIES OF DIELECTRIC BARRIER DISCHARGES (DBD)
GENERATED BY SILICON DIODE FOR ALTERNATING CURRENT (SIDAC) IN WATER
著者 チュオン ティ ホア
著者別表示 Truong Thi Hoa journal or
publication title
博士論文本文Full 学位授与番号 13301甲第4826号
学位名 博士(学術)
学位授与年月日 2018‑09‑26
URL http://hdl.handle.net/2297/00053074
doi: 10.1063/1.4984947
Dissertation
S TUDY OF ELECTRICAL AND DIELECTRIC
PROPERTIES OF DIELECTRIC BARRIER DISCHARGES
(DBD) GENERATED BY SILICON DIODE FOR ALTERNATING CURRENT (SIDAC) IN WATER
Kanazawa University
Graduate school of Natural Science and Technology Electrical Engineering and Computer Science
Student ID No. 1524042010
Name TRUONG THI HOA
Chief advisor Prof. Yoshihiko Uesugi
D ate of submission Sep, 2018
Abstract
This work deals with dielectric barrier discharge (DBD) generated in bubbles in water using Silicon Diode for Alternating Current (SIDAC). Dielectric-barrier discharge (DBD) is a discharge obtained in gas space between two electrodes, in which at least one of the electrodes is covered by a dielectric material. The dielectric layers in the configuration of the DBD reactor make this discharge characterized as a capacitive load, self-terminated discharge, which is generated by a high frequency alternating voltage source or a high frequency repetitive pulse power source. SIDAC or Silicon Diodes for Alternating Current is a bidirectional high voltage switching device designed for direct interface with the power line. It has high break-over voltage and power handling capabilities. The high-speed switching characteristic of SIDAC has been used for generating low-cost high voltage pulses with tens of kV derivation that have been effectively applied to DBD generation.
In this study, DBD plasmas in water were investigated as a sequence of a bubble formation and an electronic process within the bubbles. A cylindrical electrode inside a glass tube with a number of microsize holes and an inexpensive circuit using a number of SIDAC connected to a high voltage transformer at commercial frequency have been used. The gas bubbles are simply produced at initial stage by gas flow through microsize glass holes. When applied voltage meets or exceeds breakover voltage of the series connecting SIDACs, these SIDACs switch from a blocking state to a conducting state. Then, high voltage pulses with tens of kilovolt derivation are generated, as the bubble formed an electrical breakdown instantaneously takes place within the bubble. The generation of such DBD plasma should be analyzed sufficiently when its characteristics are governed by two switches: the SIDAC switching characteristic and the dielectric layers.
Additionally, one of the constraints DBD application to waste water treatment is the
requirement of the expensive and complex power source configurations that could
make the DBD installation expensive and selective. The prospect of an increase in the
market share of the application of DBD generation still faces the challenges oriented
with the need of the compact and affordable power supplies. Therefore, this work also
focused on design, construction, and optimization of configuration of a novel high
voltage pulse power source for large-scale dielectric barrier discharge (DBD) generation by using a device called Silicon Diodes for Alternating Current (SIDAC) and the self-terminated characteristic of DBD without external controlling. The DC power supply has been designed in a simple modular structure, non-control requirement, the transformer elimination, minimum number of levels in voltage conversion required to achieve the desired operating condition leading to a reduction in size, weight, simple maintenance and high scalability of the DBD generator.
Fundamental results and conclusions achieved during this work have been published
in scientific journal, presented at conferences and attached in Appendices
Table of Contents
Abstract ... i
Table of Contents ... iii
List of Figures ... iv
List of Tables ... vii
Acknowledgements ... viii
Chapter 1: Introduction ... 1
1.1 Background OF PLASMA ...2
1.2 Dielectric Barrier Discharges ...10
1.3 Silicon Diodes for Alternating Current (SIDAC) ...16
Chapter 2: Properties of Dielectric Barrier Discharges (DBD) generation using Silicon Diodes for Alternating Current (SIDAC) in water . Error! Bookmark not defined.
2.1 DBD generation by using SIDAC in gas phase ...202.2 DBD generation by using SIDAC in bubbles in water ...23
Chapter 3: Novel design of high voltage pulse source for efficient DBD plasma generation by using SIDAC ... 33
3.1 High voltage pulse generation ...34
3.2 Testing performance with a load of resistor ...36
3.3 DBD Generation by designed DC high voltage pulse source in gas phase ...43
3.4 DBD Generation by designed DC high voltage pulse source in bubbles in water ...49
3.5 Summary ...52
Chapter 4: Conclusions and future work ... 54
Chapter 5: Supplements ... 56
5.1 Strong effect of stray capacitance caused by short distance between wire and ground 56 5.2 Improvement in isolation of circuits from ground ...58
5.3 Discharge lagging behind SIDAC switching time due to low discharge frequency in glass DBD reactor ...63
5.4 Increase discharge frequency in case of using DC power supply by connecting to DBD reactor an additional parallel resistor ...70
5.5 Replacing the ground electrode of DBD generation in bubbles in water from wire insulated by PTFE to cylindrical type insulated by glass ...73
References ... 77
Appendices ... 81
List of Figures
Figure 1-1 Four states of matter ... 3
Figure 1-2 Plasma in Nature ... 3
Figure 1-3 Maxwell-Boltzmann distribution of velocities [1] ... 5
Figure 1-4 Maxwell-Boltzmann distribution of velocities as progressive temperature [1] ... 6
Figure 1-5 Classifications of plasma in terms of electron density and temperature [1] ... 8
Figure 1-6 Typical electrode arrangements of barrier discharges [17] ... 11
Figure 1-7 Sketch of a microdischarge and a simple equivalent circuit [4] ... 12
Figure 1-8 Schematic of applied voltage v(t), gap voltage v
g(t), breakdown voltage (v
b), main current i(t), displacement current i
disp(t), and discharge current i
dis(t) [20] ... 15
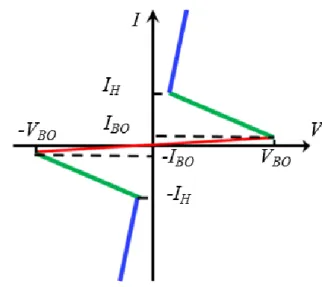
Figure 1-9 V-I characteristic of SIDAC (K1V38 (W)) ... 17
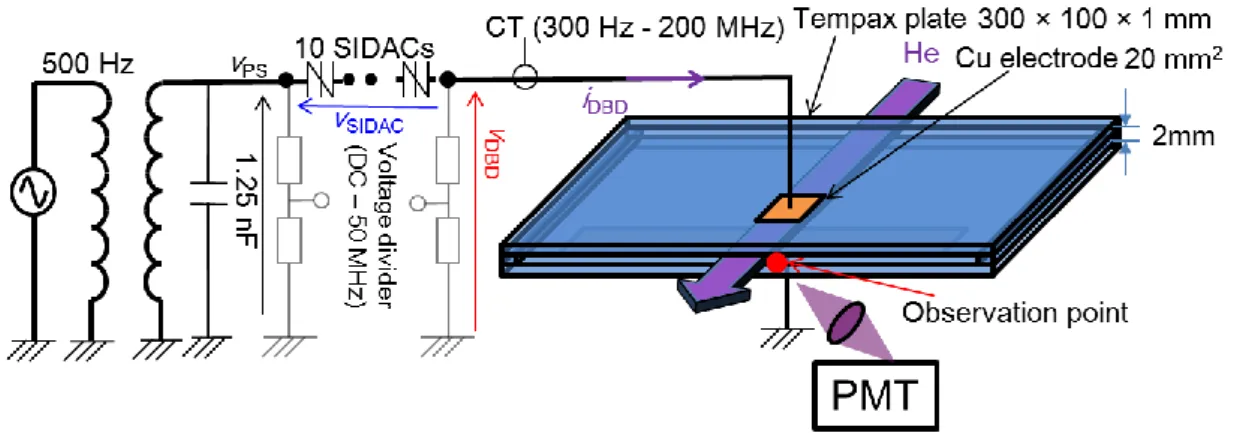
Figure 2-1 DBD generation in gas phase- experimental setup ... 20
Figure 2-2 DBD generation in gas phase -experimental result, DBD photograph (a) discharge waveform in one cycle of applied voltage (b), and enlargement waveform of one typical discharge (c) ... 21
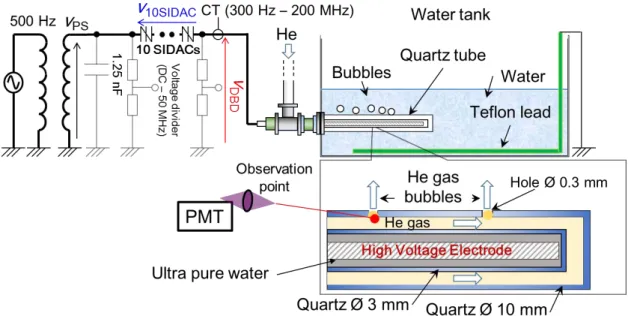
Figure 2-3 DBD generation in bubbles in water- experimental setup ... 23
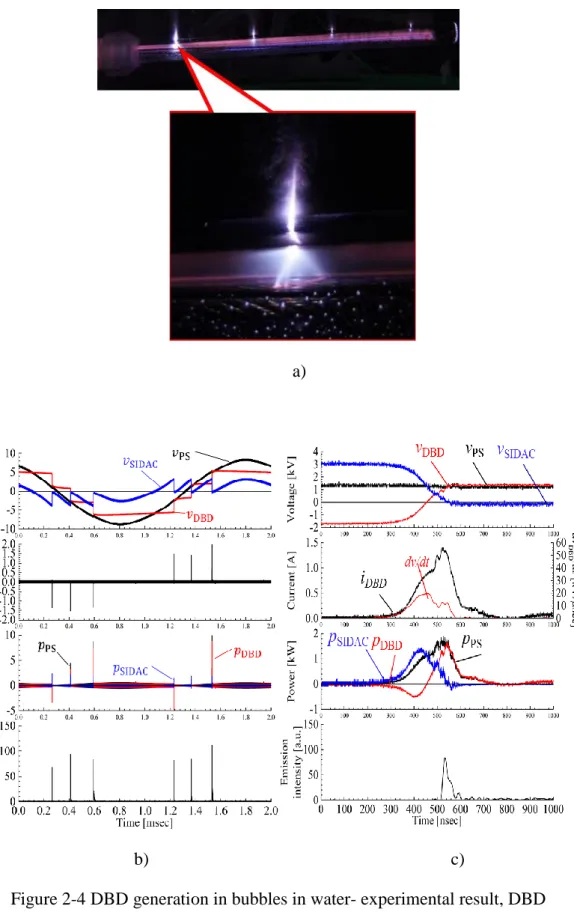
Figure 2-4 DBD generation in bubbles in water- experimental result, DBD photograph (a), discharge waveform in one cycle of applied voltage (b), and enlargement waveform of one typical discharge (c) ... 25
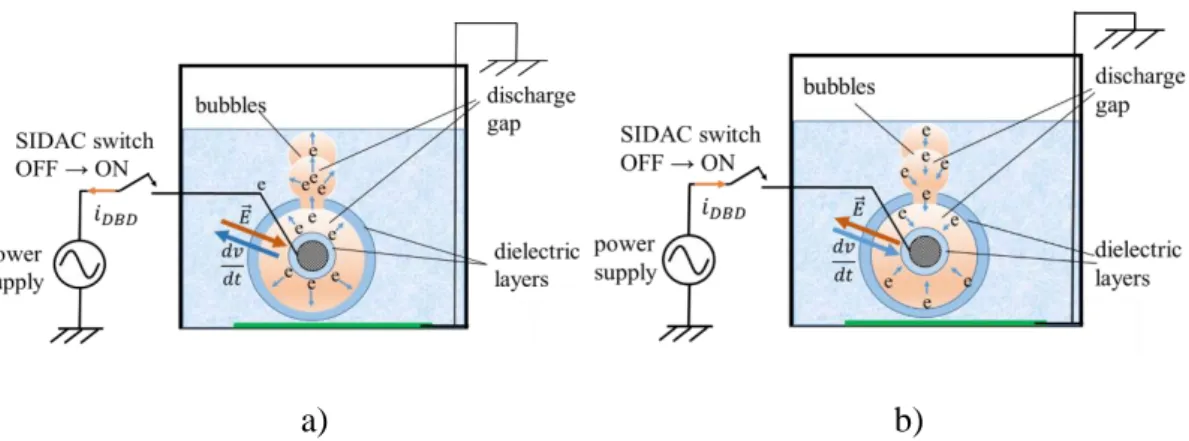
Figure 2-5 Schematic of discharge progress in bubbles in water, positive discharge (a), and negative discharge (b) ... 26
Figure 2-6 Equivalent circuit of DBD reactor in gas phase (a), in water (b) ... 26
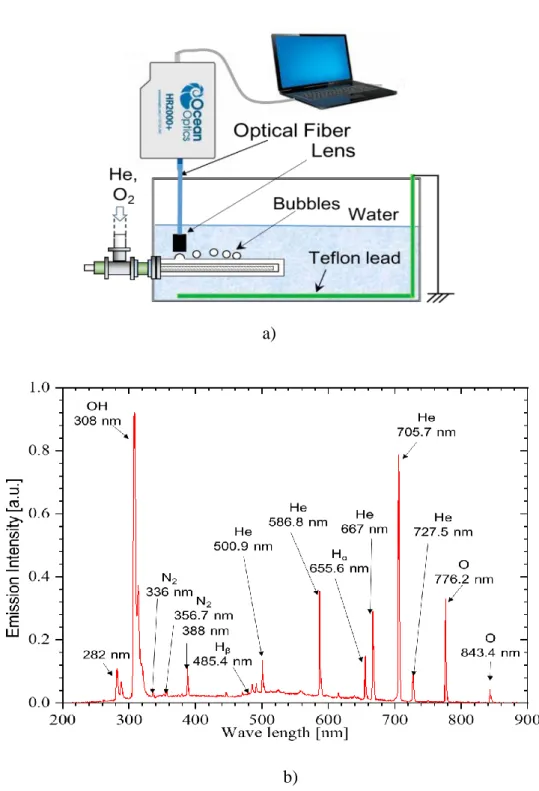
Figure 2-7 Emission spectra of the DBD plasma generated in 0.02 slm O
2and 5slm He mixture gas, measurement setup (a), and result (b) ... 27
Figure 2-8 Chemical structure of MB, C
16H
18N
3ClS ... 28
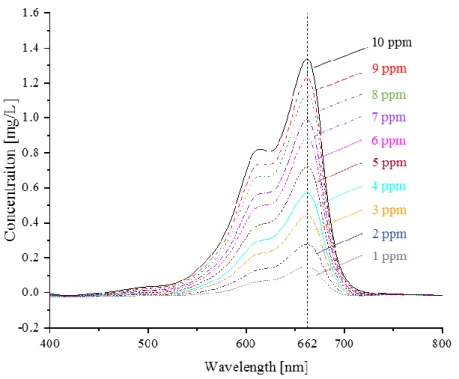
Figure 2-9 Absorption spectra of MB solution at different concentration levels ... 29
Figure 2-10 Calibration curve of average absorbance versus concentration ... 29
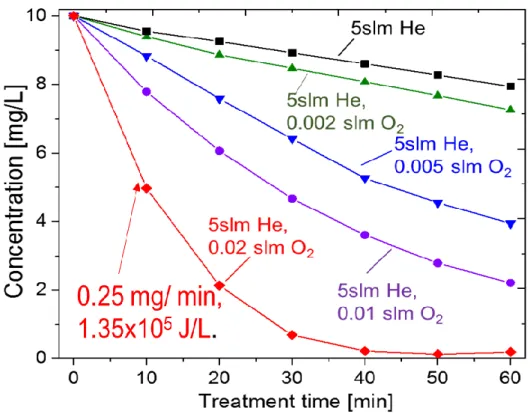
Figure 2-11 Time evolution of MB concentration treated by DBD plasmas ... 30
Figure 2-12 Absorption spectra of MB solution exposed to O
2added Ar plasma with the increase of treatment time ... 30
Figure 2-13 Fading color in MB samples by 5 slm He mixed 0.02 slm O
2plasma ... 31
Figure 3-1 Modular structure of high voltage pulse source ... 34
Figure 3-2 Setup of experiment with a resistor, diagram of circuit connection
(a) and equivalent circuit (b) ... 37
Figure 3-3 Results of experiment with a resistor, overall waveform in case of positive pulses (a), overall waveform in case of negative pulses (b), enlargement waveforms around conductive state of SIDAC (c), and enlargement waveforms around positive current peaks (d) ... 38
Figure 3-4 Dependence of leakage current (i
Leak) on voltage derivative(𝑑𝑣𝑅/
𝑑𝑡), estimated stray capacitance ... 40Figure 3-5 Equivalent circuit with a resistor load used for calculating the efficiency of the whole system 41 Figure 3-6 Capacitor (1.25 nF) voltage waveform... 41
Figure 3-7 . Experimental setup of DBD generation in gas phase using the DC power supply, diagram of circuit connection (a) and equivalent circuit (b) ... 43
Figure 3-8 Results of experiment with load of DBD in gas phase, overall waveform in case of positive pulses (a), overall waveform in case of negative pulses (b), and enlargement waveforms around negative current peaks (c) ... 46
Figure 3-9 Equivalent circuit with a gas phase DBD load used for calculating the efficiency of the whole system... 48
Figure 3-10 Enlargement waveform of voltage on charge capacitor (1.25 nF) of DBD generation using the DC power supply in bubbles in water ... 48
Figure 3-11 Experimental setup of DBD generation in water using the DC power supply ... 49
Figure 3-12 Experimental results of DBD generation in water using the DC power supply overall waveform (a) and typical enlargement waveform (b) ... 50
Figure 3-13 Enlargement waveform of voltage on charge capacitor (1.25 nF) of DBD generation using the DC power supply in bubbles in water ... 51
Figure 5-1 Setup of testing experiment on vibration isolation table ... 57
Figure 5-2 Testing result shows strong effect of stray capacitance ... 58
Figure 5-3 Setup of testing experiment on a resin sheet ... 59
Figure 5-4 Overall waveform obtained from testing experiment on the resin sheet ... 60
Figure 5-5 Enlargement waveforms from negative side of testing experiment on resin sheet... 61
Figure 5-6 Enlargement waveforms from positive side of testing experiment on resin sheet... 61
Figure 5-7 Spacer used for separating circuit element from ground ... 62
Figure 5-8 Experimental result of DBD generation in gas phase using the DC power supply in glass reactor ... 64
Figure 5-9 Setups of experiment with conventional AC power supply ... 64
Figure 5-10 Results of experiment with AC power supply at low frequency in
glass reactor ... 66
Figure 5-11 Results of experiment with reactor made from Ceramic plates and Primary voltage of 50V, 60 Hz ... 67
Figure 5-12 DBD reactor configuration ... 68
Figure 5-13 Experimental results obtained by using reactor of ceramic plates ... 69
Figure 5-14 Experiment setup with load of DBD reactor ... 71
Figure 5-15 Results of experiment with load of DBD reactor paralleled to additional resistor ... 72
Figure 5-16 Electrode configuration ... 74
Figure 5-17 Experimental setup of DBD generation in water ... 75
Figure 5-18 Experimental results with the new ground electrode, 500 sccm He
gas flow ... 76
List of Tables
Table 1-1 Typical operation conditions of barrier discharges in air [18] ... 11
Table 1-2 Characteristic of a microdischarge channel in air at atmospheric pressure [18]... 13
Table 1-3 Electrical Characteristic of SIDAC (K1V38 (W) Shindengen Electric Mfg.Co.Ltd) ... 17
Table 2-1 Experimental condition ... 20
Table 3-1 Specification of designed pulse source... 36
Table 3-2 Experimental condition for DBD generation using the DC power supply ... 44
Table 5-1 Experimental condition (testing experiment) ... 59
Table 5-2 Condition of experiment with 60 Hz AC power supply ... 64
Table 5-3 Properties of Pyrex glass plate and Ceramic plate ... 68
Table 5-4 Condition of experiment of DBD generation using DC power supply and glass reactor connected parallel to an additional resistor ... 71
Table 5-5 Condition of experiment of DBD generation in bubbles in water
using the DC power supply and cylindrical glass electrode ... 74
Acknowledgements
I am grateful to Vietnamese government (project 911) for the financial support.
I would like to express my special appreciation and thanks to my supervisors Prof. Yoshihiko Uesugi , Prof. Yasunori Tanaka , Prof. Tatsuo Ishijima., for the continuous support of my Ph.D study and related research, for your patience, motivation, and immense knowledge. Your guidance helped me all the time of doing research.
Besides my supervisors, I would like to thank my groupmates Yusuke Heira, Misaki Hayashi for instructions, discussions from my first day I arrived Japan and for all days working together. And I thank my labmates for technical support and for all the fun we have had.
A special thanks to my family. Your love encourage me every day and provide
me endless inspiration. And a special thanks to teachers of Asahimachi nursery school
who help me taking care of my two kids so I can focus on my research.
Chapter 1: Introduction
Nowadays, demands on the water environment quality are rapidly increasing.
Various methods of water treatment has been developed and used widely. These treating methods can be divided into four main groups: physical, chemical, biological, and recently hot topical group of so called Advanced Oxidation Technologies (AOTs) involving inputting energy into waste water to produce strong oxidizers without harmful by-products. The Advanced Oxidation Technologies (AOTs) particularly non- thermal plasmas based on electrical discharges have been widely investigated.
Dielectric barrier discharges (DBDs) as a typical type of non-equilibrium atmospheric pressure plasma discharges (APPDs) generate large amounts of reactive oxygen species (ROS) and sterilizing agents such as UV light having been proved to be efficient for water purification among various forms of electrical discharge systems.
The most important species is hydroxyl radicals, which have a considerably high oxidation potential and followed by oxygen radicals, ozone and hydrogen peroxide.
Dielectric-barrier discharge (DBD) is a discharge obtained in gas space between two electrodes, in which at least one of the electrodes is covered by a dielectric material.
The dielectric layers in the configuration of the DBD reactor make this discharge characterized as a capacitive load, self-terminated discharge, which is generated by a high frequency alternating voltage source or a high frequency repetitive pulse power source.
SIDAC or Silicon Diodes for Alternating Current is a bidirectional high voltage switching device designed for direct interface with the power line. It has high break-over voltage and power handling capabilities. The high-speed switching characteristic of SIDAC has been used for generating low-cost high voltage pulses with tens of kV derivation that have been effectively applied to DBD generation.
In this study, DBD plasmas in water were investigated as a sequence of a
bubble formation and an electronic process within the bubbles. A cylindrical electrode
inside a glass tube with a number of microsize holes and an inexpensive circuit using
a number of SIDAC connected to a high voltage transformer at commercial frequency
have been used. The gas bubbles are simply produced at initial stage by gas flow
through microsize glass holes. When applied voltage meets or exceeds breakover voltage of the series connecting SIDACs, these SIDACs switch from a blocking state to a conducting state. Then, high voltage pulses with tens of kilovolt derivation are generated, as the bubble formed an electrical breakdown instantaneously takes place within the bubble. The generation of such DBD plasma should be analyzed sufficiently when its characteristics are governed by two switches: the SIDAC switching characteristic and the dielectric layers. Plasma diagnostics have been carried out by optical emission spectroscopy (OES) and electric measurements. Additionally, solution quality and formation of some chemical species are estimated by UV-VIS absorption spectroscopy, and colorimetric method.
Additionally, one of the constraints DBD application to waste water treatment is the requirement of the expensive and complex power source configurations that could make the DBD installation expensive and selective. The prospect of an increase in the market share of the application of DBD generation still faces the challenges oriented with the need of the compact and affordable power supplies. Therefore, this work also focused on design, construction, and optimization of configuration of a novel high voltage pulse power source for large-scale dielectric barrier discharge (DBD) generation by using a device called Silicon Diodes for Alternating Current (SIDAC) and the self-terminated characteristic of DBD without external controlling. The DC power supply has been designed in a simple modular structure, non-control requirement, the transformer elimination, minimum number of levels in voltage conversion required to achieve the desired operating condition leading to a reduction in size, weight, simple maintenance and high scalability of the DBD generator.
Fundamental results and conclusions achieved during this work have been published in scientific journal, presented at conferences and attached in Appendices
1.1 BACKGROUND OF PLASMA 1.1.1 Plasma as a fourth state of matter
Matter in the universe is often scientifically classified in terms of four states:
solid, liquid, gaseous, and plasma. In this view, at low temperatures, matter starts out
as a solid, when it is heated until solid bond is broken, it melts to form a liquid, and if
more heat is added to break liquid bond then it vaporizes to become a gas. Finally, if
still more heat is added, the temperature rises, and the individual atoms break apart
Figure 1-1 Four states of matter
Figure 1-2 Plasma in Nature
into electrons and positively charged ions, thus forming a fourth state of matter called plasma (Figure 1-1)
In nature, majority of the universe exist in plasma state exhibiting phenomena outside the earth such as, solar corona, solar wind, nebula, and aurora borealis. In the earth’s atmosphere, plasma is often observed as a transient event in the phenomenon of lightning strokes (Figure 1-2). Borealis occur at extremely low pressures whereas lighting strikes occur at relatively high pressures.
It has been about 150 years, from the first day, when Sir William Crookes
identified a fourth state of matter in 1879, later Irving Langmuir gave this state a
name, plasma, in 1928, plasma has been artificially generated by supplying energy to
gases, solids, liquids, and used for various applications from light generation, surface
modification, controlled nuclear fusion, to medical treatment, disinfection and depollution [1].
1.1.1 Definition of Plasma
When the gas phase of matter is given a sufficient energy, it will turn into plasma by the exchange of energy through collision, excitation and ionization. The plasma, consisting of a mixture of electrons, ions and neutral particles is electrically neutral overall [2]. Thus plasma follows the quasi-neutrality of charges, then we have a definition as follow:
A plasma is a quasi-neutral gas of charged particles (and neutral particles) in which the particle interaction are predominantly collective.
Quasi-neutral gas is a medium in which there is approximately equal number of positive and negative charged particles on a scale long compared to collective interaction scale length.
Distinguishing from interaction between neutral-neutral or charge-neutral as just an interaction between 2-body due to short-range forces, in plasma, the charged particles interact simultaneously with many other charged particles due to long-range coulomb forces. The interaction distance is limited by polarizing effects of a charged particle characterized by a distance named Debye length.
1.1.2 Debye length.
The Debye length is an important physical parameter for the description of a plasma. It provides a measure of the distance over which the influence of the electric field of an individual charged particle (or of a surface at some nonzero potential) is felt by the other charged particles inside the plasma. The charged particles arrange themselves in such a way as to effectively shield any electrostatic fields within a distance of the order of the Debye length. This shielding of electrostatic fields is a consequence of the collective effects of the plasma particles. A calculation of the shielding distance was first performed by Debye, for an electrolyte. It is shown that the Debye length is directly proportional to the square root of the temperature (T) and inversely proportional to the square root of the electron number density (n
e) according to
1
0 2
(
2)
D e
kT n e
(1.1)
The following are useful forms of Eq (1.1)
123
7430
D
[m ]
e
kT eV
n
[m] (1.2)
Generally, 𝜆
Dis very small. For example, in a gas discharge, where typical values for T and n
eare around 10
4K and 10
16m
-3, respectively, we have 𝜆
D= 10
-4m. For the Earth's ionosphere, typical values can be taken as n
e= 10
12m
-3and T = 10
3K, yielding
𝜆D= 10
-3m. A criterion for an ionized gas to be a plasma is that it be dense enough that 𝜆
Dis much smaller than system dimension, L [1] .
1.1.3 Concept of Temperature
A plasma is an ensemble of particles, electrons (e) , ions (i) and neutrals (n) with different positions (r) and velocities (v) which move under the influence of external forces (electromagnetic fields, gravity) and internal collision processes (ionization, Coulomb, charge exchange etc.). A gas in thermal equilibrium has particles of all velocities, and the most probable distribution of these velocities is known as the Maxwellian distribution (Figure 1-3), and, in three dimensions and sum overall direction, expressed by equations,
1 32 2 22
4 ( ) exp(- )
2 2
dn
vn m mv
f v v
dv kT kT
(1.3)
0
n f v dv
(1.4)
Figure 1-3 Maxwell-Boltzmann distribution of velocities [1]
Figure 1-4 Maxwell-Boltzmann distribution of velocities as progressive temperature [1]
From this distribution (Figure 1-3), the most probable velocity can be derived as
12
( 2 )
m
v kT
m (1.5) corresponding to the maximum of the velocity distribution function, and the mean thermal velocity (average speed of a particle) as
1 2 0
1 8
( ) kT
v vf v dv
n m
(1.6), the root mean square speed (rms) of the particles
given by
1 1
2 2
2 0
1 3
rms
( )
v v f v dv kT
n m
(1.7). The number density of molecules with velocities between v and v +dv is given by dn
v.The width of the distribution is characterized by the constant T (Figure 1-4). If all types of particles have the same temperature; the velocity of electrons will be very large compared with those of other heavy species.
Temperatures, T, in a plasma, as in any gaseous medium, are defined by the average kinetic energy of a species (molecule, atom, ion or electron). From this distribution, the mean kinetic energy of particles of any species i with a mass m
iand a velocity v
i, in 3 dimensions, expressed as:
2 0 2
0
1 1 3
(
2 2 2
)
av i i
mv f v dv
E m v kT
f v dv
(1.8)
where
12 2
v
iis the rms velocity of species i.
Since T and E
avare so closely related, it is customary in plasma physics to give temperatures in units of energy. For kT = 1 e V = 1.6 x 10
-19J, we have the conversion factor is
1 eV 11600 K (1.9)
By a 2-eV plasma we mean that kT = 2 eV, or E
av= 3 eV in three dimensions. [2]. It is interesting that a plasma can have several temperatures at the same time. It often happens that the ions (heavy particles) and the electrons have separate Maxwellian distributions with different temperatures T
i(T
h) and T
e. Then each species can be in its own thermal equilibrium, but the plasma may not last long enough for the two temperatures to equalize.
1.1.4 Plasma generation by electric discharge
The most common method of plasma generation is by applying an electric field (E) to neutral gas. If the applied field exceeds a breakdown threshold a gas discharge and thus plasma is formed by exchanging energy through collision, excitation and ionization. The most common form of energy exchange between the plasma particles is the collision. When particles interact or collide, the momentum and energy must be conserved which means that plasma must follow the mass and momentum conservation equations. There are two distinguish cases that particles may collide. (I) Elastic collision: In this case momentum is redistributed among particles and total kinetic energy remains unchanged and (II) Inelastic collision: In this case momentum is redistributed among particles but a fraction of the initial kinetic energy is transferred to internal energy in one or more of the particles and thus excited states or ions are formed. In such a discharge, the mobile electrons pick up energy from the applied electric field and then transfer part of this energy to the heavy species through collisions. Because, the mass of electrons m
eis very low compared with that of ions and other heavy particles m
h( 1/1856 times the mass of the lightest atom H), their velocity is very high compared with that of heavy species and most collisions involve electrons. The energy transferred from an electron to a heavy particle in a single collision can be expressed as
e h eh
2
3 ( )
2
k T T m
m (1.10). Then, the total energy
transferred from an electron to a heavy particle per unit of time will be the amount from (eq.10) multiplied by collision frequency ( ),
2 3 ( - ) 2
e
eh e h
h
E k T T m
m
(1.11).
The energy that an electron acquires from the electric field (E) between collisions is given by eE v
̅̅̅̅̅, where 𝑣dτ
e ̅̅̅ is the average drift velocity and τ𝑑 eis the average free fly time between collisions, defined as τ
e l
e/ v
e, where v
̅e= (8kT
e⁄πm
e)
1/2 and 𝑙𝑒is the mean free path of electrons, and l
e∼1/p (1.12). It can be seen that, the mean energy of electrons gained between the collisions depends on the ratio of electric field (E) to the gas pressure (p) (density of the gas). High pressures will increase the collision frequency, and decrease the electron’s mean free path between collisions. Only in the case of small values of E/p, the temperature of electrons and heavy particles approach each other. Thus, this is a basic requirement for local thermodynamic equilibrium (LTE) in plasma. In addition, LTE conditions require chemical equilibrium as well as restrictions on the gradients. When these conditions are met, the plasma is termed as thermal plasma. Conversely, the plasma is termed a non-equilibrium plasma or non- thermal plasma (T
e> T
h) [3].
1.1.5 Classifications of plasma
Figure 1-5 Classifications of plasma in terms of electron density and temperature [1]
Broadly speaking, plasma in kinetic equilibrium can be distinguished into thermal (electrons and the heavy particles are at the same temperature, (T
e= T
ion= T
gas) and non-thermal plasma (ions and neutrals stay at a low temperature (sometimes room temperature), whereas electrons are much hotter (T
e>> T
ion= T
gas). Additionally, plasmas may be classified in different ways based on different factors. Sometimes plasmas are categorized as natural or man-made plasmas. The plasma states cover an extremely wide range of parameters such as particle densities, temperatures and pressures. There for, it is customary to classify them in terms of electron temperatures and electron densities.
Figure 1-5 shows such classifications. Extremely tenuous plasmas (in solar corona) may assume temperatures exceeding 10
6K, while plasmas of similar densities in the ionosphere may have temperatures of 10
3K or even lower. Flames classified as plasmas, show somewhat higher electron densities and temperatures. Glow discharges, which are typically operated in a pressure range from 10
−4to 1 kPa, reveal electron temperatures on the order of 10
4K and heavy-particle temperatures close to room temperature. In a fluorescent lamp, for example, the electron temperature may reach 2.5 x 10
4K, but the heavy-particle temperature remains close to 300 K. Extreme conditions in terms of electron density and temperature exist in thermonuclear fusion plasmas. In the case of inertial confinement fusion plasmas, electron and ion densities may exceed 10
26m
−3, and temperatures are typically above 10
6K and may be as high as 10
8K. Thermal plasmas reveal temperatures around 10
4K with electron densities ranging from 10
21to 10
26m
−3.
The pressure is also a very important parameter through which plasmas can be categorized. For example, two of the earliest known plasma phenomena are lighting strikes and borealis which occur at relatively high and extremely low pressures respectively.
Some examples of generated in a laboratory at low-pressure discharges plasma are: glow discharge plasmas, capacitively coupled plasma (CCP), inductively coupled plasma (ICP), wave heated plasma, and atmospheric-pressure plasmas are arc discharge, corona discharge, dielectric barrier discharge (DBD), capacitive discharge.
In a laboratory setting and for industrial use, plasma can be also categorized by other
point of views, for instant, by types of power source used to generate the plasma; DC,
RF and microwave, degrees of ionization within the plasma; fully ionized, partially
ionized, weakly ionized.
1.2 DIELECTRIC BARRIER DISCHARGES
Dielectric-barrier discharge (DBDs) is named for a discharge obtained in gas space between two electrodes, in which at least one of the electrodes is covered by dielectric material. It has been well-documented for more than a century from the first experimental investigation reported by Werner von Siemens in 1857 for the generation of ozone. As a typical type of non-equilibrium plasma at atmospheric pressure, it provide the effective generation of atoms, radicals and excited species by energetic electrons with a moderate gas temperature. A possibility to operate at low gas temperature and atmospheric pressure is an important advantage for their application [4]. Its simple scalability offers a number of applications in industry such as ozone generation [5] [6], thin film fabrication [7], light source [8] [9], surface modification [10], in medical treatment [11], [12] in environmental treatment such as toxic gas decomposition [13] and pollution control [14], [15] [16].
1.2.1 Principle and configuration
Typical configuration of DBD reactors are shown in Figure 1-6. The main basis configuration is planar type, however, cylindrical type is also commonly used. In all configuration, there is presence of one or more dielectric layers in the current path between the metallic electrodes through the discharge gap. The dielectric layer plays an important role in limiting the amount of charge transported to electrodes, thus prevents the discharge transferring to the arc, and keeps the plasma in the non-thermal regime. When a breakdown occurs, the cathode/anode layer is charged by incoming positive ions/electrons, the charge accumulation on dielectric layer reduces the electric field, hinders charge transport towards the electrode, make DBD become a self- terminated discharge. As an insulator, the dielectric cannot pass a dc current, therefore, DBDs require a high frequency alternating voltage source or a high frequency repetitive pulse power source for the operation [4].
Dielectric barrier is usually made of glass, quartz, ceramics or other insulating
materials as plastic foils, PTFE (Teflon) with low dielectric loses at the working
frequency and high electric strength. The DBD has a large surface-to-volume ratio,
which promotes diffusion losses and maintains a low gas temperature. In case of
generating by an AC high voltage, a breakdown occurs twice per high voltage period
during the rising slope of the applied voltage and then stops before the voltage reaches
Figure 1-6 Typical electrode arrangements of barrier discharges [17]
Table 1-1 Typical operation conditions of barrier discharges in air [18]
Electric field E of the first breakdown
≅ 150 Td (p=1 bar, T=300 K)Voltage V
pp3-20 kV
Repetition frequency f 50 Hz–10 kHz
Pressure p 1–3 bar
Gap distance g 0.2–5 mm
Dielectric material glass, Al
2O
3, ferroelectrics, …
Dielectric thickness d 0.5–2 mm
Relative dielectric permittivity e
r5–10 (glass), … , 7000 (ferroelectrics)
the maximum value. In case of driving by unipolar high voltage pulse, the breakdown
firstly occurs at the rising slope of the pulse, then, the memory effects from charges
accumulated on dielectric surface induce an electric field which causes the second
breakdown (in opposite polarity with the first breakdown) at the falling slope of the
pulse in the same period of high voltage. Typical operation condition of barrier discharges in air is shown in Table 1-1.
1.2.2 Microdischarge formation
There are two different modes of DBDs. At low pressure, or in a very small gas gap, with particular working gas, such discharge can be referred as diffuse discharge or glow discharge used in i.e. semiconductor industry [4] [19]. However, at atmospheric pressure, the discharge tend to constrict and is characterized as repetitive micro-discharges, visually appeared as thin discharge channels (Figure 1-7), often named filaments, applied in i.e. ozone generation or pollution treatment. If the local electric field strength in the gas gap arrives the ignition level. The formation of a micro discharge starts by initial electrons released at the cathode, then an avalanche travels toward the anode, this avalanche soon reaches the streamer state that create a space charge, an additional electric field, and enhances the growth of secondary electron avalanches locally, finally this streamer bridges the gap and a micro-discharge is formed. Immediately afterward, charges deposit on the dielectric surface and lead to a local collapse of the electric field in the area of the surface discharge, forms extinction of discharge channel. In this phenomena, the dielectric layers limit the amount of charge transported by a micro discharge and energy deposited in a microdischarge, make the microdischarge channels spreading on the barrier surface and covering a
Figure 1-7 Sketch of a microdischarge and a simple equivalent circuit [4]
region much larger than the original channel diameter. As shown in Table 1-2, in air at 1 bar and 1 mm discharge gap the microdischarges have a duration of about 10–100 ns with a total transferred charge of 0.1–10 nC. Discharge current density of a microdischarge can reach up to 1000 A cm
−2, because of the short duration, the remaining channel is not heated significantly. In most cases, the duration of microdischarges is mainly determined by the gas properties as well as the reactor configuration (gas gap, type and thickness of barriers), however it do not depend on external driving circuit. At the positions where microdischarges have already occurred, presence of residual charges on the dielectric cause the reduction in electric field, if the external voltage is rising additionally, microdischarges will occur at new positions.
When the voltage is reversed, however, the next microdischarges tends to form in the old microdischarge locations. An increase in the amplitude of AC applied voltage, just leads to a higher number of microdischarge per haft period of the AC voltage, however not the charge transported by a microdischarge. The dielectric in this case distributes the discharge over the electrode area. High-voltage low-frequency operation tends to distribute the microdischarges on the available dielectric surface, while low-voltage, high frequency operation tends to reignite the old microdischarge channels every half period [4].
Table 1-2 Characteristic of a microdischarge channel in air at atmospheric pressure [18]
Duration 10-100 ns Total Charge 10
-10– 10
-9C Filament Radius about 0.1 mm Electron Density 10
20- 10
21m-3 Peak Current 0.1 A Mean Electron Energy 1-10 eV
Current Density 10
6– 10
7A m
-2Filament Temperature close to average gas
In the case of DBD driving by pulse source, if the voltage rise time is extremely
short, so that a large number of microdischarges may be started simultaneously leading
to a lack of available area on the dielectric for their surface discharges, therefore
individual microdischarges have to compete for the available surface area of the
dielectric to deposit their charge patterns. This situation can lead to weaker single
microdischarge generated [4]. Raising the power for a given configuration means
generating more microdischarges per unit of time and per unit of electrode surface area.
This characteristic allows us to investigate and optimize microdischarge properties for a given discharge gap and power density in laboratory set-up, then scale-up to very large electrode surface for industrial applications without any problem [4].
1.2.3 Electrical characteristic
To characterize the overall discharge behavior, the simplest electrical approach is the lumped element equivalent electric circuit as a circuit shown in Figure 1-7. Typical waveforms of applied voltage v(t), gap voltage v
g(t), breakdown voltage v
b(t), currents are shown in Figure 1-8. When a voltage is less than a breakdown threshold (v
b(t)), DBD reactor works as a capacitive load with capacitance called C
DBDconsisting of capacitances C
drepresent for capacitance of dielectric layer, C
grepresent capacitance of gas gap, and the current during this time is just capacitive current or called as displacement current (i
disp) caused by the change of voltage applied to the reactor and proportional to rate of this change (dv/dt). When the applied voltage keep rising to reach the breakdown voltage that depends on gas properties, its pressure (density) and discharge gap [20], local breakdown in the gap is initiated, then discharge establishes a conducting channel between electrodes that is symbolized by closing a switch letting discharge current (i
dis) flow through plasma channel whose resistance R
prapidly changes with the time. This discharge current (i
dis) obtained between duration from inception (‘i’) and termination (‘t’) of the discharge is caused by the movement of charges across discharge gap. The current i(t) in the circuit now is included two currents superpositioned, one is the discharge current (i
dis), the other is displacement current (i
disp). The equations for the current i(t), the gap voltage v
g(t) and the charge Q
p(t) transported by plasma are as follows:
d
( ) ( ) 1 d v
gapt v t i t t
C
(1.13)
i
=i
dis +i
disp(1.14) i
disp = CDBDdv/dt (1.15)
d
p dis
Q t
i t (1.16)
Electric energy (e) consumed per voltage cycle and the electric power (p) can be
estimated by the following relations:
Figure 1-8 Schematic of applied voltage v(t), gap voltage v
g(t), breakdown voltage (v
b), main current i(t), displacement current i
disp(t), and discharge current i
dis(t) [20]
v .
p t
t i t (1.17)
e t
p t d t (1.18)
1
dpavg t p t t
T
![Figure 1-5 Classifications of plasma in terms of electron density and temperature [1]](https://thumb-ap.123doks.com/thumbv2/123deta/5639766.2003229/19.892.120.762.745.1065/figure-classifications-plasma-terms-electron-density-temperature.webp)