Termi nal Res t ri ct i on Fragment at i on Lengt h Pol ymorphi s m Anal ys i s of 16S rRNA Genes f or t he Charact eri zat i on of Bact eri al Communi t y
St ruct ure i n t he Rumen of Sheep Fed Di f f erent Di et s
Ei i chi M
IYAGAWA,Jyunki O
KUYAMA,Yut aka H
ANDA,Kazuo S
ATOMas at er u K
OIWAand Ei r yu
O
KAMOTO酪農学園大学紀要 別 刷 第 31巻 第 2 号
Repr inted fr om
”Jour nal of Rakuno Gakuen Uni ver s i t y”Vol . 31,No. 2( 2007)
Introduction
The dependence of rumen bacterial community structure on an animalʼ s diet is a well-documented fact (Dehority and Orpin, 1977). Until recently, any changes in an animalʼ s bacterial community have been monitored essentially using culture- dependent techniques. However, even when the largest number of colonies grew on a medium by these techniques, it usually only reached about one-tenth the number determined by the direct counting method (Suto, 1970;Minato et al., 1990).
Furthermore,analysis of these microbial commu- nities by culture methods requires a great deal of labor and time. Minato et al. (1990) proposed non-cultivation based techniques for investigating rumen bacterial communities, that is, method which employ counting, fractionation and chemotaxonomy. But there have also been limi- tations in clarifying microflora in rumen using these techniques. Recently,the molecular biolog- ical methods have brought new developments into the field, omitting the cultivation step. Molecu- lar biological analysis techniques which have been used to analyze rumen microbial communities include:dot blot hybridization (Attwood et al., 1988;Stahl et al., 1988), sequence analysis of 16S rDNA libraries (Whitford et al., 1998;Tajima et al., 1999;Kocherginskaya et al., 2001),denaturing
gradient gel electrophoresis (DGGE)(Kochergins- kaya et al., 2001), fluorescence in situ hybridiza- tion (FISH) (Yanagita et al., 2000), competitive PCR (Koike et al., 2003) and real-time PCR (Ta-
jima et al., 2001).
Terminal restriction fragment length polymor- phism (T-RFLP),which is also a molecular biolog- ical method, is a PCR-based method for rapidly comparing bacterial communities independent of culture or cloning (Kitts,2001). The method was first applied to a mixture of different pure cul- tures of bacteria and was found to be useful for defining the number of operational taxonomic units (OTUs) present (Avaniss-Aghajani et al., 1994). Following this,T-RFLP analysis has been implemented in the characterization of microbial diversity in activated sludge(Hiraishi et al.,2000),
soil (Blackwood et al., 2003;Dunber et al., 2000), human feces (Hayashi et al., 2002;Nagashima et al., 2003), the colon of pigs (Leser et al., 2000), marine sediment (Scala and Kerkhof, 2000), oral bacterial flora (Sakamoto et al., 2003)and so on.
T-RFLP analysis provides size in base pairs about each of the terminal restriction fragments (T-RF) detected. T-RF sizes can be compared to a database of theoretical T-RFs derived from sequence information. Since T-RFLP patterns also provide quantitative information on the rela- tive abundance of T-RFs, it is easier to process
J. Rakuno Gakuen Univ.,31(2):173〜184(2007)
Terminal Restriction Fragmentation Length Polymorphism Analysis of 16S rRNA Genes for the Characterization of Bacterial Community
Structure in the Rumen of Sheep Fed Different Diets
Eiichi M IYAGAWA , Jyunki O KUYAMA , Yutaka H ANDA , Kazuo S ATO , Masateru K OIWA and Eiryu O KAMOTO
(October 2006)
酪農学園大学酪農学部酪農学科農業微生物学研究室
Agricultural Microbiology, Department of Dairy Science, Faculty of Dairy Science, Rakuno Gakuen University, 582 Ebetsu, Hokkaido, 069‑8501, Japan
酪農学園大学酪農学部酪農学科酪農経営学研究室
Dairy Management, Department of Dairy Science, Rakuno Gakuen University, 582 Ebetsu, Hokkaido, 069‑8501, Japan 酪農学園大学獣医学部獣医学科生産動物医療学教室
Animal Medical Care (Large Animal), Department of Veterinary Medicine, Rakuno Gakuen University, 582 Ebetsu, Hokkaido, 069‑8501, Japan
data by appropriate numerical and statistical methods. Little has been reported on T-RFLP analysis in rumen bacterial ecosystems. The authors herein report the use of T-RFLP as a means to compare the bacterial community struc- ture in the rumen of sheep fed different diets.
Materials and Methods
Animals and feeds. Three Suffolk sheep (A, B, and C), weighing between 69-87 kg, and each fitted with a rumen fistula, were used. Before the experiments, animals were maintained on a common diet consisting of 1.0 kg of timothy hay and 0.1 kg of mixed feed (αMerit 16;Chubu Shi- ryo Co., Ltd.), being fed once a day. The sheep were reared in individual pens (Sanshin Industrial Co.)in a sheep house at Rakuno Gakuen Univer- sity. The feed was changed from the mixture of common feed and timothy hay to solely timothy hay (100%). After animals were maintained on the roughage for 10 days, the experiment was performed on the 11th day. Following this, the diet was changed from the timothy hay(100%)to a high concentrate diet (timothy hay and barley pellets;40%:60%,w
/w),increasing the amount of barley little by little to allow time (for 26 days) for adaptation. Timothy hay was cut in about 10 cm lengths by a cutter,and the barley pellets were mashed with a mixer. The high concentrate diet was prepared by mixing cut timothy and mashed barley pellets (40%:60%, w
/w) with water at a ratio of 0.7-0.8
/1 (wt
/wt). After the sheep were fed this diet for 10 days, the experiment was performed on the 11th day. The amount of both the roughage and high concentrate diets supplied once daily were about 1.5 % per body weight.
Mineral (Nippon Formula Feed Mfg Co.) and water were available ad libitum.
Preparation of rumen bacterial fraction. About 10 ml of the rumen contents were sampled using a stomach tube before the morning feed,and every two hours after feeding. The rumen contents were then squeezed though two layers of cheese- cloth. The rumen bacterial fraction from the filtrate were harvested by centrifugation (17,
400
×g, 10 min) at 4℃, washed with TE buffer(10mM Tris-HCl, 1 mM Na EDTA, pH8.0) until
the color of the supernatant disappeared. The precipitate was kept at -20
℃before use. Bovine rumen content obtained from a slaughterhouse located at Hayakita-cho in Hokkaido was used for the selection test of restriction enzymes for T-RFLP analysis.
Rumen fluid components. The pH of the rumen fluids was measured with a pH meterΦ260
(Beckman,U.S.A.)immediately after collection.
Volatile fatty acids (VFAs) and non-VFAs were analyzed using a gas chromatograph (Shimadzu GC-8A)equipped with a flame ionization detector with N as the carrier gas, by injecting 1μl of deproteinized sample with 24% meta-phophoric acid in 5N-H SO (Ueki et al.,1978). The ammo- nium concentration of rumen fluids was measured by the method of Chaney and Marbach (1962),
using NH Cl as the standard.
DNA extraction from the rumen bacterial frac- tion. Total DNA was extracted from the rumen bacterial fraction according to the protocol previ- ously described by Hiraishi et al. (2000) with minor modifications. The frozen sample (0.1-
0.2g;wet weight) was thawed at room tempera- ture and suspended in 1 ml of TE buffer,to which 10μl of lysozyme solution (1 mg
/ml;Wako Pure Chemical Industries, Ltd.) was added. The sus- pension was subjected to 2 min disruption with a beads homogenizer (CSC model BC
‑20, Central Scientific Commerce, Inc.). The suspension was centrifuged at 2,400
×g for 5 min with a highspeed refrigerated micro centrifuge (Tomy MX- 150:4
℃). The pellet was resuspended in TE buffer and disrupted two times in the same way.
These three successive supernatants (about 3 ml) were combined. Ten μl of proteinase K (10mg/
ml;Wako)was added to 1 ml of the supernatant in a 1.5 ml Eppendorf tube,and incubated at 55
℃for 30 min. Fifty μl of 10 % sodium dodecyl sulfate solution was put into the tube and reacted at 60
℃for 30 min. After treatment with hexa-
decyltrimethyl ammonium bromide, the super-
natant was treated with phenol-chloroform-
isoamyl alcohol (25:24:1, v
/v)which was shaken
for a few minutes, and centrifuged at 13,900
×g
for 5 min. Twofold volumes of isopropyl alcohol
and one tenth volumes of 3 M sodium acetate(pH
5.2)were added to the supernatant,and allowed to stand overnight at -20
℃. The solution was centrifuged at 17,400
×g for 30 min (4
℃),and the resulting supernatant was removed. One ml of 70% ethyl alcohol was added to the residue, and re-centrifuged at 17,400
×g for 10 min. After air-drying the precipitate, the purified DNA was dissolved in 50μl of TE buffer by shaking at 65℃
for a few minutes using a shaker.
PCR amplification of 16S rDNA. 16S rDNA fragments were amplified by polymerase chain reaction (PCR) with universal primers 27f (5ʼ -
AGAGTTTGATCCTGGCTCAG-3ʼ )and 1492r (5ʼ - GGCTACCTTGTTACGACTT-3ʼ ) (Lane, 1991) which corresponds to position 8 to 27 and 1510 to1492,respectively,in Escherichia coli 16S rRNA
(Brosius et al., 1978). These primers were pur- chased from Amersham-Pharmacia Biotech KK (Tokyo). PCR was performed with 0.5 ng of the purified DNA as the template. Thirty nine μl of distilled water, 200μM (each)of deoxynucleoside triphosphates, 0.2μM of both primers,and 1.25 U of Ex Taq DNA polymerase (Takara Shuzo Co.,
Kyoto) were included in the 50 μl reaction mix- ture. The PCR was conducted with a thermal cycler (ABI GeneAmp PCR System 9700,Applied Biosystems). PCR cycling consisted of an initial denaturation at 93
℃for 3 min;followed by 30 cycles of denaturation at 93
℃for 30 sec,anneal- ing at 53.5
℃for 30 sec,and extension at 72
℃for 90 sec;and a final extension at 72
℃for 7 min.
The PCR products were purified according to the manufacturerʼ s instructions using a QIAquick PCR purification kit (Qiagen Co., Tokyo). The forward primer labeled with 5ʼ -Fam (carboxy- fluorescein- N -hydroxysuccinimide ester-dimethyl sulfoxide), designated Fam-27f and the reverse primer 907r (5ʼ -CCGTCAATTCATTTGAGTTT- 3ʼ(Hiraishi et al,, 2000) were used in the next nested PCR. The cycle profiles were denatura- tion at 95
℃for 5min;followed by 30 cycles of denaturation at 95
℃at 30 sec,annealing at 55℃
for 30 sec, and extension at 72
℃for 1 min;and final extention at 72
℃for 7 min. The PCR products were purified using the PCR purification kit.
T-RFLP analysis . Three tandem tetrametric
restriction endonucleases, Hha I, Msp I, and Afa I, were used for cutting the 16S rDNA fragments.
The purified PCR products were cut with each of the restriction enzymes according to the manufac- turerʼ s instructions. The cut solution (1.0μl)was mixed with 12 μl of deionized formamide, and 0.5 μl of DNA fragment length standard (GS- 400HD, Applied Biosystems). The mixture was denatured at 95
℃for 2 min and chilled on ice prior to electrophoresis. The fluorescently labeled terminal restriction fragments (T-RFs) were analyzed by electrophoresis on an ABI PRISM 310 Genetic Analyzer (Applied Biosys- tems) in GeneScan mode using the default 50 fluorescence units. Electrophoresis conditions were 60
℃, 15 kv and 20 s for the injection time,with a run time of 30 min using POP-4 polymer.
T-RFLP electropherograms were analyzed with GeneScan 2.1 software (Applied Biosystems).
Numerical analysis. Differences in T-RFLP patterns among samples were evaluated using similarity values. The similarity values were obtained by the correlation coefficient of Pear-
son. A dendrogram based on the similarity val- ueʼ s matrix was constructed using the group- mean joining methods. The horizontal scale (“rescaled distance cluster combine”) used arbi- trary units from 0 to 25 in order to measure the similarity between the various samples that were clustered. All methods mentioned above were conducted using SPAA version 12.0J.
Results and Discussion
Diurnal changes of rumen fluid component after feeding
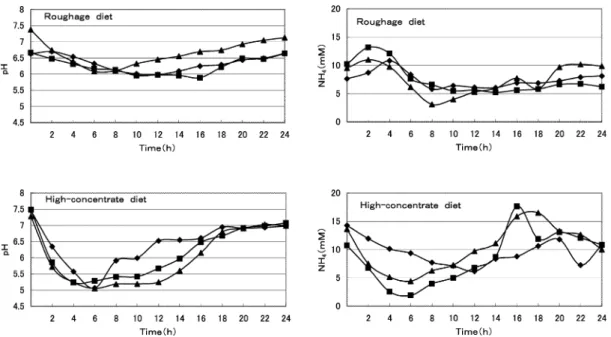
Slight drops (0.6,0.8,and 1.3)in the pH levels in rumen fluids of sheep (A,B,and C)fed the rough-
age diet were observed from pre-feeding values (6.6, 6.7, and 7.4)to the lowest values (6.0,5.9,and 6.1)at 12, 16, and 6 hr after feeding, respectively (Fig.1). Most of the pH values were well within what is considered normal (6.1-7.2) (Leedle et al.
1982)in our study,when the animals were fed the roughage diet. Generally, when animals are fed a diets containing a large proportion of readily fermentable carbohydrates, a considerable depressions in pH values will result (Mackie and
T-RFLP Analysis of Rumen Bacterial Community 175
Gilchrist, 1979;Mackie et al., 1978). In the pres- ent study, where the animals were fed the high- concentrate diet, remarkable decreases (2.4, 2.3, and 2.2)in the pH levels in rumen fluids of sheep (A, B, and C) were also found, that is, the pH levels changed from the pre-feeding values (7.5,
7.5, and 7.3)to the lowest values (5.1, 5.2 and 5.1) at 6,3 and 6 hrs after feeding,respectively(Fig.1).
Leedle et al. (1982) reported that ammonium concentration in rumen fluids of cattle fed high- forage diets increased temporarily after feeding and later decreased, and the concentration of rumen fluids fed a high-concentration diet de- creased gradually after feeding. In the present study,similar diurnal variations in ammonia con-
centrations were observed in both diets (Fig.1).
Ammonia concentrations of rumen fluids in sheep (A,B,and C)fed the roughage diet increased from pre-feeding values of 7.6, 10.2, and 9.5 mM to maximum values of 10.8, 13.2, and 11.0 mM at 4, 2,and 2 hr after feeding,and then leveled down to minimum values of 5.8, 5.2, and 3.1 mM at 8, 14, and 8 hr after feeding, respectively. Ammonia concentrations of rumen fluids in sheep (A,B,and C)fed the high-concentration diet decreased con-
tinuously from pre-feeding values of 14.3, 10.8, and 13.6 mM to minimum values of 6.2,1.9 and 4.4
mM at 12, 6, and 6 hr after feeding, and then leveled up in all sheep (Fig.1).
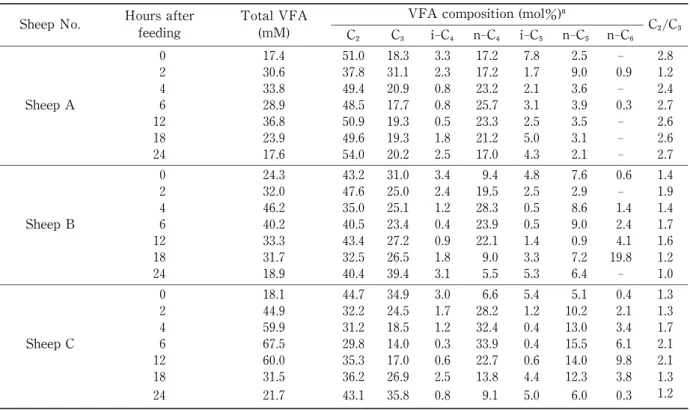
Table 1 and 2 show total volatile fatty acid (VFA), mol% of each VFA
/total VFA, and ace- tate
/propionate (A/ P) ratio in rumen fluids of sheep fed both the roughage diet and the high- concentration diets, respectively. Total VFA of rumen fluids in sheep (A,B,and C)fed the rough-
age diet ranged from pre-feeding values of 17.6, 27.3 and 24.5 mM,to the maximum values of 32.4, 33.4, and 33.2 mM at 12, 8, and 8 h after feeding, respectively. Total VFA of rumen fluids in ani- mals (A,B,and C)fed the high-concentration diet ranged from pre-feeding values of 17.4, 24.3, and 18.1 mM,to the maximum values of 36.8,46.2,and 67.5 mM at 12,4,and 6 h after feeding,respective- ly. The increase of total VFA after feeding was greater in the rumen fluids of sheep fed on the high-concentration diet than in those of sheep fed the roughage diet (especially in sheep C).
In the roughage diet, acetate constituted between 48.8 and 69.7 molar % of the total acids.
Propionate ranged from 20.6 to 30.2 molar % and butyrate ranged from 7.4 to 21.1 molar %. The A
/P ratios calculated from these data were from 1.6 to 3.0, and became the lowest values (1.6-2.3) at 4 hr after feeding. In the high-concentration
Fig.1
Diurnal changes in pH and ammonia levels in rumen fluid from sheep fed both the roughage and the high-concentrate diet.
sheep A (◆), sheep B (■), sheep C (▲).
diet, acetate constituted between 29.8 and 54.0 molar % of the total acids. Propionate and butyrate constituted 14.0-39.4 and 5.5-33.9 molar
%, respectively. The A
/P ratios were from 1.0 to 2.8. The extent of changes in total VFA concentration, and molar % of acetate, pro-
pionate, iso-valerate, and valerate, each, in the rumen fluids of sheep fed the high-concentrate diet, were greater than in those fed the roughage diet in all sheep. Iso-caproate was detected only when the high-concentrate diet was given. When pH in the rumen becomes lower than 5.5 when
Table 2
Diurnal variations in fermentation acids in ruminal fluid from animals fed on the high-concentrate diet.
VFA composition (mol%) Sheep No. Hours after
feeding Total VFA
(mM) C
/C
C C i
‑C n
‑C i
‑C n‑ C n
‑C 0 17.4 51.0 18.3 3.3 17.2 7.8 2.5
‑2.8 2 30.6 37.8 31.1 2.3 17.2 1.7 9.0 0.9 1.2 4 33.8 49.4 20.9 0.8 23.2 2.1 3.6
‑2.4 Sheep A 6 28.9 48.5 17.7 0.8 25.7 3.1 3.9 0.3 2.7 12 36.8 50.9 19.3 0.5 23.3 2.5 3.5
‑2.6 18 23.9 49.6 19.3 1.8 21.2 5.0 3.1
‑2.6 24 17.6 54.0 20.2 2.5 17.0 4.3 2.1
‑2.7 0 24.3 43.2 31.0 3.4 9.4 4.8 7.6 0.6 1.4 2 32.0 47.6 25.0 2.4 19.5 2.5 2.9
‑1.9 4 46.2 35.0 25.1 1.2 28.3 0.5 8.6 1.4 1.4 Sheep B 6 40.2 40.5 23.4 0.4 23.9 0.5 9.0 2.4 1.7 12 33.3 43.4 27.2 0.9 22.1 1.4 0.9 4.1 1.6 18 31.7 32.5 26.5 1.8 9.0 3.3 7.2 19.8 1.2 24 18.9 40.4 39.4 3.1 5.5 5.3 6.4
‑1.0 0 18.1 44.7 34.9 3.0 6.6 5.4 5.1 0.4 1.3 2 44.9 32.2 24.5 1.7 28.2 1.2 10.2 2.1 1.3 4 59.9 31.2 18.5 1.2 32.4 0.4 13.0 3.4 1.7 Sheep C 6 67.5 29.8 14.0 0.3 33.9 0.4 15.5 6.1 2.1 12 60.0 35.3 17.0 0.6 22.7 0.6 14.0 9.8 2.1 18 31.5 36.2 26.9 2.5 13.8 4.4 12.3 3.8 1.3 24 21.7 43.1 35.8 0.8 9.1 5.0 6.0 0.3 1.2
Some as Table 1.
Table 1
Diurnal variations in fermentation acids in ruminal fluid from animals fed on the roughage diet.
VFA composition (mol%) Sheep No. Hours after
feeding Total VFA
(mM) C
/C
C C i
‑C n
‑C i
‑C n
‑C
0 17.6 57.3 25.7 2.4 8.8 4.3 1.5 2.2 4 31.8 48.8 30.2 1.1 15.5 0.7 3.6 1.6 8 31.9 53.4 29.4 0.6 14.5
‑2.2 1.8
Sheep A 12 32.4 53.7 24.3 0.2 21.1
‑0.8 2.2
18 24.7 64.1 26.9 0.5 7.6
‑0.9 2.4
24 30.6 58.8 20.6 0.8 19.1
‑0.7 2.9 0 27.3 64.5 22.5 0.6 9.8 1.5 1.1 2.9 4 32.2 57.6 24.6 1.6 13.3 1.0 2.0 2.3 8 33.4 62.7 24.0 0.5 11.2
‑1.5 2.6
Sheep B 12 31.7 63.7 23.6 0.6 10.8
‑1.3 2.7
18 30.5 69.7 21.6 0.7 7.4
‑0.7 3.2
24 27.1 67.3 22.1 1.2 7.6 0.9 0.9 3.0
0 24.5 65.8 24.7 0.8 7.6
‑1.1 2.7
4 30.5 55.2 28.9 0.8 12.9
‑2.3 1.9 8 33.2 56.2 29.0 0.9 12.3
‑1.5 1.9
Sheep C 12 28.5 58.4 28.6 0.5 10.9
‑1.6 2.0
18 26.5 57.7 27.6 2.0 9.9 1.3 1.5 2.1
24 18.6 57.9 27.5 3.6 9.8
‑1.2 2.1
C , acetic acid;C , propionic acid;i-C , iso-butyric acid;n-C , n-butyric acid;i-C , iso-valeric acid;n-C , n-valeric acid.
177
T-RFLP Analysis of Rumen Bacterial Community
feeding on a high-grain diet, lactic acid accumu- lates in the rumen (Nocek, 1997). Although the pH of rumen fluids of sheep fed the high- concentrate diet became less than 5.5 in some cases, lactate (0.5 mM) was detected only in the rumen fluid of sheep A at 2 hr after feeding in the present study (data not shown). In conclusion,
serious diurnal variations of pH, NH concentra- tion and VFA concentration and VFA % were found in rumen fluids of sheep fed the high- concentrate diet. More so than in those of the sheep fed the roughage diet after feeding.
Selection of restriction enzyme
T-RFLP analysis was applied to the bovine rumen sample obtained from the slaughterhouse mentioned previously,and T-RFLP fingerprinting was compared with three tetrameric restriction enzymes. Hha I generated 13 terminal ristriction fragments (T-RFs),Msp I generated 25 T-RFs,and AfaI generated 6 T-RFs within a size of less than 400 bp (Fig.2). According to computer simula- tions of the sequences in the Ribosomal Database Project small-subunit database (Maidak et al., 1996), Msp I was one of the restriction enzymes that produced the largest number of unique T- RFs (Liu et al., 1997). As digestion with Msp I
resulted in the largest number of T-RFs in our experiment, and it was suggest that the enzyme could provide considerable elucidation in demon-
strating the differences in the bacterial commu- nities between the samples,only Msp I was used in the next analyses.
Diurnal changes on T-RFLP patterns after feed ing
-
Before feeding, similar R-RFLP patterns be- tween the three sheep were recognized in the roughage diet (RA-0, RB-0, and RC-0), however some animal-to-animal variations in the patterns was found concerning the high-concentration diet
(CA-0, CB-0, and CC-0). The representative T- RFLP profiles (RB-0 and CB-0 in sheep B)before being fed the roughage and the high-concentration diets are presented in Fig.3.
The diurnal changes of T-RFLP profiles were examined for both the roughage and the concen- trate diets. In the roughage diet, a total of 69 fragments (sheep A, 59;sheep B, 52;sheep C, 38 fragments, each) were detected, and in the high-
concentrate diet a total of 64 fragments (sheep A, 26;sheep B, 38;sheep C, 36 fragments) were detected (Table 3 and 4). In total,101 fragments were included in the analyses. In the experiment
Fig.2
T-RFLP analyses corresponding to the digestion with the restriction enzymes of HhaI,
MspI, and AfaI.
concerning the roughage diet,the number of frag- ments detected was between 28 and 35 in sheep A, 24 and 34 in sheep B, and between 19 and 31 in sheep C,respectively. In the experiment employ-
ing the high-concentrate diet,the number of frag- ments detected was between 7 and 16 in sheep A, 10 and 28 in sheep B, and between 14 and 23 in sheep C, respectively. Thirty-two T-RFs (89,93,
95, 121, 125, 145-147, 158, 186, 210, 213, 219, 221, 238, 273, 279-280, 282, 286-288, 291-292, 294-297, 310-311, and 332-333 bp) were universally dis- tributed,i.e.,they were found in all samples,while others varied in distribution and were related to specific diets. Thirty-seven fragments (82,86-87,
91,96,123-124,131,134-136,143,156,164,166,169, 209, 211-212, 214, 218, 224-225, 233-234, 266, 272, 276-277,281,283-285,301,305-306 and 313 bp)were found only in animals receiving the roughage diet,
and 32 fragments (32-39,44-45,47,90,92,116,128, 144, 155, 160, 163, 190-191, 201, 220, 240, 248, 252, 267,270,278,289,303 and 309 bp)were only found in animals which received the high-concentrate diet. Bacterial communities with different species compositions produce different and char- acteristic T-RFLP profiles. Diet type greatly influenced the rumen bacterial community, as is expressed by the T-RFLP profiles in the present
study.
A dendrogram (Fig.4) was constructed by the group-mean joining method on the basis of the similarity matrix data (data not shown). Sepa- rated clusters were formed between the roughage diet group and the high-concentrate diet group.
Rumen samples from sheep fed the roughage diet formed a close cluster having distances less than 9 units. The rumen samples from sheep fed the high-concentrate diet,sheep A and B,belonged to the same group having distances of less than 22 units. The samples from sheep C fed the concen- trate diet,formed another group having distances of less than 25 units against the samples from these sheep. Judging from such differences of distance in the dendrogram,it was presumed that the bacterial communities in the rumen were rather stable among the animals being fed the roughage diet, but the communities were consid- erably destabilized in the animals being fed the high-concentration diet.
About twelve bands generated from rumen bacterial communities of roughage or corn diets by DGGE analysis (Kocherginskaya et al., 2001).
Since a total of 69 T-RFs (roughage diet) or 64 (concentrate diet) were detected in our study, T-RFLP analysis seemed to be more useful than
Fig.3
Comparison of T-RFLP patterns of 16S rDNA from rumen bacterial fraction fed the roughage diet (upper) and the concentrate diets (below)in sheep B.
179
T-RFLP Analysis of Rumen Bacterial Community
Table3Terminal restriction fragments included in the analyses of rumen bacterial fraction from animals fed on the roughage diet. Sheep A Sheep B Sheep C RFs(bp)RA‑0RA‑4 RA‑8 RA‑12 RA‑18 RA‑24 RB‑0 RB‑4 RB‑8 RB‑12 RB‑18 RB‑24 RC‑0 RC‑4 RC‑8 RC‑12 RC‑18 RC‑24 82 0.6 0.7 0.7 0.6 0.9 0.7‑‑‑0.7‑‑‑‑‑‑‑‑ 86 0.6‑‑‑0.5 1.6‑0.7‑‑‑‑‑‑‑‑‑‑ 87 1.1 1.4 0.8 1.9 2.4‑1.4 1.1 1.7 2.6 1.5 1.6 2.5 2.2 2.2 2.5 2.0 2.0 89 11.4 11.9 11.3 17.4 14.9 12.0 13.5 14.6 9.8 14.0 13.9 12.4 9.4 13.0 13.6 17.2 15.9 14.3 91 1.7 1.5 1.0 1.2 1.3 1.4 1.2 1.7 1.8 1.6 1.9 1.9 1.5 1.2 1.2 1.5 2.1 1.7 93 14.4 20.6 7.9 26.2 24.8 24.3 20.8 20.5 23.3 16.6 27.0 23.8 18.6 30.7 27.0 28.8 16.6 28.0 95 1.2 0.6‑1.9 2.6 2.9 1.4 1.7 3.1 1.3‑3.5 2.6 2.6 2.8 2.8‑2.9 96 0.6‑‑‑‑‑‑‑‑‑‑‑‑‑‑‑‑‑ 121 2.0 1.7 0.7 0.9 0.6 1.2 0.7 1.1 1.4 0.6‑‑0.8‑1.4‑‑1.5 123‑‑‑‑‑‑0.8 0.9‑‑1.3 2.2 1.0‑‑‑‑‑ 124 2.4 1.2 2.2 3.6 3.7 2.0 3.5 3.7 1.7 3.8 3.4 2.6 2.2 2.2 2.5 2.7‑1.9 125 5.4 3.1 1.8 1.0‑1.1 1 2.2 2.1 0.9‑‑1.0‑1.1‑2.4 2.3 131‑‑‑0.7 0.6‑‑‑‑‑‑‑‑‑‑‑‑‑ 134‑‑‑0.7 0.8 0.7 1.2‑‑‑‑‑1.0 1.0 0.8‑‑‑ 135‑‑‑‑‑‑‑1.0‑‑1.2 1.6‑‑‑‑‑‑ 136‑‑‑0.7 1.1 0.9‑‑1.0 0.7‑‑‑0.9 0.8‑‑1.5 143 1.2 0.6 0.6‑‑‑0.5 0.7‑1.0‑‑‑‑‑‑‑‑ 145‑‑0.6 0.9‑‑‑0.6‑0.8‑‑‑‑‑‑‑‑ 146 1.5 1.8 1.1 1.1 2.1 2.0 2.8 2.3 2.8 2.0 2.8 3.2 3.0 1.4 1.0 0.9‑1.5 147‑‑‑1.3 2.5 2.4‑‑‑‑‑‑‑3.6 4.3 2.9‑1.2 156 0.7 0.8‑‑‑‑‑‑‑‑‑‑‑‑‑‑‑‑ 158 1.2 0.9 0.6‑‑0.6 0.5 0.7‑‑‑‑‑‑‑‑‑‑ 164 0.5 0.6‑‑‑‑0.7 0.7‑‑‑‑‑‑‑‑‑‑ 166 0.8‑‑‑‑‑0.6‑‑0.6‑‑‑‑‑‑‑‑ 186‑‑‑‑‑‑0.9 0.8‑‑‑‑‑‑0.7‑‑‑ 189 0.9‑‑1.2 0.8 1.1 0.8 0.9 0.8 1.3 1.4 1.4 0.9‑1.1 0.8‑‑ 209‑‑‑‑‑1.7‑‑‑‑‑‑‑‑‑‑‑‑ 210‑‑‑‑‑0.9‑‑‑‑‑‑‑‑‑‑‑‑ 211‑‑‑‑0.5‑‑‑‑‑‑‑‑‑‑‑‑‑ 212‑‑‑‑‑0.9‑‑‑‑‑‑‑‑‑‑‑‑ 213 0.7‑‑1.8 2.4 0.7 0.9‑0.8‑‑0.9 1.5 1.3 1.0 1.1‑‑ 214 0.9 1.6 1.5 1.2‑‑1.2 1.8 0.9 1.7 1.9 1.3‑1.3 1.5 1.7‑1.3 218‑‑0.8‑‑0.7 1.8 2.5‑2.3‑1.0‑‑‑‑‑‑ 219 1.5 1.5 0.9 0.8 0.6 1.5‑‑1.4‑1.3‑1.1 1.0 1.5 1.1‑‑ 221 3.9 3.1 4.4 2.0 2.3 3.1 4.1 2.8 5.0 3.2 4.9 4.1 4.3 1.8 2.0 2.1 4.7 3.8 224‑‑‑‑‑0.6‑‑‑1.4‑‑‑‑‑‑‑‑ 225 1.5 1.5 1.7‑‑‑0.8 1.2 1.6‑‑‑0.8‑‑‑2.2 1.6 233 8.0 4.9 18.5 3.6 12.3‑12.0 11.2 12.1 5.6‑5.7 6.8‑4.2 3.6 11.3 7.0 234‑5.6‑6.4‑11.1‑‑‑6.4 13.1 7.8 7.7 13.2 7.6 6.3 11.4 6.7 238‑‑0.8 0.6‑‑‑‑‑‑‑1.1 0.6‑‑‑‑‑ 266‑‑‑0.8 1.1 0.9‑‑‑‑‑‑‑2.4 2.6 2.0‑‑ 272‑‑‑‑‑‑‑‑‑‑1.2‑‑‑‑‑‑‑ 273‑‑‑‑‑‑‑‑‑‑0.8‑‑‑‑‑‑‑ 276‑‑‑‑0.6‑‑‑0.8‑‑‑‑‑‑‑‑‑ 277‑‑‑‑‑‑‑‑‑‑1.1‑0.8‑‑‑‑‑ 279‑‑‑‑2.1‑‑‑‑‑‑‑‑‑‑‑‑‑ 280‑‑‑‑4.2 1.2 3.7 1.1‑2.2 1.5 5.0 6.8‑‑‑2.2 2.7 281 0.6 0.9 1.7 2.8‑‑‑‑1.8 1.5‑‑‑2.2 1.3 2.2 2.0‑ 282‑0.5‑‑‑1.2‑0.8 1.3‑‑1.1‑‑‑‑‑‑ 283‑‑0.7 1.5‑2.9 1.8 1.1‑1.4 0.9 1.5 1.7 1.4 1.2 1.1 1.9‑ 284‑‑‑‑‑‑1.1 0.6‑‑‑1.0 1.9 1.0‑‑‑‑ 285‑1.2‑‑‑‑‑‑‑2.8‑‑‑‑‑1.5 4.4‑ 286 2.3 1.3 4.4 1.1‑‑0.6‑2.7‑‑‑‑‑‑‑‑1.7 287‑‑‑‑‑1.3‑‑‑‑‑‑‑‑‑‑‑‑ 288 1.2 1.6 1.3‑‑‑0.8 0.7 1.1 1.3‑‑0.9‑‑‑1.8‑ 291 0.7 0.9‑‑‑‑‑‑‑‑‑‑‑‑‑‑‑‑ 292 1.9 2.1‑‑‑‑‑‑‑‑‑‑‑‑‑‑‑‑ 294‑‑‑‑‑‑3.5‑4.1 4.7‑2.2 3.6‑2.0 1.9 3.2‑ 295‑‑‑2.5‑‑‑‑‑‑6.0‑‑‑‑‑‑‑ 296 6.4 7.4 7.0 3.4 4.6‑2.7 9.3 3.9 5.1‑2.5 3.0‑2.8 5.9 4.9 5.9 297 6.6 4.6 6.0‑‑7.9 3.6 3.3 5.9 3.1 3.7 2.6 3.4 5.6 3.1‑5.7 4.1 301‑‑‑‑‑1.0‑‑‑‑‑‑‑‑‑‑‑‑ 305 12.1 8.0 15.6 6.3 3.5 1.1‑‑2.3‑‑‑‑5.5 5.7 6.1‑‑ 306‑‑‑‑‑‑2.8 3.4‑4.6 4.5 3.5 3.5‑‑‑3.5 2.4 310 2.4 2.2 3.5 1.7 2.1‑3.0 2.0 2.7 1.9 1.9 1.9 3.1 2.1 1.7 1.7 2.0 2.0 311‑‑‑‑‑2.1‑‑‑‑‑‑‑‑‑‑‑‑ 313 1.0 0.8 1.7 1.8 3.4 3.8 3.4 1.7 2.1 1.0 2.1 1.5 3.0 2.2 1.4 1.2‑1.8 332‑‑‑0.7 0.8‑‑0.6‑1.0 0.9 0.9 0.9‑‑‑‑‑ 333‑‑‑‑‑0.7‑‑‑‑‑‑‑‑‑‑‑‑ Values are presented as percentage of total areas. A,B,and C,sheep No.;The final number,hours after feeding.