Ph. D. Thesis
Studies on biofuel production from agricultural wastes by using Clostridium cellulovorans
Graduate School of Bioresources Mie University
Hisao Tomita
July 2019
Contents Page
Abstract 1
1. Introduction
1.1 Background 3
1.2 Cellulosic biomass 4
1.3 Cellulosome 6
1.4 Clostridium cellulovorans 8
1.5 Agricultural wastes 10
1.5.1 Orange wastes 10
1.5.2 Sugar beet pulp 13
1.5.3 Sorghum 15
1.6 Methanogenesis 16
1.7 The purpose of the present studies 18
2. Material & Method
2.1 Culture condition of cultivation 19
2.2 Preparation of substrates 20
2.3 Measurement of total sugar and reducing sugar concentrations 22
2.4 Alcohol concentration 22
2.5 Organic acid concentration 22
2.6 Gas concentration 23
2.7 16S rRNA Sequencing 23
2.8 Data deposition 23
2.9 Cell growth 23
2.10 Statistics 24
3. Results
3.1.1 Ethanol fermentation and glucose concentrations with Saccharomyces cerevisiae under different concentrations of limonene
25
3.1.2. IBE fermentation and glucose concentrations with
C. beijerinckii under different concentrations of limonene
27
3.1.3. Cellulose degradation with C. cellulovorans under different concentrations of limonene
29
3.1.4. Degradation of mandarin orange peel and strained lees with C. cellulovorans
31
3.1.5. IBE fermentation by C. beijerinckii from the culture supernatant with C. cellulovorans
34
3.1.6. Consolidated bioprocessing of C. cellulovorans and C. beijerinckii
39
3.2.1. Degradation of SBP and Avicel with C. cellulovorans 44 3.2.2. All- inclusive analysis of microbial flora
included Methanogen
50
3.2.3. Precultivation of C. cellulovorans and MFMP 54
3.2.4. Methanogenesis and SBP utilization 55
3.2.5. Degradation and fermentation with orange wastes and sorghum by CCeM and MFMP
59
4. Discussion 62
5. Acknowledgements 69
6. References 70
1
Abstract
For a resolution of reducing carbon dioxide emission and increasing food production to respond to the growth of global population, the production of biofuels from non-edible biomass is urgently required. Abundant agricultural wastes, such as orange wastes in orange juice factories and sugar beet pulp (SBP) from sugar refining factories, occur, but they are largely disposed of. These agricultural wastes are non-edible biomass and are able to be utilized as a raw material of second-generation biofuels. This study evaluates the isopropanol-butanol-ethanol (IBE) fermentation ability of Clostridium beijerinckii and cellulosic biomass degrading ability of Clostridium cellulovorans under different concentrations of limonene, which has extremely toxic to fermenting microorganism. As a result, we found that C. cellulovorans was able to grow even in medium containing 0.05% limonene (v/v) and degraded 85% of total sugar from mandarin peel and strained lees without any pretreatments. More interestingly, C. beijerinckii produced 0.046 g butanol per 1 g of dried strained lees in the culture supernatant together with C.
cellulovorans. Furthermore, this study indicated that a co-culture fermentation system
combining C. cellulovorans with microbial flora of methane production (MFMP), using
sugar beet pulp (SBP) as a carbon source, is effective for the direct conversion of
cellulosic biomass to methane (CH
4). The MFMP was collected from a methane fermenter
in commercial operation and was analyzed by a next-generation sequencing system. The
microbiome was identified and classified based on several computer programs, revealing
that the MFMP included methanogenic organisms such as, Methanosarcina mazei,
Methanosaetaceae, Methanosaeta and Methanospirillaceae. Furthermore, Although the
MFMP did not degrade SBP, the consortium of C. cellulovorans with MFMP (CCeM)
2
degraded 87.3% of SBP without any pretreatment and produced 34.0 L of CH
4per 1 kg
of dry weight of SBP. These results indicated that agricultural wastes can be degraded and
converted to CH
4simultaneously by C. cellulovorans and the MFMP.
3 1. Introduction
1.1 Background
Global warming, the rise in the average temperature of the Earth's climate system, is observed and its related impacts are concerned [1-3]. On the other hand, an atmospheric carbon dioxide concentration has increased remarkably in recent years, and the greenhouse effect of carbon dioxide is noted as a factor of global warming [4,5].
Therefore, the reduction of carbon dioxide emissions is an important topic. Although the use of fossil fuels emits much carbon dioxide, carbon dioxide discharged from biofuels is offset with carbon dioxide taken during plant growth. This results in the reduction of carbon dioxide emissions, and therefore many researches on biofuels, such as bioethanol [6,7], biodiesel [8], biochemicals [9] and economics of those [10], are ongoing [11,12].
Biofuels are shifting from first-generation biofuels made from corns and sugar canes,
which compete with foods, to second-generation biofuels made from non-edible biomass
[13-15]. Furthermore, development of third-generation biofuels made from algae has
begun to be explored [16,17]. First- generation biofuels use starch from corn or sugar
from sugar cane as a raw material, and the method of producing bioethanol is the same as
liquor production, which has a long history. Therefore, first-generation biofuels,
especially bioethanol, has been put to practical use and it has started to realize a low
carbon society using carbon neutral materials. On the other hand, the global population is
estimated to reach 9 billion in 2045 from 7 billion [18], and this population growth
requires the increase of food production. Therefore, it is necessary to move on urgently
from using food such as corn to non-edible biomass as a raw material, namely second-
generation biofuels.
4 1.2 Cellulosic biomass
Cellulosic biomass, such as straw, corn stover and agricultural wastes, is non- edible biomass and is renewable. However, cellulosic biomass cannot be easily glycated like starch, and is largely disposed of. This is because cellulosic biomass is composed of cellulose, hemicellulose, pectin and lignin, which has rigid and complex structures [19].
Cellulose is comprised of a linear chain of
D-glucose monomers bound together by β-1,4- glycosidic bonds and has a strong crystalline fiber structure [20], while hemicellulose consists of not only a monopolymer such as mannan and xylan, but also a heteropolymer such as arabinoxylan, glucuronoxylan, glucomannan, and xyloglucan. In addition, in cellulosic biomass lignin and phenol compounds are assembled with cellulose and hemicellulose [21]. Cellulose is a biopolymer consisting of many glucose units connected through β-1,4-glycosidic bonds, therefore the breakage of the β-1,4-glycosidic bonds by acids leads to the hydrolysis of cellulose polymers, resulting in the saccharides.
Hydrochloric acid or sulfuric acid have been used in the hydrolysis of cellulose. However, they suffer from problems of product separation, reactor corrosion and the need for treatment of waste effluent. Therefore, environmental load becomes high [22,23]. These cellulose and hemicellulose are known to be degraded by enzymes such as cellulase, and t he saccharification by enzymes occurs under low temperature and pressure conditions
without hydrochloric acid or sulfuric acid. Therefore, the environmental load is much lower when using such enzymes compared with the hydrolysis by acid. Many microorganisms and fungi that secrete extracellular enzymes have been explored [24].
However, since the rigid and complex structures are constructed by cellulose,
hemicellulose and lignin, it is not easy to degrade them enzymatically, especially with
one enzyme alone. Researches on pretreatments, such as mechanical grinding, steam
explosion and acid treatment, are being pursued for efficient degradation [25].
5
Furthermore, many enzymes, such as cellulases and hemicellulases, must cooperate
together. [26].
6 1.3 Cellulosome
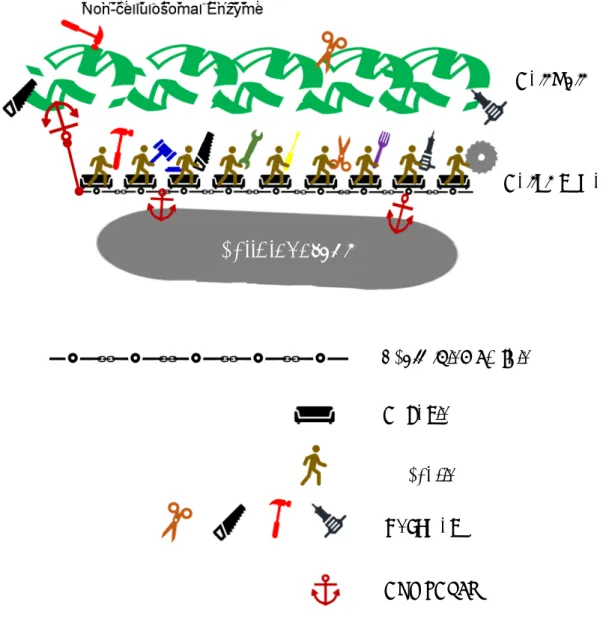
Some species of Clostridia are known to have the ability to degrade cellulosic biomass efficiently using a multiple-enzyme complex called the cellulosome together with non-cellulosomal enzymes [27-29]. The cellulosome is characterized by two major components, one is a scaffolding protein with multiple cohesin, which possesses dockerin-binding site, and the other consist of a variety of cellulosomal enzymes bound to dockerin. These components assemble into the cellulosome through the binding of cohesin and dockerin [30]. The cellulosome has cellulose-binding modules (CBMs), which combines with cellulose, so that the cellulosome can locate several enzymes close to cellulose (Figure 1). Furthermore, CbpA in the cellulosome is able to bind on a surface of the bacterium, facilitating the uptake of nearby degrading saccharides. There is not one combination of the enzymes on the cellulosome, but various combinations are possible.
It is also known that various enzymes are closely located to each other and work
synergistically. Additionally, Clostridia can produce non-cellulosomal enzymes, which
are not connected with the cellulosome but often possess their CBMs. Clostridia are
known to possess high cellulose degradation ability due to the cooperation of the
cellulosome and such non-cellulosomal enzyme [31-37]. Research is also being
conducted to construct artificial cellulosomes to promote the efficiency of biomass
decomposition [38-40].
7
Figure 1. Schematic model of C. cellulovorans cellulosome.
Dockerin
Scaffolding protein Cohesin
Enzymes
Non-cellulosomal Enzyme
Cell wall
Cellulosome
C. cellulovorans
CBM, CbpA
on‑ce11u10s0,, ,c
E
_ 。 一
0一
0一
0一
0 ‑直
介
炉
ヽ 。 T
ヽダも
8 1.4 Clostridium cellulovorans
Among those species, we have been studying Clostridium cellulovorans, which is an anaerobic, mesophilic, Gram-positive and spore-forming cellulolytic bacterium [41].
C. cellulovorans utilizes not only cellulose but also hemicellulose, such as xylan, fructan,
galactan, and mannan, and pectin [42-45]. C. cellulovorans metabolizes formic acid,
lactic acid, acetic acid, butyric acid, ethanol, CO
2and H
2. The metabolized organic acid
change by the culture condition [46] (Figure 2). As revealed by whole-genome
sequencing of C. cellulovorans, 57 cellulosomal protein-encoding genes and 168
secreted-carbohydrase-encoding genes have been annotated [29,47]. A detailed
characterization of C. cellulovorans was performed by Clostridia genome comparison
[48]. Various cellulosomal enzymes from C. cellulovorans have been identified to date,
which are a large gene cluster for CbpA-ExgS-EngH-EngK-HbpA-EngL-ManA-EngM-
EngN [49,50], the endoglucanases EngB [51,52] and EngE [53], mannanase ManA [54],
pectate lyase A [55], and the xylanases XynA [56] and XynB [57]. Thus, the cellulosomal
enzymes from C. cellulovorans have high performance to degrade plant cell wall
polysaccharides. This high degradation performance of C. cellulovorans has been
reported previously, and several researches on the degradation mechanism for cellulosic
biomass have been continued [58,59]. Furthermore, C. cellulovorans which was
engineered metabolically by a transformation method produced biofuel directly from
cellulose [60,61].
9
Figure 2. Central metabolic pathway in Clostridium cellulovorans, based on the data presented in references [40,60,61,62,123].
Glycolysis
Cellulose Xylan Arabinose Pectin Cellobiose
Glucose
2 Pyruvate Lactose
Fructose-6P 2NAD+ 2NADH 2 ADP
2 ATP
2NAD+ 2NADH + 2H+
2 Acetoacetyl-CoA 2 Acetyl-CoA
2NAD+ 2NADH 2 CoA
2 CO2
2 Lactate 2 Formate
2NAD+ 2NADH + 2H+
2 Acetate 2 Acetaldehyde
2NADH + 2H+
2NAD+ 2ATP 2ADP
2 Ethanol 2NADH
+2H+ 2NAD+
2 Butyryl-CoA 2 Butylate
2 Acetyl-P
2NADH + 2H+ 2NAD+
2ATP 2ADP
I I
ョ
l
︳
︳ ︱
l
︳
︳ ︱
l
︳
︳
︱
‑
︳
︱ ︱
0 ‑ ︱ 0
←▼
︳ ︳
▼
←
▼
▼
▼
︱ ︱
:
‑ ︱ :
=-1111
> [
111~\ ~
>
/
/ f
▼
▼
~~ ~
10 1.5 Agricultural wastes
Wheat, rice and corn are major crops and are cultivated all over the world. Their stovers are non-edible biomass and attractive candidates as a raw material of second- generation biofuels [63]. However, most of them are left uncollected in the field, and in order to use them as the raw material of biofuels, it is necessary to construct the collecting process. On the other hand, a lot of agricultural wastes are generated collectively at agricultural processing factories, such as orange wastes in an orange juice factory and sugar beet pulp in a sugar refining factory. These agricultural wastes are available without the new collection process from fields, and it has the potential to be an initiator to disseminate second-generation biofuels.
1.5.1 Orange wastes
Orange juice is one of the major fruit juices and and 1.6 million metric tons are
produced per year around the world [64]. Almost the same amount of orange wastes come
out as by-product from the orange juice factories. These orange wastes are available non-
edible biomass. Part of these are used as animal feed, but a large proportion of these have
to be disposed of due to high drying and transportation costs [65]. The orange wastes,
such as peel and strained lees, still contain much sugar, which conventional yeast, such
as Saccharomyces cerevisiae, can utilize to ethanol fermentation [66]. Also, useful
chemical components can be extracted from citrus wastes [67]. S. cerevisiae can be
engineered for simultaneous maltose utilization and in-situ carbon dioxide (CO
2) fixation
to achieve efficient xylose fermentation [68]. However,
D-limonene, hereafter called
limonene, which is included in citrus fruits, is reported to have extreme toxicity to
fermenting microorganism [69,70,71]. Therefore, the fermentation with S. cerevisiae
requires prior separation of limonene from the medium, or to protect from it by an
11
encapsulation or an immobilization [72,73]. On the other hand, few studies have been reported on the fermentation from citrus fruits by Clostridium beijerinckii. C. beijerinckii are well-known for isopropanol-butanol-ethanol (IBE) fermentation ability and are employed repeatedly for research from the early 20th century [74] (Figure 3a, b). C.
beijerinckii, which is also a mesophilic and anaerobic bacterium, is known to assimilate
monosaccharides such as glucose, xylose, mannose and arabinose, and to convert them
into organic acid such as acetic acid, lactic acid and butyric acid, and alcohols such as,
butanol, isopropanol and ethanol [75,76]. Furthermore, C. beijerinckii achieved the
solvent productivity of 5.52 g/L/h, with the yield of 54% from glucose with wood pulp as
a cell holding material [77].
12
Figure 3. (a) Metabolic pathway for acetone – isopropanol – butanol – ethanol (IBE) production within Clostridium spp. [78]. (b) Phylogenetic tree of Clostridium spp. [79].
CoA
a
b
Clostridium beijerinckii NCIMB 8052 (CP000721) Clostridium sp. strain NJP7Clostridium diolis SH1 (NR025542)
Clostridium acetobutylicum DSM 1731 (CP002660) Clostridium saccharoperbutylacetonicum N1-4 (NR036950)
Clostridium saccharobutylicum (AM998793) Clostridium butylicum ATCC 43755 (X68176) Clostridium butyricum IDCC 5101 (EF533982) Clostridium paraputrificum ATCC 25780 (NR026135) Clostridium sartagoforme DSM 1292 (NR027589)
Clostridium cellulovorans 743B (NR 027589)
Clostridium acetobutylicum ATCC 824 (U16166) Clostridium acetobutylicum DSM 1731 (CP002660) Clostridium thermocellum ATCC 27405 (CP000568)
Clostridium clariflavum DSM 19732 (NR041235) Clostridium alkalicellum (AY959944)
Ruminococcus flavefaciens (AM915270) Clostridium cellulosi (NR044624)
100
Ethanoligenes harbinense B2(EU639425)
58 72
98
74
77 100
81 10 63 95 100
100
92
100 100
Acid - Producing Solvent - Producing
Glucose e-
NAD
Pyruvate e-
Ferredoxi n
ADP H2
CoA Acetyl
CoA
Acetaldehyde Acetyl -P
Acetate
ATP CoA
Pi
Ethanol Acetoacetyl
CoA NADH NADP
β-Hydroxybutyryl CoA
Crotonyl CoA
Butyryl CoA Pi
ADP Butyryl -P Butyrat
e ATP
Butyroldehyd NADH e
Butano NAD(P)H l
(CoA)
Acetoacetate Isopropan
NADPH Aceto
ne
NADH
: ←
~ ~
□ V t 口 :
↓
二 て 一 →
↓ ー一
仁二]13 1.5.2 Sugar beet pulp
Sugar is essential for human beings and about 20% of the world's sugars is
supplied by the root of a sugar beet (Beta vulgaris L.), which are cultivated all over the
world, but mostly in Europe, North America and Russia [80]. Sugar beet pulp (SBP) is a
by-product of the sugar production from sugar beet. The extraction of sugar starts with
the cleaning of the sugar beet delivered to the factory, after which the sugar beet is sliced
up into small strips (pulp). The pulp is then mashed by heating with water of
approximately 70 °C, to dissolve sugars from the pulp. Furthermore, the sugar water and
the pulp are separated in an extraction tower. Thus, since SBP is the residue and non-
edible biomass, it is the subject of research as a raw material of second-generation
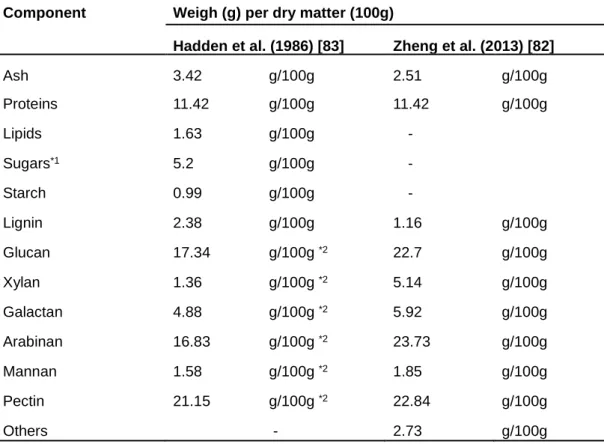
biofuels [81,82]. Furthermore, SBP is mainly composed of cellulose, arabinan and pectin,
has less lignin. Therefore, SBP is a suitable raw material for second-generation biofuels,
because pretreatment processes are not necessary to remove lignin (Table 1).
14
Table 1. Chemical components of SBP
Component Weigh (g) per dry matter (100g)
Hadden et al. (1986) [83] Zheng et al. (2013) [82]
Ash 3.42 g/100g 2.51 g/100g
Proteins 11.42 g/100g 11.42 g/100g
Lipids 1.63 g/100g -
Sugars*1 5.2 g/100g -
Starch 0.99 g/100g -
Lignin 2.38 g/100g 1.16 g/100g
Glucan 17.34 g/100g *2 22.7 g/100g
Xylan 1.36 g/100g *2 5.14 g/100g
Galactan 4.88 g/100g *2 5.92 g/100g
Arabinan 16.83 g/100g *2 23.73 g/100g
Mannan 1.58 g/100g *2 1.85 g/100g
Pectin 21.15 g/100g *2 22.84 g/100g
Others - 2.73 g/100g
*1Total value of rest of fructose, glucose, sucrose and fructan.
*2Conversion of values to polysaccharides in the paper.
15 1.5.3 Sorghum
The search for biomass suitable for biofuels besides agricultural wastes is in progress, with Sorghum bicolor, hereafter sorghum, being one of candidates [84-88].
Sorghum belongs to Poaceae and grows fast, reaching four meters tall, utilizing C
4carbon
fixation (NADP-ME type). Therefore, large amounts of biomass can be expected from
this plant [89]. It has relatively low input requirements with the ability to grow on
marginal lands. The seed of sorghum is gluten free and can be used instead of flour, and
the squeezed juice from the stalk is rich in sugar. The remaining stalks and leaves can be
utilized as a raw material for biofuels.
16 1.6 Methanogenesis
First-generation biofuels are mainly bioethanol production [13]. If intended to replace gasoline, liquid biofuel production, such as bioethanol, is be required. However, methane is an option, if gaseous replacement biofuels are required in agricultural processing factories, such as sugar refining factories. Methane fermentation is a conventional way to generate biofuels, and has been studied for a long time [90-92]. Many reports have been made across a wide range of academic fields [93-95]. The activity of decomposing biomass and producing methane as a final product is widely practiced in the natural world, and has been reported even from the permafrost. This suggests methane production to be one of the most robust and sustainable processes on Earth [96]. Methane fermentation proceeds with three metabolic groups of bacteria. Fermentative bacteria hydrolyze materials such as polysaccharides, lipids and protein, and excreted acetate and other saturated fatty acids, CO
2and H
2as major end products. A second group produces acetate and H
2from end-products of the first group. The last group, which are methanogenic bacteria, catabolize mainly acetate, CO
2and H
2produced jointly by the other two groups, to the terminal products, such as CH
4, CO
2and H
2O [97]. There are two major methane producing pathways, one being the CO
2reduction pathway, in which CH
4is produced from H
2and CO
2, and another where CH
4is produced from CH
3COOH.
Apart from that, CH
4is produced by syntrophic formate oxidation coupled with CO
2reduction and formate methanogenesis under anaerobic conditions. [98].
4H
2+ CO
2→ CH
4+ 2H
2O CH
3COOH → CH
4+ CO
24HCOOH → CH
4+ 2H
2O + 3CO
217
Which methane production pathway works is decided by the type of methanogenic bacteria, the interaction between metabolic groups and the culture condition. Methane production is carried out by the complex microbial flora including methanogens, and it has been formerly difficult to grasp the microbial flora comprehensively. However, it has now become possible to analyze the whole aspect of the microbiome characteristics using the next-generation sequencing system [99]. Clostridia accelerates methanogenesis [100].
This has been reported as a result of coculturing C. cellulovorans with one of the famous methanogens such Methanosarcina spp. [62]. Since C. cellulovorans and methanogens were both able to grow anaerobically under mesophilic conditions, it was possible to cultivate them in a single tank and therefore simultaneously degrade cellulosic biomass and produce methane (CH
4). However, there are few reports on a consortium of C.
cellulovorans and microbial flora of methane production (MFMP).
18 1.7 The purpose of the present studies
In order to effectively use orange wastes, this study demonstrates the tolerance of C. beijerinckii and C. cellulovorans against different concentrations of limonene. The IBE fermentation ability of C. beijerinckii and cellulose degradation ability of C.
cellulovorans was evaluated in the culture medium including mandarin peel and strained lees as sole carbon sources. This study used mandarin oranges because mandarin oranges are popular in Japan and have limonene as same as other citrus fruits. Furthermore, processes for producing CH
4and hydrogen (H
2) via the co-culture of C. cellulovorans with microbial flora of methane production (MFMP), (called the Consortium of C.
cellulovorans with the MFMP (CCeM)), with carbon sources such as SBP, mandarin
orange wastes, sorghum bicolor and Avicel, are being investigated. First, we analyzed 16s
rRNA sequences in the MFMP by using a next-generation sequencer. Based on the result
of identification of the MFMP microbiome, both C. cellulovorans and the MFMP
monocultures as well as the CCeM co-culture were carried out to evaluate concentrations
of sugars, organic acid, and biogas (H
2and CH
4) yield after cultivation.
19 2. Material & Method
2.1 Culture condition of cultivation
Saccharomyces cerevisiae BY4741 was used and precultured anaerobically in YPD media with 2.0 % (w/v) glucose (Wako, Osaka, Japan) at 30 °C for 72 h without shaking. YPD media was used for one liter of medium: 10 g of Yeast extract (Bacto, MD, USA), 20 g of Pepton (Bacto), 20 g of Glucose (Wako). pH was adjusted 6.
Clostridium cellulovorans 743B (ATCC 35296) was used and precultured anaerobically in the media with 0.5% (w/v) cellobiose (Sigma, MO, USA) at 37 °C without shaking. Clostridium beijerinckii NCIMB8052 (ATCC 51743) was used and precultured anaerobically in the media with 2.0% (w/v) glucose (Wako) at 37 °C without shaking. Clostridium cellulovorans medium was partially modified and used [41]. Per one liter of medium was prepared with 4 g of Yeast extract, 1 mg of Resazurin salt, 1 g of
L
-Cysteine HCl, 5 g of NaHCO
3, 0.45 g of K
2HPO
4, 0.45 g of KH
2PO
4, 0.3675 g of NH
4Cl, 0.9 g of NaCl, 0.1575 g of MgCl
2.6H
2O, 0.12 g of CaCl
2.2H
2O, 0.85 mg of MnCl
2.4H
2O, 0.942 mg of CoCl
2.6H
2O, 5.2 mg of Na
2EDTA, 1.5 mg of FeCl
2.4H
2O, 0.07 mg of ZnCl
2, 0.1 mg of H
3BO
3, 0.017 mg of CuCl
2.2H
2O, 0.024 mg of NiCl
2.6H
2O, 0.036 mg of Na
2MoO
4.2H
2O, 6.6 mg of FeSO
4.7H
2O, 0.1 g of p-aminobenzoic acid, and was adjusted to pH 7 for C. cellulovorans and pH 5 for C. beijerinckii, respectively.
The MFMP was obtained from methane fermentation digested liquid collected
on January, 2017 at Gifu in Japan. The MFMP was anaerobically cultivated in Clostridium
cellulovorans medium with 0.5% (w/v) glucose (Wako) and 0.25% (w/v) cellobiose at
37 °C for 19 h without shaking.
20 2.2 Preparation of substrates
Mandarin oranges purchased at a grocery store were used. Flavedo and albedo,
hereafter called removed peel, were removed before squeezing (Figure 4a). Whole
mandarin oranges except removed peel were squeezed by a squeezing device, hereafter
called strained lees (Figure 4b). Mandarin oranges were squeezed by SJC-75-W
(Irisohyama, Miyagi, Japan). The substrate concentrations of removed peel and strained
lees were 1.0% (w/v) of dry weight. 10 vials of a medium containing removed peel and
10 vials of a medium containing strained lees were prepared. SBP was obtained from a
sugar factory in Hokkaido, Japan. Sorghum cultivated in Aichi, Japan was used (Figure
4c). SBP and sorghum were dried up, milled and sieved through 80 meshes. The substrate
concentrations of SBP, sorghum and Avicel (Sigma, MO, USA) were 0.5% (w/v) of dry
weight. Limonene (Wako) was used for different concentrations media.
21
Figure 4. (a) Flavedo and albedo are removed before squeezing and (b) after squeezing (strained lees). Sugar Drip Sorghum (c).
a
Albedo Flavedo
b
c
22
2.3 Measurement of total sugar and reducing sugar concentrations
Total sugar concentration was measured by Phenol-sulfuric acid method.
Reducing sugar was measured by DNS method (Dinitrosalicylic Acid), as
D-glucose equivalents [101].
2.4 Alcohol concentration
Alcohol concentration was measured by a gas chromatograph GC-2010plus (Shimadzu, Kyoto, Japan) with FID detector and a capillary column Rt-Q-BOND (30 m, inner diameter. 0.32 mm; RESTEK, PA, USA). The oven temperature was 250°C and the column temperature was 150°C. Nitrogen was the carrier gas and set at a flow rate of 1.21 mL/min.
2.5 Organic acid concentration
The concentration of organic acid was measured by high-performance liquid chromatography (HPLC) CBM-20A, LC-20AD, CTO-20AC, SPD-20A and DGU-20A
3(Shimadzu, Kyoto, Japan) with UV detector and a column KC-811 (300 mm x 2, inner
diameter. 8 mm; Showa Denko, Tokyo, Japan). The column temperature was at 60°C. The
method of BTB Post-column was used. Eluent was 2 mM perchloric acid, and the flow
rate was 1.0 mL/min. Reagent was 0.2 mM BTB and 15 mM disodiumhydrogenphosphate,
and the flow rate was 1.2 mL/min at the wavelength of 445 nm. The injection volume of
each sample was 20 µL.
23 2.6 Gas concentration
Produced gas after the cultivation was recovered by downward displacement of water, the total gas amount was measured by a syringe (Terumo, Tokyo, Japan). The concentrations of methane, hydrogen, and carbon dioxide were measured by a gas chromatograph GC-8A (Shimadzu, Kyoto, Japan) with TCD detector and a column SINCARBON ST (6 m, inner diameter. 3 mm; Shinwa, Kyoto, Japan). The column temperature was at 200°C. Argon was a carrier gas and set at a flow rate of 50 mL/min.
The injection volume of each sample was 5 ml.
2.7 16S rRNA Sequencing
Samples were crashed by Shake Master Neo (bms, Tokyo, Japan) and DNA was extracted by Fast DNA spin kit (MP Bio, CA, USA). MiSeq (Illumina, CA, USA) was used for sequencing under the condition of 2 x 300bp. Qiime as an analyzing software and Greengene as a database were used, and OTU was decided except chimeric genes.
2.8 Data deposition
The sequences reported in this paper have been deposited in the DDBJ database (accession104 no. DRR160954).
2.9 Cell growth
Cell growth was measured by Lumitester PD-20, LuciPac Pen and ATP
eliminating enzyme (Kikkoman biochemifa, Tokyo, Japan). It is known that integrated
intracellular ATP concentration correlates with cell growth [102]. Cell growth was
estimated by measuring ATP concentration of 0.1 ml of cell culture according to the
manufacturer’s instruction and was expressed by Relative Light Unit (RLU) value.
24 2.10 Statistics
The data were analyzed for statistical significances using Welch's t test.
Difference was assessed with two-side test with an α level of 0.05.
25 3. Results
3.1.1 Ethanol fermentation and glucose concentration with Saccharomyces cerevisiae under different concentrations of limonene
Anaerobic batch cultivations of S. cerevisiae were carried out in a 30-ml YPD medium containing 2% glucose with 0, 0.01, 0.02, 0.05 and 0.1% (v/v) limonene at 30 °C without shaking. Concentrations of ethanol and glucose were measured at 24- and 48-h cultivation, respectively. Whereas ethanol fermentation was inhibited under more than 0.02% of limonene (Figure 5a), glucose consumption was increased under up to 0.02%
of limonene (Figure 5b). Furthermore, ethanol concentration at 48-h cultivation was significantly lower when cultured with more than 0.02% of limonene (Figure 5d).
Although cell growth at 0-h, or just after inoculation, did not show significant differences,
it was inhibited significantly with more than 0.01% limonene after 48-h cultivation
(Figure 5c).
26
Figure 5. Concentration of ethanol (a), residual glucose ratio (b) and cell growth (c) in
the culture medium with S. cerevisiae, where different concentrations of limonene (v/v), 0% (●_black filled circle), 0.01% (×), 0.02% ( ), 0.05% (□), 0.1% (○_open circle), were present in the culture medium. d Ethanol production at 48- h cultivation. Values are means
± SE of three independent samples. An asterisk indicates a significant difference (p<0.05).
0 20 40 60 80 100
0 10 20 30 40 50
Residual glucose(%)
Time (h) 0.0
0.5 1.0 1.5 2.0 2.5 3.0
0 10 20 30 40 50
Ethanol (g/L)
Time (h)
0.0 0.5 1.0 1.5 2.0 2.5 3.0 3.5
0% 0.01% 0.02% 0.05% 0.10%
Ethanol (g/L)
Limonene concentration (v/v)
* * *
a d
b
0 1000 2000 3000 4000 5000
0 10 20 30 40 50
Cell growth (RLU)
Time (h)
c
ぷ‑↓
一
. .
••
‑
.—
. -l
一
•• ••
-—_ •••
︱ ︱
. .
••
.
一
'
.合
. .
.
••
x
t . . ..
••
ど一
ぃ
‑
□n ‑
ー ー 一 令 ー 一
̀ ― →
.ぷ ヽヽ`
""[}..‑ ‑ ‑
‑ ‑ ‑El27
3.1.2. IBE fermentation and glucose concentration with C. beijerinckii under different concentrations of limonene
Anaerobic batch cultivations of C. beijerinckii were carried out in a 30-ml medium containing 2% glucose with 0, 0.01, 0.02, 0.05 and 0.1% (v/v) limonene at 37 °C without shaking. Alcohol and glucose concentrations were measured at 48- and 72-h cultivations, respectively. Total values of ethanol, isopropanol and butanol concentration were taken as alcohol concentration. Alcohol production was decreased on 0.05%
limonene at 48-h cultivation, but was finally increased at 72-h cultivation (Figures 6a).
On the other hand, glucose consumption showed a similar pattern and reached to about
50% decrease of initial glucose concentration except in 0.1% limonene (Figure 6b). In
comparison under different concentrations of limonene at 72-h cultivation, alcohol
fermentation by C. beijerinckii was completely inhibited under 0.1% limonene (Figure
6d). These results indicated C. beijerinckii could ferment glucose to alcohol under less
than 0.05% limonene and limonene tolerance of C. beijerinckii was five times higher than
that of S. cerevisiae. Interestingly, cell growths in the culture media with limonene at 0-
and 20-h cultivation hardly increased, however cell growth with less than 0.2% limonene
turned to increase at 24-h cultivation (Figure 6c).
28
Figure 6. Concentration of alcohol (a), residual glucose ratio (b) and cell growth (c) in
the culture medium with C. beijerinckii, where different concentrations of limonene (v/v), 0% (●_closed circle), 0.01% (×), 0.02% ( ), 0.05% (□), and 0.1% (○_open circle), were present in the culture medium. d Alcohol production at 72-h cultivation. Values are means
± SE of three independent samples. An asterisk indicates a significant difference (p<0.05).
0 20 40 60 80 100
0 20 40 60 80
Residual glucose (%)
Time (h) 0
0.2 0.4 0.6 0.8 1 1.2 1.4 1.6 1.8
0 20 40 60 80
Alcohol (g/L)
Time (h)
0 0.5 1 1.5 2
0% 0.01% 0.02% 0.05% 0.1%
Alcohol (g/L)
Limonen Concentration (v/v)
a *
b
d
0 5000 10000 15000 20000 25000 30000
0 20 40 60 80
Cell growth (RLU)
Time (h)
c
0 100 200 300 400 500 600
0 20 40 60 80
Cell growth (RLU)
Time (h)
、 t !
~
/ d ‑ ・ ・ ・ ・ ・ ・ ・ ・
~ ,.,,,..
. . . " . . — ・ ‑ ‑ ‑ .
'
~ ~ · -—
- Q I・ 奪 A
. . ̀
\ ` ` ••
一5 ム.
x •
. .
︑
. .
︐
ヽ. . . ..
•••
J •
・ ・ ダ
:]- ~
マー邑—29
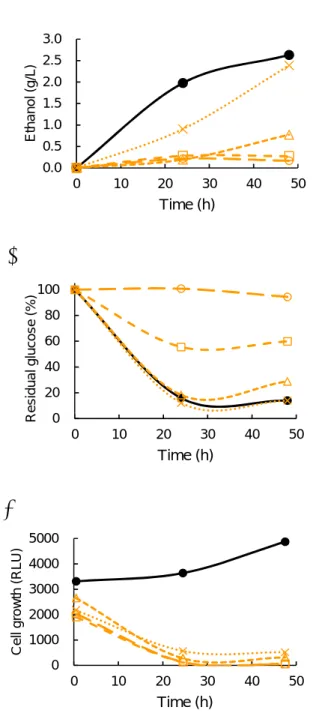
3.1.3. Cellulose degradation with C. cellulovorans under different concentrations of limonene
Anaerobic batch cultivations of C. cellulovorans were carried out in a 30-ml medium containing 0.5% Avicel with 0, 0.01, 0.02, 0.05 and 0.1% (v/v) of limonene at 37 °C without shaking. Total sugar concentration was measured at 8-, 26-, 39- and 61- days cultivation, respectively. Whereas Avicel was completely degraded by C.
cellulovorans without limonene (0%) at 39-days cultivation, approximately 60% was degraded with 0.01-0.05% limonene (Figures 7a). After 61 days cultivation, Avicel was almost completely degraded in the presence of 0.01-0.05% limonene. On the other hand, Avicel was degraded even in 0.1% limonene according to the measurement of total sugar concentration. As a result, there was not a significant difference in comparison with the control (without limonene) (Figure 7d). Interestingly, C. cellulovorans survived for 2 months, even though there was less carbon source for C. cellulovorans at earlier stages of cultivation. It was suggested that C. cellulovorans was able to survive by secreting cellulosome and non-cellulosomal enzymes, taking the saccharide from degrading Avicel.
Furthermore, surprisingly, cell growth in the culture with limonene at 0-h, or just after
inoculation, was extremely low compared to 0% limonene. The RLU levels were almost
comparable to negative controls (Figure 7b, c). From the fact that intracellular ATP
decreased drastically, it was indicated that C. cellulovorans sensed trace amount of
limonene (0.01%) and intracellular ATP was discharged rapidly. However, cell growth in
the culture with limonene turned to increase, and cell growth started to increase early in
the medium with low limonene concentration.
30
Figure 7. Residual total sugar ratio (a), cell growth (b, c) in the culture with C.
cellulovorans, where different concentrations of limonene (v/v), 0% (●_closed circle), 0.01% (×), 0.02% ( ), 0.05% (□), 0.1% (○_open circle), were present in the culture medium. d Total sugar concentration at 61-days cultivation. Values are means ± SE of three independent samples.
0 1 2 3 4 5 6
0.00% 0.01% 0.02% 0.05% 0.10%
Total sugar(g/L)
Limonene concentration (v/v)
0 1000 2000 3000 4000 5000 6000 7000 8000
0 10 20 30 40 50 60 70
Cell growth (RLU)
Time (days)
0 500 1000 1500 2000 2500 3000
0 10 20 30 40 50 60 70
Cell growth (RLU)
Time (days) 0
20 40 60 80 100
0 10 20 30 40 50 60 70
Residual total sugar (%)
Time (d)
a
b
d
c
0 50 100 150 200 250 300 350 400 450 500
0 1 2 3 4 5 6 7
Cell growth (RLU)
Time (days)
らぶ、た[s、. ..、.
\ 心.̲̲:
-~
ヽ .凜.一令—-~ふ
ISi‑¥:..
遵・~ ·•.:、ぶ
` . . .
̲ ‑‑I ·•.':-, ‑..: ● . 彎. o
ヽ
`
••••
f . . 9 ‑
•一9
令 ^
幻
.•. 9
︑
••
̀/
︑
t '
/
. .
ソ
ヽ
`
‑ . i /
パ
x
︑..︑ . .
. .
J r
ヽ
.
. ︑ . ︑ . . ︑
ヽ
x . ..︑
. . . .
. . . .
. . . .
. ..
1 ̀
.
\ れ
̲i
h
臥31
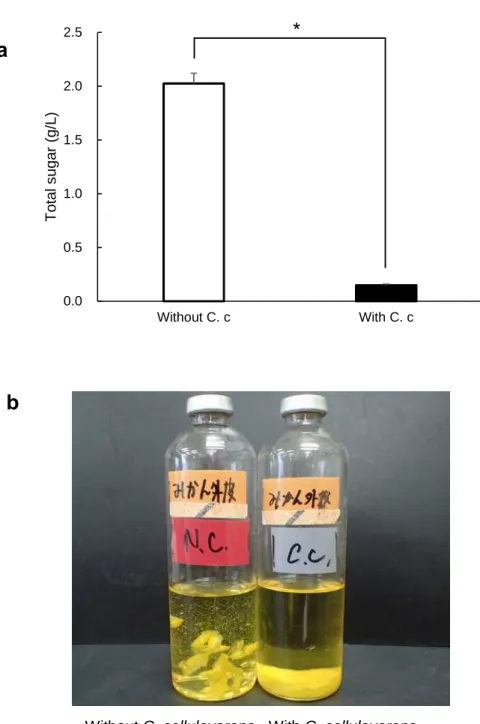
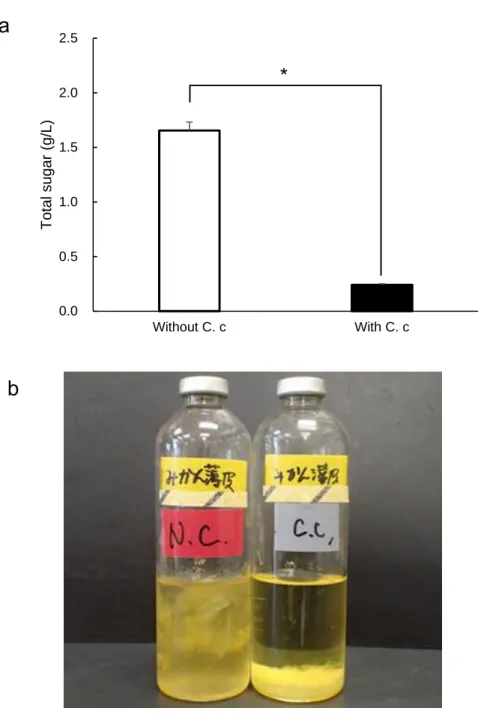
3.1.4. Degradation of mandarin orange peel and strained lees with C. cellulovorans The removed peel was put in a 15-ml vial placed on an electronic scale and the weight was measured except tare. Dry weight was calculated from the water content, which was 71.6%. The removed peel was added into C. cellulovorans medium as 1%
(w/v) of a dried substrate. The final volume of the medium as approximately 2 ml for each vial. 10 vials were made. The other 10 vials of the medium containing strained lees were made similarly, in accordance with 83.9% water content. Five vials each were inoculated with 0.2 ml of preculture medium containing 0.5% cellobiose with C.
cellulovorans for both removed peel and strained lees media. All vials were cultivated at
37 °C without shaking. The culture supernatant was removed after centrifugation and total
sugar of culture residues was measured after 16-days cultivation. Total sugar in the
removed peel media with or without C. cellulovorans were 0.148 g/L and 2.025 g/L,
respectively (Figure 8a, b), while total sugar in the strained lees media with or without
C. cellulovorans were 0.241 g/L and 1.654 g/L, respectively (Figure 9a, b). These results
indicated C. cellulovorans degraded 93% of removed peel and 85% of strained lees,
respectively, without any pretreatment of these substrates.
32
Figure 8. (a) Total sugar concentration in the culture medium containing removed peel.
Values are means ± SE of three independent samples. An asterisk indicates a significant difference (p<0.05). (b) The media were with and without inoculation of C. cellulovorans after cultivation.
a
0.0 0.5 1.0 1.5 2.0 2.5
Without C. c With C. c
Total sugar (g/L)
*
b
Without C. cellulovorans With C. cellulovorans
33
Figure 9. (a) Total sugar concentration in the culture medium containing strained lees.
Values are means ± SE of three independent samples. An asterisk indicates a significant difference (p<0.05). (b) The media were with and without inoculation of C. cellulovorans after cultivation.
0.0 0.5 1.0 1.5 2.0 2.5
Without C. c With C. c
Total sugar (g/L)
* a
b
Without C. cellulovorans With C. cellulovorans
34
3.1.5. IBE fermentation by C. beijerinckii from the culture supernatant with C.
cellulovorans
0.1 ml of preculture medium of C. beijerinckii was inoculated in 1 ml of supernatant taken from 16-days culture of C. cellulovorans, and they were then cultivated at 37 °C without shaking. Butanol concentration was measured at 18-days cultivation.
The measured values of butanol concentration were multiplied by the volume of each vial medium and the weight of butanol per vial was calculated. The calculated butanol weight was divided by the dry weight of each vial substrate as a final yield. Butanol yield from strained lees cultivated with C. cellulovorans was twice as higher than that without C.
cellulovorans (Figure 10). Namely, the maximum yield of butanol was 0.046 g per 1 g of the strained lees in the supernatant with C. cellulovorans. In contrast, butanol yield was 0.005 g per 1 g of removed peel in the supernatant without C. cellulovorans. Moreover, the cultivation conditions were compared with before or after addition of C. beijerinckii to the cultivated media with or without C. cellulovorans. As a result, reducing sugar in the culture supernatants after addition of C. beijerinckii were always lower than before addition (Figure 11). In particular, in the case of removed peel as a substrate without C.
cellulovorans and before addition of C. beijerinckii, the reducing sugar concentration was highest among all the conditions. These results suggested that sugar components for IBE fermentation of C. beijerinckii might be different between removed peel and strained lees.
All concentrations of organic acid in the culture supernatants after addition of C.
beijerinckii were higher than before addition of that except butyric acid concentration in
the strained lees culture (Figure 12). Butyric acid concentration in the strained lees
culture was not significantly different between with and without C. cellulovorans. It was
suggested that there was a lot of saccharides, which C. beijerinckii was able to consume,
in the strained lees culture. Clostridium species produce acetate and butyrate after the
35
metabolism shifts to the solvent production phase. Thus, it was also suggested that C.
beijerinckii in the strained lees culture produced higher concentration of butanol than the
removed peel culture by utilizing those rich saccharides and shifting the solvent
production phase (Figure 10, 11).
36
Figure 10. Butanol concentration in the culture supernatants with C. beijerinckii from removed peel and strained lees with or without C. cellulovorans. Values are means ± SE of four independent samples.
0.00 0.01 0.02 0.03 0.04
Without C. c With C. c Without C. c With C. c
Removed peel Strained lees
Butanol yield (g/g)
37
Figure 11. Reducing sugar concentration in the culture supernatant from removed peel and strained lees with or without C. cellulovorans. Closed bars and hatched bars indicate before addition of C. beijerinckii and after addition C. beijerinckii, respectively. Values are means ± SE of five independent samples.
0.0 0.5 1.0 1.5 2.0 2.5 3.0 3.5
Without C. c With C. c Without C. c With C. c
Removed peel Strained lees
Reducing usgar (g/L) Before
cultivation of C. beijerinckii
After cultivation of C. beijerinckii
ヽ●•
ヽ
. ,:
38
Figure 12. Organic acid concentration in the culture supernatant from removed peel and strained lees with or without C. cellulovorans. Hatched bars and dotted bars indicate Acetic acid and Butyric acid, respectively. Values are means ± SE of five independent samples. An asterisk indicates a significant difference (p < 0.05).
0.0 0.5 1.0 1.5 2.0 2.5
Without C. c With C. c Without C. c With C. c
Removed peel Strained lees
Organic acid (g/L)
Butyric acid
Acetic acid
*
*
*
39
3.1.6. Consolidated bioprocessing of C. cellulovorans and C. beijerinckii
C. cellulovorans, which was precultured anaerobically in the media with 0.5%
(w/v) Avicel at 37 °C without shaking for 4 days, was used. C. beijerinckii, which was precultured anaerobically with glucose for 1 day, was used. Dry weight of the removed peel was calculated from the water content, which was 71.6%. The removed peel, which was 0.28 g of wet weight, was added into C. cellulovorans medium as 2.5% (w/v) of a dried substrate. The final volume of the medium as approximately 8 ml for each vial. 12 vials were made. C. cellulovorans was inoculated in 3 vials, C. cellulovorans and C.
beijerinckii were inoculated at the same time in other 3 vials which were consolidated bioprocessing (CBP), C. beijerinckii was inoculated in other 3 vials and noting was inoculated in the remaining 3 vials which were negative control. Inoculation volumes of C. cellulovorans and C. beijerinckii were 1.5 ml and 0.15 ml, respectively. Removed peel in the media that were inoculated with C. cellulovorans alone and CBP were almost completely degraded for 72 h cultivation (Figure 13). Furthermore, total sugar concentration was reduced 96% in both C. cellulovorans alone and CBP (Figure 14a). It was clearly demonstrated that CBP was able to degrade removed peel as the same as C.
cellulovorans alone in spite of the higher concentration of the substrate, 2.5 %. And also,
the volume of the substrate after degradation was much less than that in the negative
control and was able to be easily separated by a centrifugation. Furthermore, it was clearly
revealed that C. beijerinckii was able to grow in the removed peel culture including
limonene because of the higher butyric acid concentration and gas production compared
with that in the negative control.
40
Figure 13. Nothing was inoculated (Negative control) (a), C. cellulovorans was inoculated (b), C. cellulovorans and C. beijerinckii were inoculated (CBP) (c), and C.
beijerinckii was inoculated (d) after 72 h cultivation.
b c d
a
41
However, butanol was not detected in any cultures. Only ethanol was detected and there was no significant difference (Figure 14b). On the other hand, reducing sugar concentration in the culture inoculated Clostridia reduced significantly compared with that of negative control (Figure 14c). Interestingly, reducing sugar concentrations in the culture inoculated C. beijerinckii were lower than the culture inoculated with C.
cellulovorans alone. It was suggested that there were some saccharides that C. beijerinckii preferred in the medium and C. beijerinckii consumed these saccharides even when C.
cellulovorans existed together. Therefore, the possibility was revealed that cellulosic biomass degradation by C. cellulovorans and the fermentation by C. beijerinckii carry out simultaneously, being exactly CBP. Furthermore, concentrations of formic acid and acetic acid increased but butyric acid concentration did not increase in the culture inoculated C.
cellulovorans. On the other hand, concentrations of acetic acid and butyric acid increased in the culture of CBP. Lactic acid concentration increased in the culture inoculated C.
cellulovorans alone, and no formic acid and acetic acid increased in the culture inoculated C. beijerinckii alone, and also butyric acid concentration in CBP was the highest (Figure 15). This result also suggested that C. cellulovorans and C. beijerinckii grew together producing formic acid by C. cellulovorans and butyric acid by C. beijerinckii and C.
cellulovorans.
42
Figure 14. (a) Total sugar concentration in the cultures, where negative control (open bar), C. cellulovorans alone (dotted bar), CBP (closed bar), C. beijerinckii alone (hatched bar) are included. (b) Ethanol concentration in the culture, where negative control (open bar), C. cellulovorans alone (dotted bar), CBP (closed bar), C. beijerinckii alone (hatched bar) are included. (c) Reducing sugar concentration in the culture supernatant, where negative control (open bar), C. cellulovorans alone (dotted bar), CBP (closed bar), C.
beijerinckii alone (hatched bar) are included. Values are means ± SE of five independent samples. An asterisk indicates a significant difference (p < 0.05).
0 1 2 3 4 5
N.C. C.c CBP C. b
Totalsugar(g/L)
0.00 0.05 0.10 0.15 0.20
N.C. C. c CBP C. b
Ethanol (g/L)
0.0 0.5 1.0 1.5 2.0 2.5 3.0
N.C. C. c CBP C. b
Reducing sugar (g/L)
* *
*
*
* b
c
a
43
Figure 15. Organic acid concentration in the culture supernatant, where (a) negative control, (b) C. cellulovorans alone, (c) CBP, (d) C. beijerinckii alone are showed. Lactic acid (close bar), formic acid (hatched bar), acetic acid (open bar) and butyric acid (dotted bar) are indicated. Values are means ± SE of five independent samples. An asterisk indicates a significant difference (p < 0.05).
0.0 0.2 0.4 0.6 0.8 1.0 1.2 1.4
Lactic acid Formic acid Acetic acid Butyric acid
Organic cid (g/L)
0.0 0.2 0.4 0.6 0.8 1.0 1.2 1.4
Lactic acid Formic acid Acetic acid Butyric acid
Organic acid (g/L)
0.0 0.2 0.4 0.6 0.8 1.0 1.2 1.4
Lactic acid Formic acid Acetic acid Butyric acid
Organic acid (g/L)
0.0 0.2 0.4 0.6 0.8 1.0 1.2 1.4
Lactic acid Formic acid Acetic acid Butyric acid
Organic acid (g/L)
d b
c
a
44
3.2.1. Degradation of SBP and Avicel with C. cellulovorans
Anaerobic batch cultivations of C. cellulovorans were carried out in a 40-ml
medium containing 0.5% (w/v) of SBP at 37 °C without shaking. After cultivation with
SBP, the volume became less than half of the negative control (Figure 16). Next, Avicel
was used for a reference of cellulose degradation with C. cellulovorans. The inoculation
volume with a C. cellulovorans monoculture was decided, according to measured cell
growth on the precultures. As a result, the initial RLU value of the monoculture closely
reached 1,000, whereas the RLU value of the C. cellulovorans preculture with 0.5% (w/v)
cellobiose was 20,257. Therefore, the inoculation volume was eventually decided to 2 ml
for 40-ml monoculture which was about 21 times dilution, so that the initial RLU value
of the C. cellulovorans monoculture was 964. The concentrations of total sugar, reducing
sugar and organic acid, cell growth and gas production were measured for 11-days
cultivations. C. cellulovorans degraded 87.3% SBP and 86.3% Avicel, respectively,
without any pretreatment (Figure 17a). Interestingly, the maximum cell growth in the
Avicel culture was 5-days after inoculation, which was the second peak in the profile,
while that in the SBP culture was 1-day after inoculation, which was the first peak in the
profile, but both SBP and Avicel culture had the first peak and the second peak (Figure
17b). On the other hand, reducing sugar concentration at 0-day in SBP culture was more
than two times higher than that in Avicel culture (Figure 17c). The difference of the first
peaks suggested that while C. cellulovorans grew rapidly utilizing rich reducing sugar
and fresh mineral in SBP culture, C. cellulovorans grew slowly due to less reducing sugar
in Avicel culture. Furthermore, because gas production in Avicel culture became active a
couple of days after inoculation, it was suggested that C. cellulovorans needed
approximately a couple of days to prepare cellulosome and non-cellulosomal enzymes,
and then the degradation became active after a few days. The second peak in Avicel
45
culture was more than six times higher than that in SBP culture. This result suggested that Avicel, which had higher total sugar concentration than SBP, was degraded and cellobiose was released, which then allowed C. cellulovorans to grow thrivingly utilizing rich cellobiose. More interestingly, butyric acid concentration in Avicel started to increase simultaneously with cell growth, however butyric acid concentration in SBP culture hardly increased (Figure 18a). Butyric acid concentrations of Avicel and SBP culture were significantly different (Figure 18b). On the other hand, concentrations of formic acid and acetic acid in Avicel and SBP culture were not significantly different, and formic acid and acetic acid were major products in SBP culture. It was suggested that a metabolic pathway in C. cellulovorans might be different between the SBP and Avicel cultures (Figure 19). According to the gas production in the SBP and Avicel cultures, H
2productions were 28.6 liter per 1 kg of dried SBP and 132 liter per 1 kg of Avicel, respectively (Figure 18c). Therefore, the decrease of the total sugar in the SBP culture seems reasonable to produce 28.6 liter of H
2whose concentration was close to 22% of 132 liter of H
2in the Avicel culture. Thus, it indicated that C. cellulovorans degraded cellulosic biomass to produce H
2which should be a raw material of CH
4by the CO
2reduction pathway in methanogens.
46
Figure 16. The cultures after the cultivation of C. cellulovorans with SBP. (a) Negative control. (b) The cultivation of C. cellulovorans. SBP used in the culture media was not pretreated by milling.
a b
, 1 1 .
I '
9
、
~ -
'
\ i
璽
47
Figure 17. Cultivation of C. cellulovorans with SBP and Avicel. (a) Total sugar
concentration after 11-days cultivation in the culture with SBP (left) and Avicel (right), where negative control (open bar), C. cellulovorans (closed bar) are included. (b) Cell growth in the culture with SBP (left) and Avicel (right). (c) Reducing sugar
concentration in the culture with SBP (left) and Avicel (right). Values with error bars are mean ± SE of three independent samples. An asterisk indicates a significant difference (p < 0.05).
0.0 0.2 0.4 0.6 0.8 1.0 1.2
N.C. C.c
Total sugar (g/L)
0.0 1.0 2.0 3.0 4.0 5.0 6.0
N.C. C.c
Total sugar (g/L)
0.0 0.2 0.4 0.6 0.8 1.0
0 2 4 6 8 10 12
Reducing sugar (g/L)
Time (days) 0.0
0.2 0.4 0.6 0.8 1.0
0 2 4 6 8 10 12
Reducing sugar (g/Ll)
Time (days) 0
500 1000 1500 2000 2500 3000
0 2 4 6 8 10 12
Cell growth (RLU)
Time (days)
0 2500 5000 7500 10000 12500 15000 17500 20000
0 2 4 6 8 10 12
Cell growth (RLU)
Time (days)
* *
b a
c
First peak
First peak
Second peak
Second peak
48
Figure 18. Cultivation of C. cellulovorans with SBP and Avicel. (a) Organic acid concentration in the culture with SBP (left) and Avicel (right), where lactic acid (∆), acetic acid (*), butyric acid (filled circle), formic acid (open circle) and propionic acid (flat bar) are included. (b) Organic acid concentration in the culture with SBP (left) and Avicel (right) after 11-days cultivation. (c) Gas production after 11-days cultivation in the culture with SBP (left) and Avicel (right), where H
2(closed bar), CH
4(hatched bar), CO
2(open bar) are included. Values with error bars are mean ± SE of three independent samples.
0 10 20 30 40 50 60
H2 CH4 CO2
Gas production (L/kg)
0 50 100 150 200 250
H2 CH4 CO2
Gas production (L/kg)
0.0 0.5 1.0 1.5 2.0 2.5
Lactic acid
Formic acid
Acetic acid
Propionic acid
Butyric acid
Organic acid (g/L)
0.0 0.5 1.0 1.5 2.0 2.5
Lactic acid
Formic acid
Acetic acid
Propionic acid
Butyric acid
Organic acid (g/L)
0.0 0.5 1.0 1.5 2.0 2.5
0 2 4 6 8 10 12
Organic acid (g/L)
Time (days) 0.0
0.5 1.0 1.5 2.0 2.5
0 2 4 6 8 10 12
Organic acid (g/L)
Time (days)
c b a
Lactic Formic
Acetic Butyric
![Figure 2. Central metabolic pathway in Clostridium cellulovorans, based on the data presented in references [40,60,61,62,123]](https://thumb-ap.123doks.com/thumbv2/123deta/6418801.2141130/12.892.158.758.163.681/figure-central-metabolic-pathway-clostridium-cellulovorans-presented-references.webp)