SYNOPTIC CLIMATOLOGICAL STUDY OF PRECIPITATION DISTRIBUTION
IN THE KANTO DISTRICT,
CENTRAL JAPAN
Takayoshi AOYAMA*
Abstract On the basis of the daily precipitation maps fbr the Kanto district,the distribution pattern is studied in connection with the synoptic and meso−scale moteorological situation.
The topographic effect on the formation of band like rain distribution is also examined.
1.Introduction
About the distribution of precipitation amount in the Kanto district, some investigations have been pursued. For heavy・rain days in Tokyo, Sekiguti(1965a)established the丘ve distribution patterns of daily precipitation amounts in the Kanto district. They were oro・
graphic rain band, whole area rain, frontal rain, coastal rain and scattered rain pattern.
Their occurrence are caused by meteorological reasons and effects of the topography. The orographic rain bands occur in several fixed parts of Japan under the influence of typhoon,
as pointed out by Sekiguti(1965b). Yanagisawa(1961)studied the rain band in the Kanto district and made clear the trigger action by the topography.
Some of the rain bands running SW−NE direction in the Kanto Plains is caused by local front(Nishimura, D.,1932);It can be considered that these coincide with the frontal rain pattern by Sekiguti。 The local fronts are formed by the effect of topography and rainfall along the front was named secondary orographic precipitation.
For distribution of rainfall amount in the Kanto district by extra−tropical cyclones,
Yoshino(1955)pointed out the distance from the center of the cyclone and the effects of the topography as important factors. It can be considered that this rainfall distribution corresponds to the whole−area rain and coastal rain pattern by Sekiguti.
The investigations as mentioned above showed the importance of topographic effects on the distribution of precipitation amount in the Kanto district. In this paper, the author intended to show the synoptic condition of and topographic effect on each precipitation distributign pattern in the Kanto district.
*Environmental Science, Faculty of General Education, Yamagata University
2.Classification of Daily Precipitation Maps
The data used here are daily precipitation amount at about 240 weather stations in the Kanto district. Using these data,174 daily precipitation maps which the number of sta・
tions with precipitation exeeded more than ten were constructed in 1962 and l 963.
Distribution of precipitation on these maps are classified into 4 main types(Type I−IV).
Further, these main types can be subdivided into 10 basic patterns. Seasonal frequencies of the types are shown in Table 1.
Type I is the distribution pattern that precipitation were observed at almost all stations in the district. In this case, as expected from the results of the Yoshino s investigation
(1955),precipitation amount were more in surrounding mountains and along the coastal region than in the central part of the Kanto Plains. This type corresponds to the whole・area rain pattern by Sekiguti. These were subdivided into two types of Ia and Ib.Type Ib is the one of the whole・area rain pattern but accompanied with the rain band running from SW to NE in the Kanto Plains. Type I occurs at a frequency of l8%of all cases and has a maximum frequency in spring(Mar.−May).
Type II is the pattern that rain area is recognized along the Pacific coast region of the Kanto district and precipitation amount decreases toward inland. This corresponds to the coastal rain pattern by Sekiguti.
These were subdivided into three types of Ila, IIb and Ilc, according to the location of the rain area. Type Ila has a rain area along the southern coast in Kanagawa Prefecture and
Table l Occurrence frequency(days)of the precipitation patterns in the Kanto district
Type Winter
iD.−F.)
Spring iM.−M.)
Summer
iJ.−A.)
Autumn
iS.−N.) Total
1
ab 21 78 43 33 16
P5
Tota1 3 15 7 6 31
II
abC 124 831 723 10
@3 S
26 P0 P2
Total 7 12 12 17 48
III
abC 12 552 8
P0
@9
64 20
Q1 P1
Tota1 3 12 27 10 52
IV
ab
1 2
6
P5
23 8
Q1
Total 1 2 21 5 29
Unclassified 4 8 2 14
Total 14 45 75 40 174
L・ビプ<
southern part of Boso Peninsulaセ. Type Ilb is the pattern which shows the rain area along the eastern coast in Ibaraki Prefecture. Type Ilc is similar to Type Ilb but has a rain area along the mountainous area in the western part of the Kanto district. Type II occurs at a frequency ofabout 28%and a maximum in autumn(Sep.−Nov.).
Type III is rain band or frontal rain pattern. These were sub−divided into three types of IIIa, IIIb and IIIc, according to the direction of rain band. Type IIIa has the rain band running WSW・ENE, Type IIIb running W・E and Type IIIc running S・N, respectively. The occurrences are about 30%of all cases and concentrate in summer(Jun.−Aug.)at about 50%
of this type.
Type IV is the local or scatterd rain pattern. These were subdivided into two types of IVa and IVb. Type IVa has a limited rain area extended from mountainous region in the northern Kanto district to the direction of east across the plain. The frequency of type IV is about 17%and concentrate in summer at over 70%of this type.
14maps were not classified into these 4 types.
3.Distribution Patterns of Precipitation and Synoptic Condition
The occurrence of the precipitation distribution pattern is caused by meteorological reasons and topographic effects, as mentioned before. In order to clarify the meteorological reasons for each precipitation type, synoptic weather situation and stability of the lower layer in the troposphere were examined in this chapter.
Pressure pattem
Identification of meteorological causes of each precipitation type was made by using the synoptic weather charts at 2100 JST. According to the classification of Yoshino and Kai
(1975)these weather charts were classified into three main pressure patterns;These are trough, frontal and typoon patterns. Further, these main pressure patterns except for a ty・
phoon were subdivided into 7 basic patterns, according to the position of the disturbance(s).
Th.e trough patterns were subdivided into four types, according to the position of the low, as follows:
Double low pattern:lows travel simultaneously along the Sea of Japan and Pacific coast of the Kanto district;
Kanto Plain low pattern:alow passes over the Kanto district;
Pacific coast low pattern:alow travels over the Pacific ocean along the Pacific coast of the Kanto district;
Japan Sea low pattern:alow travel over the Sea of Japan.
The frontal patterns were subdivided into two types, as follows:
Kanto Plain frontal pattern:the front runs over the Kanto district;
Pacific coast frontal pattern:the front runs over the Pacific ocean along the Pacific coast of the Kanto district.
The occurrence frequencies of the respective precipitation types under these pressure patterns are indicated in Table 2. In this table, since the rest of the seven basic patterns are very low in frequency, these are indicated taking together by the total numbers.
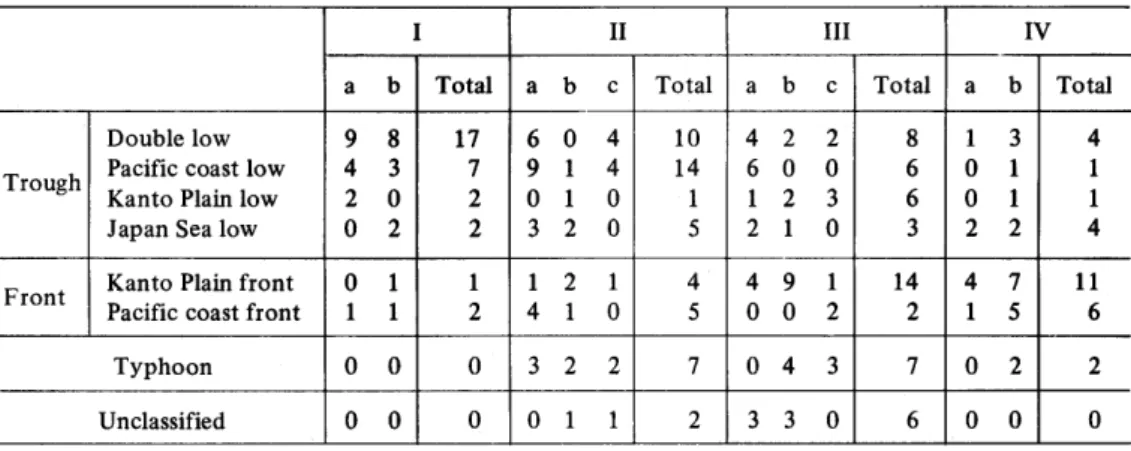
Table 2 0ccurrence frequency(days)of the pressure patterns for each precipitation pattern
1 II III IV
a b Total a b c Total a b c Tota1 a b Tota1
Trough
Double low oacific coast low janto Plain low iapan Sea low
9 8 S 3 Q 0 O 2
17
@7
@2
@2
6 0 4 X 1 4 O 1 0 R 2 0
10 P4
@1
@5
4 2 2 U 0 0 P 2 3 Q 1 0
8663 1 3
O 1 O 1 Q 2
4114
Front Kanto Pla血front oacific coast front
0 1 P 1
12 1 2 1 S 1 0
45 4 9 1 O 0 2
14
@2 4 7 P 5
11
@6
Typhoon 0 0 0 3 2 2 7 0 4 3 7 0 2 2
Unclassified 0 0 0 0 1 1 2 3 3 0 6 0 0 0
The frequency of the trough pattern(57%)is about twice as many as that ofthe丘ontal pattern(28%). In the case of trough pattern, the whole−area rain type(Type I)and coastal rain type(Type II)appear more frequent,than the other rain types. On the contrary, frontal pressure pattern bring the frontal(Type III)and scattered(Type IV)rain types more than others. According to the frequencies of the respective pressure patterns, it becomes clear that the double low pattern(22.4%), Kanto Plain front pattern(17.2%)and Pacific coast low pattern(16.1%)prevail more than the rest of these(less than 10%). The frequencies of the four main rain types(Type I−IV)under these three pressure patterns indicate brief synoptic condition for apPearances of respective rain patterns.
The whole・area rain type(Type I)prevails under the synoptic condition of double low pressure pattern. The coastal rain type prevails under the two pressure patterns, the Pacific coast low and double low pattern. This difference between Type I and Type II can be considered that the distance from low over the Pacific Ocean to the Kanto Plain is significant factor for distribution pattern of rain as indicated by Yoshino(1955). In the cases of the Kanto Plain front, Type III and Type IV occur frequently. Addition to this, the pattern of the Kanto Plain low indicates the maximum frequency of Type IIL These results indicate that the Type III tends to appear in the case of disturbance over the Kanto Plain.
Convective instability
In order to show the stability of stratification in the case of the respective rain types,
differences of potential wet−bulb temperature between at 900mb and 700mb are calculated.
The result of the analysis is shown in Table 3.It will be seen that there is a tendency ofthe convective instability to increase with the rain pattern from Type I to Type IV;Type I and Type II occur mainly under the condition of convectively stable but Type III and Type IV in convectively unstable layer. In the respective main types, however, differences of stability among, or between, basic patterns are not recognized but in Type I」n Type Ib,
stratification is more unstable than in Type Ia.
Zona1 and meridional indices
In order to see a surface flow in a neighbouring area of Japan, zonal and meridional
Table 3 Frequency of potential pseudo−wet−bulb temperature difference between 700mb and 900mb levels at Tateno aerological observ−
atory
△θsw(700mb 一900mb),°C
Type
一7 一5 一3 一1 1 3 5 7 9 11
1
ab
2
24 56 71 12 1
Tota1 2 6 11 8 3 1
II
abC
1 2
3 533 915 123 42 3 1
Tota1 1 2 3 11 15 6 6 3 1
III
abC
121 275 764 251
5 21 1
Total 4 14 17 8 5 3 1
IV
ab 11 3
P3
34 13
Total 2 16 7 4
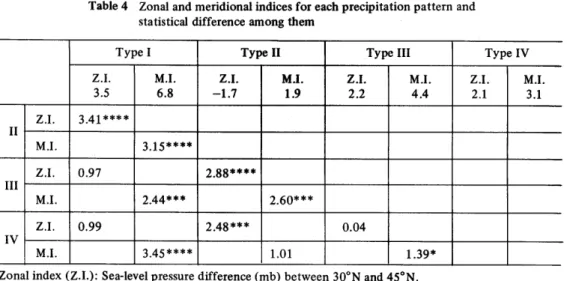
indices are calculated. Zonal index is a pressure difference between the circles of latitude 30°Nand 45°N. The pressure along these latitude circles at each 5 degree from longitude 125°Eto 150°E are taken from surface weather chart at 2100JST. The meridional index is diffe rence between the mean pressure at 30°N and 45°N along longitude 135°E and at the same latitudes along l 50°E on the weather chart. Mean zonal and meridional indices for respective rain types are shown in Table 4.
Both zonal and meridional indices are largest in the case of Type I. In paticular, meri・
dional index of this type is largest among under the four main types and this is significant difference at the significance level under 5%by student・t test. This indicates that Type I appears under strong surface southwest flow situation in a neighbouring area of Japan.
Under Type II, zonal index is negative and the differences from the other types are statistically significant at the level of under 5%. This indibates that Type II apPears under the easterly flow situation.
Under Type III and IV, zonal and meridional indices are positive and the meridional index of Type III is larger than that of Type IV at the significance level under 20%. This indicates that the both types appear under the southwest flow situation but Type III under the condition of the wind with the larger south component. Type IV tends to appear under the weakest southwest flow situation.
Flow situation for the respective rain patterns was analysed by zonal and meridional indices. As the results, the respective rain types appear under the characteristic surface flow situations indicated by zonal and meridional indices in a neighbouring area of Japan. Type II
Table 4 Zonal and meridiona互i澱dices for eacll precipitation pattern and statistica1 difference among them
Type I Type lI Type llI Type lV
Z.1.
R.5
M.1.
U.8
Z.1.
│1.7
MJ.
P9
Z.1.
Q.2
M.1.
S.4
ZJ.
Q.1
M.1.
R.1
Z,1. 3.41****
II
MJ. 3.15****
Z.1. 0.97 2.88****
III
M.1. 2.44*** 2.60***
IV
Z.1. 0.99 2.48*** 0.04
MJ. 3.45**** 1.01 1.39*
Zonal index(Z.1.):Sea−level pressure difference(mb)between 30°N and 45°N.
Meridional index(M.1.):Sea−level pressure difference(mb)between 135°E and 150°E.
Figures in columns:t−value
Significant level:****:≦1%,***:≦5%,**:≦10%,*:≦20%
appears under easterly flow situation and the other under southwest flow situation. More・
over, it is f6und that the intensity of south component is important飴ctor causing the rain patterns of the Type I, Type III and Type IV. Type I apPears under the strongest south component flow and Type IV under the weakest flow situation.
Pressure pattern, convective instability and surface air flow situation under the respective rain patterns were examined. As a result, it was found that the respective rain types appear under the characteristic synoptic conditions. Type I occures in convectively stable air advected north・east ahead of the deep trough. South component of advected flow is the largest in this case. Type II occures in convectively stable or neutral air from east under the pressure pattern of the double lows or the Pacific low. Type III and IV appear in convec−
tively unstable or neutral air under the influence of the front. Type III also appears occasionally under the influence of the low travelling over the Kanto Plain. Type IV appears under the weakest southwest flow situation.
4.Precipitation Distribution of Band Structure
In the Kanto district, the band like distribution of precipitation appears丘equently.
The distribution pattern with band structure are seen not only in the Type III but also in Type Ib. In the case of Type IVa, we can see also the rain area extended from west to east in the northern Kanto Plain. These rain bands have a tendency to occure at fixed location;
These are similar to the orographic rain band under the influence of a typhoon or secondary orographic precipitation as described before. In this chapter, meso・scale air flow condition and place where the rain band is formed will be examined.
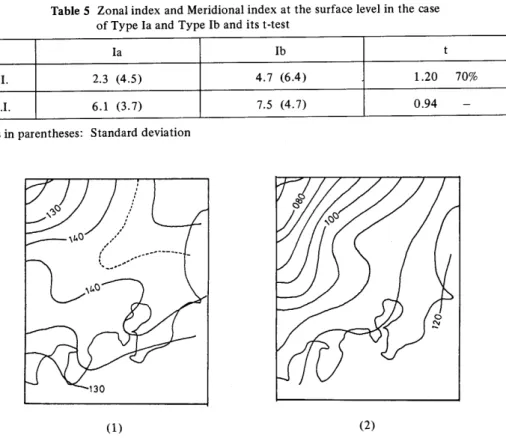
Table 5 Zonal index and Meridional index at the surface level in the case of Type Ia and Type Ib and its t−test
Ia Ib t
Z.1. 2.3 (4.5) 4.7 (6.4) 1.20 70%
M.1. 6.1 (3.7) 7.5 (4.7) 0.94 一
Figures in parentheses:Standard deviation
(1) (2)
Fig.1 Composit maps of Sea−level pressure(0.lml))distribution for Type Ia(1)and Type Ib(2)・
Meteorological condition for the rain band formation 77ie rain band of the whole−area rtガnリノρθ
In Table 5, zonal and meridional indices obtained by the same way in chapter 3 are shown for Type Ia and Ib. The both indices are larger for Type Ib than for Type Ia. In particular, the statistical difference of zonal indices is recognized at the significance level of 30%.This indicates that Type Ib appears under the condition of strong surface wind which has larger west component in the neighbourhood of Japan.
Furthermore, the daily mean sea・1evel pressure fbr Type Ia and Ib were averaged to make composit maps of pressure distribution. As in Figure l, the pressure distribution are remarkably different between these two composit maps. For Type Ib, isobars trend almost meridionally and high pressure locate in the Pacific coast region. On the other hand, Type Ia shows an inland high pressure area and isobars almost running zonally. These sea−level pressure distribution suggest the surface wind SW for Type Ib and E for Type Ia over the Kanto Plain.
In order to see the vertical wind structure,histograms of wind speed and direction at each pressure level for Type Ia and Ib are shown in Figure 2. In the heigher atmospheric layer,
there is no difference in wind speed and direction between these rain types but in the lower layer remarkable difference is readily seen. At the levels of 700mb,600mb and 500mb,
southwesterly tends to blow in both cases. This coincides with the wind direction estimated
5 0
50
OPつ
500
600
700
800
900
500mb
一..uuuLL
50
5
5 0
50
500mb 1
600mb
700mbmbl 1
800mb
900mb
10203040・/・W S E lO 203040 m/・W S E0
(1) (2)
Fig.2 Vertical distribution of wind speed and direction at Tateno for Type Ia(1)and Type Ib(2),
xvb
F\
ズ
∫
b
\
ズ
ノ
毒
!
(1) (2)
Fig.3 Local weather charts as an example of Type Ia,
(1)Jun.122100JST,1962 (2)Jun。130300JST,1962
F:Mt. Fuji(3,772m), T:Mt. Tsukuba(869m),ロ:Tateno(3000m level)
丘om the synoptic pressure pattern and the zonal and meridional indices. At 900mb level,
however, southeasterlies prevail in the case of the Type Ia and southwesterlies in the case of Type Ib. The tendencies of the wind direction correspond with the direction estimated from the composit pressure distribution maps. The difference of wind speed is clear at the level under 700mb」n particular, wind speed at 900mb is stronger for Type Ib than for Type Ia.
This tendency coincides with the difference suggested by zonal and meridional indices.
As a result, the vertical wind shear in the lower atmospheric layer is smaller for Type Ib than 負)rType Ia.
Case study of Type la
In order to show meso−scale meteorological situation for Type Ia, the local weather charts
\
\Nb
(1) (2)
Fig.4 Local weather charts as an example of Type Ib。
(1)Jun.100900JST,1962 (2)Jun.102100JST,1962
on 2100JST, Jun 12 and O300JST, Jan 13 1962 are shown in Figure 3. The synoptic weather charts on this day were classified into the Pacific coast low pattern.
The pressure of the central part of the Kanto Plain is higher than that of southern part of the Pacific coast region through the day. It will be seen also that the wind aloft brews from SW which is shown by the wind direction at Mt. Fuji, Mt. Tsukuba and the 3000m level of Tateno aerological observatory, but surface wind from NE or E. The pressure distribution and vertical wind distribution on the day coincide with the pressure distribution on the composit map and vertical distribution ofwind direction for Type Ia, respectively.
Case study of 7ンpe lb
As the example of Type Ib, we would like to show a rain day on Jun 10,1962. The synoptic weather charts on this day was classified into the double low pattern. The local weather charts on O900 and 2100 JST are shown in Figure 4.
The pressure along the Pacific coast of the Kanto Plain is higher than that ofinland area and isobars run from SW to NE. Corresponding to the pressure distribution, the strong SW wind blows in the Pacific coast region and the weak and variable wind prevails in the inland area. Discontinuity line running from SW to NE, as shown by Nishimura(1932), are clearly recognized between these two wind systems. The southwesterly upper wind prevails over the Kanto district, as to be shown by the wind direction at the top ofMt. Fuji and Mt. Tukuba and the 3000m level of Tateno. It would be considered that the rain band is formed along the discontinuity line between the southwesterly general current and the topographically stagnated air in the Kanto Plain.
7力θ血)n tal and∫cattered rainリノρθ∫
Type III and IV tend to occur in convective unstable air under the influence of front.
Type III shows the clear rain band distribution, Type IV does not accompany rain band distribution but shows the rain area with E・W running isohyets in northern Kanto Plain.
In Figure 5, the histograms ofwind speed at the five pressure levels are shown in the case
5 0 10 5 0
5
1∩∪∩∪
5 0
10 20m/s
500mb
600mb
700mb
800mb
900mb
10 20 30m/s
(1) (2)
Fig.5 Vertical distribution of wind speed at Tateno for Type IVa(1)and Type IVb
(2).
10
500mb
@ 10 500mb
600mb
@ 10
600mb
700mb 10 700mb
800mb
@ 10
800mb
0
900mb
@ 10
900mb
A 《
10 20 30 40m s 10 20 30m s
(1) (2)
Fig.6 Vertical distribution of wind speed at Tateno for Type III(1)and Type IV(2).
of Type IVa and IVb. In the both cases, wind speed is below lOm/s at the lower two levels,
900mb and 800mb. However, the mean wind speed of Type IVa, is stronger than that of Type IVb at the 700mb level. From the comparison of the wind speed between these two cases, it is considered that the rain area begins to extend along the direction of wind above about 10m/s ofwind speed at the 700mb level.
In order to see the relationship between the occurence of rain band and wind speed,
the histograms of wind speed for Type III and IV are shown in Figure 6. This shows that the precipitation distribution with band structure over the Kanto Plain appears under the condi−
tion of wind speed above lOm/s at the 900mb and 800mb levels and above 15m/s at the 700mb level.
As described in chapter 2, distribution maps of Type III were classified into three basic types according to direction of rain band. The relationship between the trend of the rain band and upper wind direction were examined. The mode in frequency distribution of upper wind direction,700mb and 500mb, coincide with the trend of rain band axis in each case;The rain band extends in the direction of geostrophic wind in the layer above the 700mb level. This result is supported by the statistical treatment of zonal and meridional indices.
The synoptic and meso−scale weather situations were examined for the frontal or rain band type. Type Ia and Ib occur in convectively stable layer under the trough pattern・
In this case, the difference of vertical wind structure is clear in the lower layer. In the both cases, upper wind at the 500mb and 700mb is strong southwesterly」n lower layer, however,
the southeasterly prevails for Type Ia and the southwesterly for Type Ib.These wind direc−
tions in lower layer for each case agree with the directions estimated from the sea−level pressure distribution over the Kanto Plain.
The vertical distribution ofwind speed is also different in the lower layer. The wind speed at the 900mb level for Type Ia weaker than that of Type Ib. Since the wind speed over the 700mb level are about the same in these two cases, vertical wind shear for Type Ib is smaller than that of Type Ia. These statistical results were supported by the case studies for the Type Ia and Ib. These case studies showed that the rain band is formed along the discontin・
uous line between the topographically stagnated air and the southwest general current with small vertical shear.
Type III and IV occur in convectively unstable or neutral air under the similar pressure pattern. However, the vertical wind structure are different from each other. The wind speed for Type III is stronger than that of Type IV in the layer below 500mb level. When the wind speed is above 10m/s at the levels of 800mb and 900mb and above 15m/s at the 700mb,the rain distribution with linear structure is formed. Moreover, the trend of the rain band almost coincides with the geostrophic wind direction at the 700mb and 500mb levels.
Geographical distribution of the rain band
In order to show the topographic effect on the f6rmation of rain band, distribution of rain band axes is shown for the typical frontal types in Figure 7. The axes ofrain bands are not distributed uniformly;These axes tend to concentrate in several parts of the Kanto Plain. In the case of Type IIIa, the axes run from the southern and northern slopes of
Fig.7 Geographical distlibution of the rain band axes in the case of typical frontal types(Type IIIa, IIIb and IIIc). Contour:500m and 1000m.
Mt. Fuji through the Kanto Plain toward the ENE. In the case of Type IIIb, the rain band extends from the neighbourhood of Mt. Fuji, the eastern end of Tokyo Bay toward the N.
The E・W axes for Type IIIc extend from the northern and southern slopes of Mts. Chichibu,
west of the Kanto Plain, and the southern slopes of Mts. Ashio, northwest of the Kanto Plain, toward the E. In the case of Type III, the rain band extends toward the direction of upper wind from the slopes of Mt. Fuji, Mts. Chichibu and Mts. Ashio and the coast of Tokyo Bay.
In Figure 8, the axes of the rain band are shown for Type Ib and all other linear isohyetal patterns than the cases in Figure 7. As described before, the axes for Type Ib run in the SW・NE direction along the discontinuous line of the wind systems in the Kanto Plain.
The other rain bands appear in the neighbourhood of Mt. Fuji. These rain bands extend from the NW and SE slopes of Mt. Fuji toward the NE along the direction of upper wind. This is about the same as the cases of Type IIIa and IIIb.
亀 箋
Fig.8 Geographical distribution of the rain band axes in the case ofType Ib and all other linear isohyetal patterns.
From the consideration of the geographical distribution of the rain bands, it was sug・
gested that the rain band is formed at the mountain slopes or the coast running nearly parallel with the wind. In the Kanto district, the slopes of Mt. Fuji, Mts. Chichibu, and Mts. Ashio and the coast of Tokyo Bay play a significant role in the formation of the rain band. These places have the large differences in friction between mountain and low land or between land and sea. It seems to be considered that the formation of the rain band is due to the discontinuity in wind induced by difference in friction.
5.Conclusion
The precipitation distribution pattern, especially that with the linear structure in the Kanto district, were examined in connection with the synoptic and meso−scale meteorol・
ogical situation and the topographic effect・
Distribution of precipitation were classified into four main types. Those are the whole・
area rain(Type I), the coastal rain(Type II), the frontal rain(Type III)and the scattered rain(Type IV)types. Type I and II apPear in the convectively stable stratification under the trough weather pattern and the other in the relatively unstable atmospheric layer under the frontal weather pattern.
According to zonal and meridional indices based on the sea−level pressure, it was sug−
gested that the each rain type occurs under characteristic flow pattern in the neighbourhood of Japan. Type I appears under the strongest southwesterly and Type II under the easterly.
In the case of Type IV, the both indices are smallest and indicate the weak surface current or weak pressure gradient in the synoptic scale.
The four main types were subdivided into 10 basic patterns according to the position of rain area or direction of rain band. From the comparison of these rain patterns, the mete−
orological conditions for the formation of rain band were provided. The rain band appears under the condition of wind speed above lOm/s in the lower layer, at 800mb and 700mb levels, and l 5m/s at the 700mb level with the small vertical shear and extends in the direc−
tion of the upper wind or the discontinuous line between the different wind systems induced by topography.
The geographical distribution of the rain band shows some places where the rain band tends to be formed frequently. Those are the slopes of mountain(s)and the coast running parallel with the wind direction. The rain band is formed in these places and extends along the direction of upper wind or the discontinuous line. In the Kanto district, the slopes of Mt. Fuji, Mts. Kanto and Mts. Ashio play a significant role in formation of the rain band.
The author wishes to dedicate this article to Professor Dr. Takamasa Nakano in com−
memoration ofhis retirement from Tokyo Metropolitan University.
References Cited
Nishimura, D.(1932):On the rainfall in Japan*.Jour. Meteor. Soc.ノOρan,10,128−203.
Sekiguti, T. and his Collaborators(1965a):Aclimatology of heavy rains in Tokyo**.Tokyo Geogr. Pap.,
9,143−i67.
一(1965b);Geographical distribution of typhoon rain in Japan**.σθ08ア. Rev.ノdpan,38,501−518.
Yanagisawa, Z.(1961):An analysis of stationary rainband as observed by radar. Pap. Me t. Geoph.,12,
294−309.
Yoshino, M, M.(1955):Synoptic climatological study of the precipitation in the Kanto Plahl and its surrounding mountainous region**.σω8γ. Rev.ノごpan,28,37レ385,
−and Kai, K.(1975):Pressure pattern calendar,1941−1970*. Tenki,22,204−209.
(*in Japanese,**in Japanese with English abstract)