九州大学学術情報リポジトリ
Kyushu University Institutional Repository
小型赤外吸収システム用シリカハイメサ導波路に関 する研究
陳, 嬌
https://doi.org/10.15017/1441274
出版情報:Kyushu University, 2013, 博士(学術), 課程博士 バージョン:
権利関係:Fulltext available.
Silica High-Mesa Waveguide for Compact Infrared Sensing System
Interdisciplinary Graduate school of Engineering Science, Kyushu University
Hamamoto Laboratory
Jiao Chen
i
Table of contents
Abstract 1
Chapter 1 Introduction 5
1.1 Background: ageing issue 5
1.2 Breath sensing: state of the art 7 1.3 Sensing waveguide: state of the art 11 1.4 Loss in the waveguide: state of the art 14
1.5 High-mesa waveguide 16
1.6 Estimated required propagation loss criteria 17
1.7 Thesis construction 24
1.8 References 26
Chapter 2 Scattering loss reduction method on high-mesa
Si/SiO
2waveguide 35
2.1 Introductory overview 35
2.2 Absorption loss 37
2.3 Radiation loss 38
2.3.1 Radiation towards the substrate 39 2.3.2 Radiation from the bent waveguide 39
2.4 Scattering loss 41
2.5 Scattering loss mechanism and reduction 46
ii
scheme in high-mesa waveguide
2.6 Methods and results on scattering loss
reduction 48
2.6.1 Wavelength dependency in scattering
loss 48
2.6.2 Core thickness dependency in
scattering loss 50
2.6.3 Effective index dependency in
scattering loss 53
2.7 Conclusions 54
2.8 References 55
Chapter 3 Low loss silica high-mesa waveguide for infrared
sensing 61
3.1 Introductory overview 61
3.2 Propagation loss analysis 62
3.3 Scheme to suppress the propagation loss 70
3.4 Results and discussion 71
3.5 Conclusions 74
3.6 References 76
Chapter 4 Proposal of multiple slot silica high-mesa
waveguide for infrared absorption 79
iii
4.1 Introductory overview 79
4.2 Estimation of Γ
airfor single high-mesa
waveguide 80
4.3 Concept of multiple slot high-mesa waveguide 81
4.4 Results and analysis 83
4.4.1 Γ
airimprovement of multiple slot high-
mesa waveguide 83
4.4.2 Comparison to the single silica
structure 87
4.5 Conclusions 89
4.6 References 90
Chapter 5 Conclusion and outlook 93
5.1 Conclusion 93
5.2 Outlook 95
Appendix 97
A1 Theory calculation of scattering loss 97
A2 Finite Element Method (FEM) 109
A3 Beam propagation method (BPM): principle 110
References 111
Acknowledgement 113
iv
1
Abstract
The demand for a compact health-check system that can perform routine health-care checks has increased recently. Among many diagnostics methods, breath-content analysis is one of the candidates for daily health- care, as it contains various disease-markers and is non-invasive to human- beings. One of the attractive tools for breath-content analysis is infrared spectroscopy owing to its superior capability in ppm-order sensitivity of various kinds of breath contents. To build a compact breath-sensing system, the gas cell is one of the significantly challenging components to be realized, since the length of a regular gas cell reaches a meter-long optical path length. The compact breath-sensing system that utilizes photonic integrated circuits, such as hollow structure, slot structure, with infrared spectroscopy has been widely researched considering the capability of realizing a small radius of curvature, which is helpful for integrating meter- long optical path length into a compact area. High-mesa waveguide is attractive for its potential of being utilized for infrared absorption, where the evanescent field comes out of its solid core and profiles an optical portion out of the solid waveguide. One critical issue is its propagation loss which limits the sensing capability. In this research, to get lower propagation loss, we proposed silica high-mesa waveguide and extremely low loss of 0.02 dB/cm has been achieved. One of the issues for silica structure lies in its low portion of the optical field-profile out of the waveguide. To get rid of this problem, we have proposed multiple slot silica
2
high-mesa waveguide. For a quadruple slot silica high-mesa waveguide, a high portion of optical field profiles out of the waveguide of 20.3% has been achieved, and a low scattering loss of 0.06 dB/cm has been confirmed theoretically as well.
In this thesis, the research background and the purpose have been explained in Chapter 1. Breath content detection for easy medical health check-up has been proposed using infrared absorption sensing. Optical waveguide structure for infrared absorption sensing has been proposed and exploited. The estimated required propagation loss criteria have been clarified as well.
In chapter 2, the propagation loss category has been discussed. The propagation loss can be generally attributed to three different mechanisms:
scattering losses, radiation losses and absorption losses. For further classification, the scattering losses can be divided into volume scattering and surface scattering; radiation losses can be divided into radiation towards the substrate and the radiation from the waveguide bent;
absorption losses can be divided into interband absorption and intraband absorption. Some methods to get low propagation loss have also been discussed in this chapter as well.
In chapter 3, to realize lower propagation loss, silica high-mesa structure is proposed for infrared sensing. Setting under cladding height larger than 5 μm is proposed to suppress the radiation loss. As a result, an extremely low propagation loss of 0.02 dB/cm (@ w = 2.3 μm, λ = 1550 nm) has been achieved.
3
In chapter 4, the multiple-slot silica high-mesa waveguide structure is proposed. A high portion of 20.3% optical field profiles out of the waveguide has been achieved by quadruple silica high-mesa waveguide structure. Low scattering loss of 0.06 dB/cm has been confirmed theoretically as well.
In Chapter 5, the above results have been summarized and the future view of the proposed waveguide structure has been clarified.
4
5
Chapter 1 Introduction
1.1 Background: ageing issue
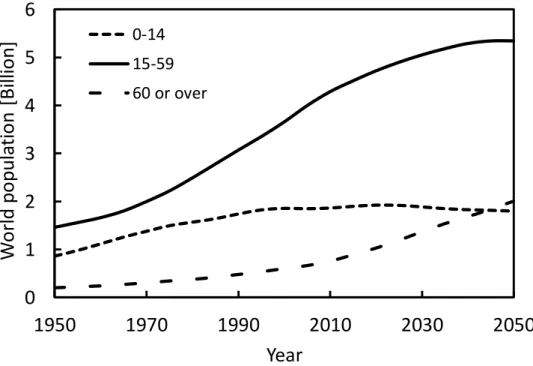
Population aging was one of the most significant issues of the twentieth century and will surely remain important throughout the twenty-first century 1). The number of elder (age 60 or over) people has been growing at an unprecedented rate. According to official statistics, in 2006 there were 688 million people in the world of aged 60 or over 2). As shown in Fig. 1.1, this number has become 759 million by the end of the year 2010. This age group (60 or over) is now identified as senior citizens. This number is predicted to reach 2 billion at the end of 2050 2, 3) as shown in Fig. 1.1. Meanwhile, Fig. 1.1 also predicts that the population of senior citizens will outnumber the population of teenagers who are aged below 14 for the first time in human histories at the year 2050.
One of the consequences of a population aging is its effect on medical care, besides the difficulties it creates for the financing of pension programs.
Compare with younger people, older people needs much more medical care 1). Thus, health monitoring for older people will become one of the serious issues for the society in the coming decades. There are a lot of regular health- monitoring methods, such as blood 4), urine 5), cough 6) and other tests, which helps us to identify a disorder or disease. And there are a lot of techniques to identify the presence of microorganism inside the body, like ultrasound 7), magnetic resonance imaging 7), eco-cardiogram 8), and others. These methods
6
are, however, either expensive or time consuming, and not suitable in routine monitoring mechanism. Moreover, all those methods require professional support to identify a disease. On the other hand, breath content detection, which is detected from the exhaled breath, incurs less stress to human body to collect, and it is real time, and contains massive information of human body 9). Present research on breath-content shows that the contents in the exhaled breath indicate the presence of micro-organism inside the human body or indicate the disorder or infection of any organ inside the body.
We are working on compact breath sensing system that can be integrated on cell phone or other mobile equipment, which makes routine health monitoring much cheaper and easier for senior citizens. What is more, the health condition of senior citizens can be monitored real time.
0 1 2 3 4 5 6
1950 1970 1990 2010 2030 2050
World population [Billion]
Year 0-14
15-59 60 or over
Fig. 1.1: World population aging situation and the degree of aging. The projected number is given until 2050.
7
1.2 Breath sensing: state of the art
Figure 1.2 shows the main content portion in exhaled breath. As shown in the figure, in human breath, 99% are consisted of nitrogen, oxygen and carbon dioxide, and 1% is consisted of a number of volatile organic compounds (VOCs).
It is well known that the VOCs found in breath are predominantly exhaled via the blood/breath interface in the lung, which is connected to all of the organs in body.
During 1980s researchers have proved the presence of Helicobacter Pylori inside the stomach by measuring the augmentation of carbon dioxide (CO2) at the exhaled breath 10). Helicobacter pylori are micro-aerophilic bacterium,
Nitrogen: about 97%
Oxygen: about 97%
Carbon dioxide: about 4%
Volatile organic compounds
(VOCs): about 1%
Fig. 1.2: Main content portion in exhaled breath. (The information of organs is contained in the VOCs.)
8
which are responsible for gastritis, stomach and duodenum cancer. To detect the presence of the helicobacter pylori inside the stomach, use of “urea breath test” became popular 10). The researchers have detected helicobacter pylori inside the stomach of human being by using scintillation 11) or by using isotope ratio mass spectrometry 12) or by mass correlation spectrometry 13) of CO2. All these three processes measure the presence of CO2 in exhaled breath. This result inspires the researchers to diagnose diseases from the exhaled breath.
Besides “urea breath test”, breath content for other molecules detection and sensing is now receiving considerable attention by the researchers 9 14-19), since breath contents are the disease markers of various diseases 9). Breath contents that are present in exhaled breath and the disease names that they indicate are given in table 1.1.
Name of the molecule Concentration in
exhaled breath Name of the disease Ref.
CH4 (Methane) 2-10 ppm Burger disease [20]
C2H6 (Ethane) 10 ppb Rheumatic fever, Diabetes mellitus, Chronic obstructive pulmonary
disease
[14]
[15]
C5H12 (Pentane) 0-10 ppm
CO (Carbon monoxide) 1-10 ppm Lung disease [9]
NO (Nitric Oxide) 10-50 ppb Allergy of trachea system [21]
NH3 (Ammonia) 0-1 ppm Kidney and renal failure [22]
COS (Carbonyl Sulphide) 0-10 ppb Lung transfer with acute
rejection [9]
C5H8 (Isoprene) 50-200 ppb Cholesterol biosynthesis [23]
CH3COCH3 (Acetone) 0-1 ppm [14]
Table 1.1: Breath contents with their orders in exhaled breath and the name of their indicative diseases. (Breath contents can be used to identify disease.)
9
As shown in Tab. 1.1, a number of marker molecules have been identified in breath that could be utilized to identify disease. Breath analysis has been widely researched for disease diagnosis or for monitor therapeutic intervention. As shown in the table, however, the concentration of marker molecules is as low as ppb or ppm order. Thus, to detect breath contents, a very high sensitivity is needed. Gas Chromatography and Mss Spectrometry 24), which are very precise, have been widely used in modern medical science. But those two methods both take a long time to diagnosis. One of the solutions for high sensitivity and real time is infrared absorption. It is well known that different gases have their unique absorption wavelength and the gas concentration can be deduced through their absorption cross sections through Beer-Lambert law 25), which are shown in Tab. 1.2. High sensitivity is available in infrared sensing as long as the optical path is long enough. Actually, the infrared absorption for breath sensing has been widely studied as shown in Tab. 1.3 and a lot of commercial products have been developed as shown in Tab. 1.4. But the size of the instruments are too large for daily use, this study is focus on compact breath sensing system that can be integrated on cell phone or mobile systems finally.
10
Breath content Absorption
wavelength [μm]
Absorption cross section [cm2]
Nitric oxide NO 5.26 6.1×10⁻¹⁹
2.67 1.2×10⁻²⁰
Carbon monoxide CO 4.6 2.1×10⁻¹⁸
2.33 1.2×10⁻²⁰
Ammonia NH3
6.15 3.1×10⁻¹⁹
3.00 1.2×10⁻¹⁹
1.51 2.5×10⁻²⁰
Acetone CH3COCH3 2.12 4.2×10⁻²²
1.69 3.6×10⁻²²
Methane CH4 3.24 1.7×10⁻¹⁸
1.651 1.64×10⁻²⁰
Ethane C2H6 3.35 1.7×10⁻¹⁸
1.7 1.5×10⁻²⁰
Carbon dioxide CO2 1.572 7.7×10⁻²³
Publication year
Name of the
institution Gas type Worked done Ref 2003 University of
Dusseldorf, Germany C2H6, CO2 Real time detection [15]
2007 Ekips Technologies, USA
CO2, NO, N2O
Breath test
Infrared sensing [16]
2007 Physical Sciences, UK CO2 Breath test
Infrared sensing [17]
2008 Mississippi State
University, USA CH3COCH3 Breath test
CRDS [18]
2009 Physical Sciences, UK C2H6 Breath test
ppm order [19]
Table 1.2: Breath contents with their absorption wavelength and absorption cross section 26-28). (Different gases can be identified by their unique absorption wavelength.)
Table 1.3: Breath contents analysis reports.
11
1.3 Sensing waveguide: State of the art
As discussed in section 1.2, breath-contents like carbon monoxide (CO- for lung disease), ammonia (NH3- for urinary tract infection), and other molecules are the disease-markers 9, 15, 20-22) of various diseases. To detect optical absorption of these molecules 15), propagation mode effective index 30), extinction of evanescent field 32), and other sensing techniques with directional couplers 34-35), Mach-Zehnder interferometers 34, 36), Bragg gratings 35, 37), micro ring resonators 32, 35, 38) and other waveguide structures have been exploited.
The sensing technique, waveguide structure and the detected substance are shown in table 1.5.
Name of the institution Gas type Worked done Ref.
Otsuka Pharmaceutical C12, C13 isotope
helicobacter pylori infection verification using infrared
sensing
[29]
Anima Corporation CO2 0~10% CO2 detection [30]
Ekips Technologies NO, CO2 ppm order infrared sensing [21]
Horiba Group NH3, CO2,
H2O, CH4 ppm order sensing using CRDS [31]
Tiger Optics
NH3, H2CO, N2O, CO2,
H2O, CH4
ppm order sensing using CRDS [20]
Table 1.4: Breath contents analysis products reports
12
Detected substance Main component structure Ref.
1 Methyl mercaptan (MM: CH3SH) Optical fiber [39]
2 Nano particle detection Nano cavity [40]
3 H2 Hydrogen Fabry perot micro cavity [41]
4 Acetone, ethanol,
dichloromethane
Bragg grating [42]
5 Isopropanol, water, cyclohexane Micro ring resonator [43]
6 De-ionized water Mach-Zehnder interferometer [33]
7 Ethanol High-mesa waveguide [44]
Core
Propagate direction
Fig. 1.3: Schematic of slot waveguide structure. (a) Schematic of cross section, (b) schematic of propagation direction. The light propagates in the slot region (nanometre order) between two cores.
(a) (b)
Cladding
Core
Propagate direction
Fig. 1.4: Schematic of hollow waveguide structure. (a) Schematic of cross section, (b) schematic of propagation direction. The light propagates in the core which is made of air.
(a) (b)
Cladding
Table 1.5: Reports on waveguide structure and detected substance
13
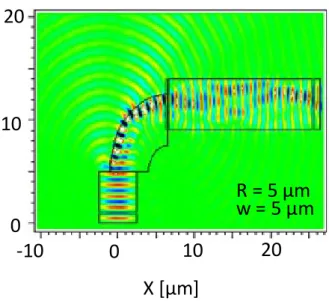
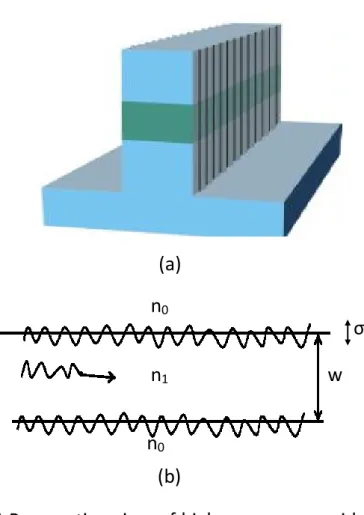
Unlike those complex structures (like micro ring resonator or Bragg grating), optical waveguide structures have been proposed for optical absorption sensing 39), such as slot 45-49), hollow 450-54) and high-mesa structures 44, 55-58) as shown in Fig. 1.3, Fig. 1.4, and Fig. 1.5, owing to the evanescent field comes out of the waveguide (solid material) and a certain portion of light profiles out of the waveguide, which can be used for breath sensing. The portion of light profiles out of the waveguide is defined as Γair.
Moreover, for optical absorption sensing in ppm order, meter long or even longer optical path is needed 44). For example, conventional cavity ring-down spectroscopy systems 59-61), which is a well-known technique to realize high sensitivity, usually has kilometre long optical path inside the cavity for optical absorption sensing. This system is, however, not handy, it does not measure in real time, and it is costly. To realize a long optical path in a compact area for
Core
Propagate direction
Fig. 1.5: Schematic of hollow waveguide structure. (a) Schematic of cross section, (b) schematic of propagation direction. Portion of optical fields profiles out the core material which can be used for sensing.
(a) (b)
Cladding
Cladding SiO2 (n: 1.44) SiO2 (n: 1.44)
Si (n: 3.48)
14
optical absorption sensing device, a gas-cell utilizing an optical waveguide is attractive due to the possibility of long optical path integration in a limited area. We propose optical waveguides based on semi-conductor material to realize an optical waveguide that is able to incorporate meter long or even longer optical path in a limited area. An optical waveguide, which has a small (< 10 µm) radius of curvature helps to realize a meter long or even longer optical path in a compact area. Concept of integrated waveguide in a limited area is shown in Fig. 1.6.
1.4 Loss in the waveguide: state of the art
One of the most important characteristics of a waveguide for infrared sensing is the attenuation, or loss. This loss is generally attributed to three difference mechanisms: scattering, radiation and absorption. Scattering loss is usually
Light input Band structure
Fig. 1.6: Concept of integrated waveguide in a limited area. (Small radius of curvature helps to integrate a long optical path in a compact area.)
Light output
15
predominates in glass or dielectric waveguides, while radiation loss becomes significant when waveguides are bent through a curve. Table 1.6 shows the current research outcomes about propagation loss on optical waveguide for different structures and materials.
Berried High-mesa Strip Slot Hollow
Si 0.3 62) 0.3 58) 2 ± 1 45) 6.5 ± 0.2 46)
2 (Asymmetry) 47) 0.00006 50)
Metal 0.05 51)
As2S3 0.05 63) Si3N4 0.007 64) Silica 0.001 65)
Currently, optical waveguide has been widely used in optical communication, especially the berried structures due to simplicity itself and low cost. For infrared absorption, low propagation loss is very important because high propagation loss consumes light power which degrades sensing capability. Si- based optical waveguide has been widely reported 45-47, 50, 58, 62) owning to low cost, mature fabrication technology and low absorption loss at the communication wavelength as shown in Tab. 1.6. But Si3N4 64) or silica 65) structure is also very promising because extremely low loss has been reported
64-65) for them.
Table 1.6: Waveguide propagation loss for different structures and materials. (Extremely low loss has been realized by Si3N4 and silica structures which is promising for infrared sensing.) Structure
Loss [dB/cm]
Material
16
1.5 High-mesa waveguide: state of the art
For optical absorption sensing, we need optical power portion out of the solid waveguide for the molecules to interact with the optical power. “High-mesa”
structure has been proposed 44, 55-56) for optical absorption sensing. High-mesa structure has been realized by using SOI (silicon on insulator) wafer, where Si core has been sandwiched by SiO2 both on the top and at the bottom. Silica high-mesa waveguide has also been proposed for its low propagation loss possibility. Table 1.7 shows the concurrent research on high-mesa waveguide.
As shown in Tab. 1.7, propagation loss of 0.3 dB/cm 44, 55-56) (@ w = 2.5 μm) has been achieved for Si based high-mesa waveguide. Relatively low propagation loss of 0.9 dB/cm 57) (@ w = 800 nm, Γair = 57%, TE mode) has been realized by No.
Optical power portion in air,
Γair (%)
Propagation loss (dB/cm)
Material
Used Etching process used Ref.
1 Not
mentioned
0.3 (waveguide width 2.5 µm)
SOI wafer
Neutral loop discharge plasma and Reactive
ion etching
[44]
2 Not
mentioned
0.3 (waveguide width 2.5 µm)
SOI wafer
Neutral loop discharge
plasma etching [55]
3
19 % (waveguide width 0.7 µm)
0.3 (waveguide width 2.5 µm)
SOI wafer
Neutral loop discharge
plasma etching [56]
4
2.3 % (waveguide width 2.3 µm)
0.02 (waveguide width 2.3 µm)
Reactive ion etching [66]
Table 1.7: Concurrent research on High-mesa waveguide (The lowest propagation loss has been realized by silica high-mesa waveguide.)
17
SOI high-mesa waveguide in our lab. What is more, extremely low propagation loss of 0.02 dB/cm 66) (@w = 2.3 μm, λ = 1550 nm, Γair = 57%, TE-mode) has been achieved successfully by silica single high-mesa waveguide. Moreover, low bending loss (0.05 dB/90° @ w = 2.3 μm, λ = 1550 nm and TE-mode) with small radius (30 μm) of curvature in bent structure has been calculated 57). We have also proposed a quadruple slot-waveguide structure by using two parallel single high-mesa structures. Using simulation higher (20.3%) optical portion inside the void slot compare with the single high-mesa waveguide has been confirmed. Moreover, low scattering loss of 0.06 dB/cm 67) has been predicted theoretically as well.
1.6 Estimated required propagation loss criteria
Here we estimate the allowable maximum propagation loss, theoretically, in this part. To estimate the allowable maximum waveguide propagation loss, we assume the following conditions;
(1) CRDS (cavity ring-down spectroscopy) 59-61) system, that is well-known technique to realize high sensitivity, is utilized.
(2) Only one ring-down number difference is detectable (minimum criterion).
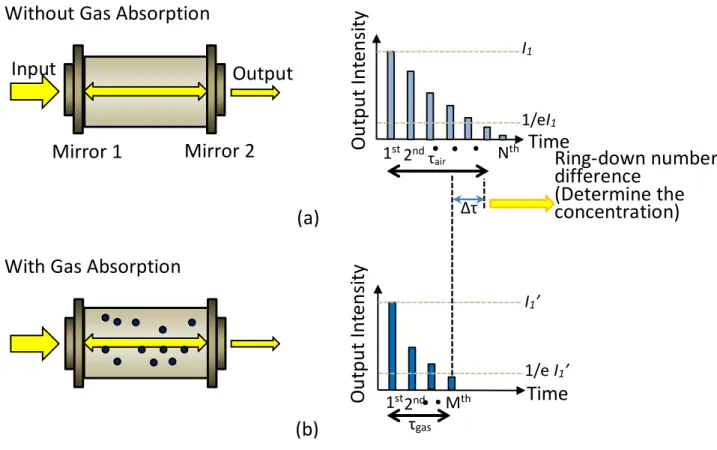
Figure 1.7 (a) and (b) show the schematic explanation of ring-down number difference in a conventional CRDS system (a) without gas absorption, (b) with gas absorption. As is shown in the figure, the gas concentration is determined by ring-down time difference (Δτ) between
Light output
18
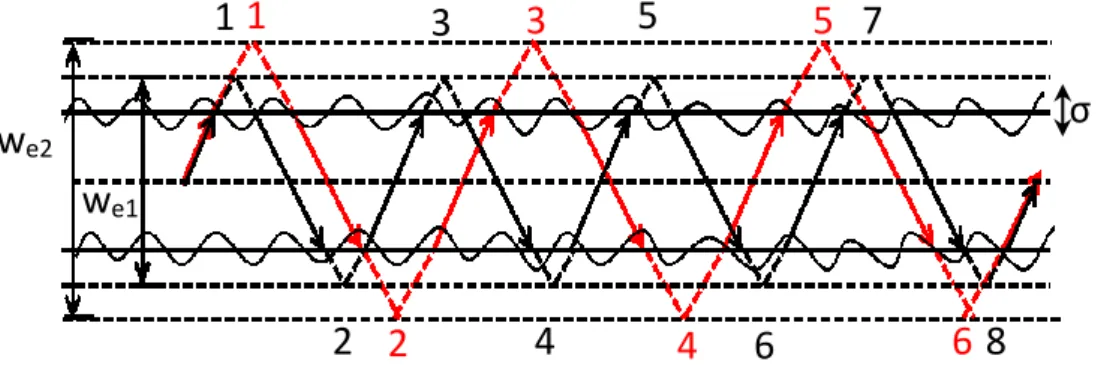
the ring-down time of τair (without gas absorption) and τgas (with gas absorption). The ring-down time (τ) is the time that the light intensity falls to 1/e of the initial intensity (I1 or I1’); and the pulse number during τ is called ring-down number, as is shown in Fig. 1.7. The ring-down number difference is the number of pulses during the ring-down time difference (Δτ).
I1
1/eI1
Output Intensity
Time
I1’
1/e I1’
Output Intensity
Time
Input Output
Mirror 1 Mirror 2 Without Gas Absorption
With Gas Absorption
τair
τgas
Δτ
Ring-down number difference
(Determine the concentration)
Fig. 1.7: Schematic of ring-down number difference in a conventional CRDS system. (a) Without gas absorption. (b) With gas absorption. (The gas concentration can be deduced by the ring-down number difference between (a) and (b).)
1st 2nd Nth
1st 2nd Mth (a)
(b)
19
(3) Target gas is 10 ppm methane (absorption cross section σ = 1.64 × 10⁻²⁰ cm2) 26), which is the same concentration in human breath in case of gut bacterial 23).
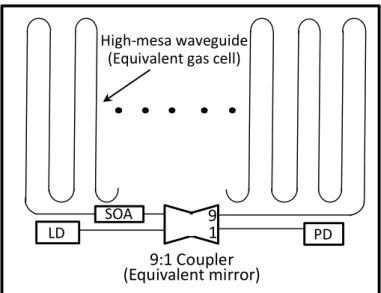
(4) To realize compact system, the gas cavity and the mirrors in conventional CRDS system have been replaced by optical waveguide and coupler, which are integrated on one chip, respectively, as is shown in Fig. 1.8.
Here we use 9:1 coupler for example, as is shown in the figure, for each round trip, there is 90% light power goes back to the circle and 10% goes to the detector through the coupler, which means the coupler is an equivalent mirror of which the reflection corresponds to R = 90%.
0
0 P
D
SOA 9
1 9:1 Coupler (Equivalent mirror)
LD PD
Fig. 1.8: Schematic of compact CRDS system. (All the devices will be integrated on one chip finally.)
High-mesa waveguide (Equivalent gas cell)
20
(5) Optical amplifier is integrated on one chip with waveguide to compensate the propagation loss. To facilitate the calculation, we assumed complete population inversion for the amplifier, where the noise figure NF ≈ 3dB.
(6) Γair (portion of optical field out of the waveguide, which affects the sensitivity) is set to be 80% 57). The effective path length of the waveguide is defined as Leff =Γair × L, where L is the waveguide length which is used for gas absorption (indicated as equivalent gas cell in Fig. 1.8).
Using the assumption above, the output intensity of the 1st pulse, namely, the output light intensity after the 1st round trip, which is seemed as I1 and I1’in Fig. 1.7 (a) and (b), respectively, can be deduced through the definition of the system propagation loss and the Lambert-Beer Law 25) as follow:
𝐼1 = 𝐼0(1 − 𝑅)𝑒(−𝛼𝑤𝐿+𝛼𝐺)(1 + 𝑒−𝛼𝑁) 𝐼1′ = 𝐼0(1 − 𝑅)𝑒−𝜎𝑛𝛤𝑎𝑖𝑟𝐿𝑒(−𝛼𝑤𝐿+𝛼𝐺)(1 + 𝑒−𝛼𝑁)
Here I1 (without gas absorption) and I1’(with gas absorption) are the output light intensity after the first round trip (the 1st pulse), I0 is the input intensity, αw is the waveguide propagation loss, L is the waveguide length, αG is the gain of amplifier, αN is the amplifier noise, σ is the gas absorption cross section, n is the gas concentration, and the Γair is the optical field out of the waveguide.
Repeating the calculation above for each round trip of light, the intensity of the Nth and the Mth pulse, shown in the Fig. 1.7, can be expressed as follow:
𝐼𝑁 = 𝐼0(1 − 𝑅)𝑁𝑒𝑁(−𝛼𝑤𝐿+𝛼𝐺)(1 + 𝑒−𝛼𝑁)𝑁
Without gas With gas
Without gas
(1.1)
(1.3) (1.2)
21
𝐼𝑀 = 𝐼0(1 − 𝑅)𝑀𝑒−𝑀𝜎𝑛𝛤𝑎𝑖𝑟𝐿𝑒𝑀(−𝛼𝑤𝐿+𝛼𝐺)(1 + 𝑒−𝛼𝑁)𝑀
Here IN and IM is the intensity of the Nth (without gas absorption) and the Mth (with gas absorption) pulse. For both cases of without gas absorption and with gas absorption, when the parameters of L, αG, αN, σ and Γair are known, the waveguide propagation loss (αw) and the output intensity of each pulse (IN & IM) form an equation which can be solved numerically. Comparing the intensity of each pulse to the 1st pulse, the ring-down number, which is the pulse number when the output intensity falls to I1×1/e and I1’×1/e, is obtainable. Then the ring-down number difference is available for different propagation loss. Next we discuss about how to determine L, αG and αN.
It is well known that the amplifier noise is amplified as well in the each round trip 68), which means the ring-down number should be limited in a range that the signal is not affected by the noise. Since about 200-times amplification has been reported 69) under the condition that the loss between each amplifier is -12.6 dB and the gain for each amplifier is 13 dB 70). Thus, for the calculation result, a ring-down number that less than 200-times is reasonable as long as the whole loss for each round trip is less than -13 dB. On the other hand, the absorption of gas is relatively low, thus it is also necessary to make sure that the gas absorption should not be affected by the noise, either.
Namely, the intensity of gas absorption should always higher than that of noise for each round trip before achieving enough ring-down number for gas detection. As to L, since the gain of the amplifier is limited, to get maximum allowable propagation loss, the L should be as short as possible, but too short With gas (1.4)
22
L leads to less gas absorption for each round trip which may cause the noise be higher than the gas absorption before achieving enough ring-down number. Thus during the calculation, adjust the amplifier gain and the waveguide length to determine the maximum allowable propagation loss that meet the conditions above, which are ring-down number less than 200- times; gas absorption higher than the noise; as short as possible L. The pulse intensity of I1 and I1’ can be deduced through Eq. (1.1) and (1.2), then the pulse intensity of I2…IN and I2’…IM can be deduced through Eq. (1.3) and (1.4), the ring-down number (N & M) is decided under the conditions of IN≧ I1×1/e
> IN+1 and IM≧ I1’×1/e > IM+1. Here we set the waveguide length is L = 50 cm, the maximum waveguide propagation loss should be about 0.2 dB/cm (the maximum waveguide loss is about -10 dB), since the amplifier gain should not be higher than 13 dB. The losses of the whole system are the waveguide loss and the coupler loss (mirror loss). When the waveguide propagation loss is set as 0.2 dB/cm, the waveguide loss is -10 dB. As to the coupler loss, as mentioned above, a 9:1 coupler has been taken as an example, this means when the light goes through the coupler, there is 90% light power goes back to the circle and 10% goes to the PD, as shown in Fig. 1.9. Namely, there is 10% light loss for each round trip due to the coupler, this 10% light corresponds to about -0.5 dB loss. Thus the whole system loss is about -10.5 dB. The gain was set as 10.2 dB (the noise has been estimated by the gain and the NF), the gain has been set a little lower than the whole system loss to prevent the oscillation in the system, thus here the gain has been set 0.3 dB lower than the whole system loss; and then the calculated ring-down number
23
difference is 0, which means a lower propagation loss is necessary. Then when the waveguide loss is set as 0.05 dB/cm, the system loss is about -3 dB, when the gain was set as 2.98 dB (a little lower than the system loss to prevent the oscillation as mentioned above), the ring-down number difference is 8, which indicates a detectable case. This means the maximum allowable waveguide propagation loss is between 0.05 dB/cm and 0.2 dB/cm.
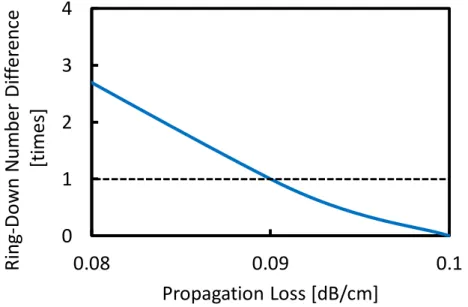
Based on the calculation above, the ring-down number difference as a function of the waveguide propagation loss is shown in Fig. 1.9. Figure 1.9 exhibits that when the waveguide propagation loss is 0.09 dB/cm, the amplifier gain was set as αG = 4.9 dB, then the ring-down number difference is 1 (ring-down number N = 74, M = 73), which indicates a detectable case. As is shown in the figure, the ring-down number exceeds 2 when the waveguide propagation loss becomes less than 0.09 dB/cm that corresponds to the maximum allowable waveguide propagation loss.
0 1 2 3 4
0.08 0.09 0.1
Ring-Down Number Difference [times]
Propagation Loss [dB/cm]
Fig. 1.9:Ring-down number difference as a function of waveguide propagation loss. (0.09 dB/cm corresponds to the maximum allowable waveguide propagation loss.)
24
1.7 Outline of this thesis
Breath sensing realizes painless (unlike, blood and other tests) health check system and breath-content has been detected by using infrared absorption spectroscopy, which requires relatively long optical path (meter-long). To realize a long optical path in a compact area for optical absorption sensing device, a gas-cell, utilizing an optical waveguide is attractive due to the possibility of long optical path integration in a limited area. High-mesa optical waveguide structure has been proposed for optical absorption sensing, as a certain portion of optical field profiles out of the waveguide that is utilized for optical absorption. One of the problems for high-mesa waveguide is its propagation loss since high propagation loss consumes light power which restricts sensing capability. To achieve low propagation loss, silica based high- mesa structure has been studied and low propagation loss of 0.02 dB/cm (@ w
= 2.3 μm, λ = 1550 nm) has been confirmed successfully. Further improvement of the proposed silica single high-mesa waveguide structure with a novel design theory of slot waveguide with quadruple high-mesa structure has also been discussed.
In this thesis, the research background and the purpose have been explained in Chapter 1. Breath content detection for easy medical health check-up has been proposed using infrared absorption sensing. Optical waveguide structure for infrared absorption sensing has been proposed and exploited.
The estimated required propagation loss criteria have been clarified as well.
25
In chapter 2, the propagation loss category has been discussed. The propagation loss can be generally attributed to three different mechanisms:
scattering losses, radiation losses and absorption losses. For further classification, the scattering losses can be divided into volume scattering and surface scattering; radiation losses can be divided into radiation towards the substrate and the radiation from the waveguide bent; absorption losses can be divided into interband absorption and intaband absorption. Some methods to get low propagation loss have also been discussed in this chapter as well.
In chapter 3, to realize lower propagation loss than SOI structure, silica high- mesa structure is proposed for infrared sensing. Setting under cladding height larger than 5 μm is proposed to suppress the radiation loss. As a result, an extremely low propagation loss of 0.02 dB/cm (@ w = 2.3 μm, λ = 1550 nm) has been achieved.
In chapter 4, the multiple-slot silica high-mesa waveguide structure is proposed. A high portion of 20.3% optical field profiles out of the waveguide has been achieved by quadruple silica high-mesa waveguide structure. Low scattering loss of 0.06 dB/cm has been confirmed theoretically as well.
In Chapter 5, the above results have been summarized and clarified about the future view of the proposed waveguide structure.
26
1.8 References
1. Population Division, Department of Economic and Social Affairs, United Nations; http://www.un.org/en/development/desa/population/
2. Treasury Board of Canada Secretariat; http://www.tbs-sct.gc.ca/reports- rapports/cp-rc/2010-2011/cp-rc04-eng.asp.
3. U.S Census Bureau, International Data Base, June 2011 update.
4. http://en.wikipedia.org/wiki/Blood_test.
5. http://en.wikipedia.org/wiki/Urinalysis.
6. H. D. Bennett, L. J. M. T. Tambeur, and W. B. Campbell, “Use of coughing test to diagnose peritonitis,” BMJ, Vol. 308, pp. 1336, 2004.
7. Squire LF, Novel line RA: Squire's fundamentals of radiology (5th ed.), Harvard University Press, 1997.
8. P. S. Douglas, M. J. Garcia, D. E. Haines, W. W. Lai, W. J. Manning, A. R.
Patel, M. H. Picard, D. M. Polk, “Appropriate Use Criteria for Echocardiography,” Journal of the American College of Cardiology, Vol.
57, No. 9, pp. 1126-1166, 2011.
9. N. Marczin, S. A. Kharitonov, Sir. M. H. Yacoub, and P. J. Barnes, Disease Markers in Exhaled Breath, Chap. 1. New York, USA: Marcel Dekker Inc.
2003.
10.http://en.wikipedia.org/wiki/Urea_breath_test 11. http://en.wikipedia.org/wiki/Scintillation
12. http://en.wikipedia.org/wiki/Isotope_ratio_mass_spectroscopy 13.http://en.wikipedia.org/wiki/ Mass_correlation_spectrometry
27
14. M. Murtz, “Breath Diagnostics Using Laser Spectroscopy,” Optics and Photonics News, Vol. 16, No. 1, pp. 30-35, 2005.
15. G. V. Basum, H. Dahnke, D. Halmer, P. Hering, and M. Murtz, “Online recording of ethane traces in human breath via infrared laser spectroscopy”, J. Appl. Physicol., Vol. 95, No. 6, pp. 2583-2590, 2003.
16. P. C. Kamat, C. B. Roller, K. Namjou, J. D. Jeffers, A. Faramarzalian, R.
Salas, and P. J. MacCann, “Measurement of acetaldehyde in exhaled breath using a laser absorption spectrometer”, Applied Optics, Vol. 46, No. 19, pp. 3969-3975, 2007.
17. A. O. Wright and M. B. Frish, “Remote Detection of Breath CO2 with Tuneable Diode Laser Absorption Spectroscopy”, OSA (2007).
18. C. Wang and A. B. Surampudi, “An Acetone Breath Analyzer Using Cavity Ring Down Spectroscopy: an Initial Test with Human Subjects under Various Situation,” Meas. Sci. Technol., Vol. 19, No. 10, pp. 105604, 2008.
19. K. R. Parameshwaran, D. I. Rosen, M. G. Allen, and Terence H. Risby,
“Off-axis Integrated Cavity Output Spectroscopy with a Mid-infrared Interband Cascade Laser for Real-time Breath Ethane Measurement,”
Appl. Optics., Vol. 48, No. 4, pp. B73-B79, 2009.
20. Tiger optics: http://www.tigeroptics.com/app/tigeroptics/products/.
21. Ekips Technology: http://www.ekipstech.com/.
22. Picarro: http://www.picarro.com/gasesmeasured/.
23. T. H. Risby, and S. F. Solga, “Current status of clinical breath analysis”, Appl. Phy. B: Lasers and Optics, Springer Berlin/Heidelberg, Vol. 85, No.
2-3, pp. 421-426, Nov. 2006.
28
24. Y. Naito, “Feature Articles about Imaging Mass Spectrometry”, J. Mass Spectrom. Soc. Jpn., Vol. 55, No. 1, pp. 15, 2007.
25. P. Cermak, T. Foldes, J. Kristof, J. Rakovsky, Z. Grolmusova, P. Veis, and P.
Macko, “High Resolution and High Sensitivity Cavity Ring-Down Spectroscopy”, Contributed Papers of the 5th Seminar in New Trends in Plasma Physics and Solid State Physics, pp. 11-17, 2010.
26. HITRAN Database: http://www.cfa.harvard.edu/hitran/.
27. NIST Chemistry WebBook:http://webbook.nist.gov./chemistry/.
28. J. Workman, Jr “Handbook of organic compounds: NIR, IR, Raman, and UV-Vis spectra featuring polymers and surfactants” San Diego: Academic Press, 2001.
29. Otsuka Electronics Co. Ltd.: http://www.photal.co.jp.
30. Anima: www.anima.jp/product/koki/.
31. HORIBA, Ltd.: http://www.jp.horiba.com/products/proenv/.
32. A. Yalcin, K. C. Popat, J. C. Aldridge, T. A. Desai, J. Hryniewicz, N. Chbouki, B. E. Little, O. King, V. Van, S. Chu, D. Gill, M. Anthes Washburn, M. S.
Unlu, and B. B. Goldberg, “Optical sensing of bio-molecules using micro- ring resonators,” IEEE J. Sel. Topics of Quantum Electron., Vol. 12, No. 1, pp. 148-154, Jan. 2006.
33. A. Densmore, D.-X. Xu, P. Waldron, S. Janz, P. Cheben, J. Lapointe, A.
Delâge, B. Lamontagne, J. H. Schmid, and E. Post, “A Silicon-on-insulator photonic wire based evanescent field sensor,” IEEE Photon. Technol.
Lett., Vol. 18, No. 23, pp. 2520-2522, Dec. 2006.
29
34. B. E. A. Saleh and M. C. Teich, Fundamental of Photonics, Chap. 8, 2nd edition. New York, USA: John Wiley & Sons, 2007.
35. B. J. Luff, R. D. Harris, J. S. Wilkinson, R. Wilson, and D. J. Schiffrin,
“Integrated-optical directional coupler biosensor,” Optics Lett., Vol. 21, No. 8, pp. 618-620, Apr.1996.
36. F. Prieto, B. Sepulveda, A. Calle, A. Llobera, C. Domynguez, A. Abad, A.
Montoya, and L M Lechuga, “An integrated optical interferometric nanodevice based on silicon technology for biosensor applications,”
Nanotechnology, Vol. 14, No. 8, pp. 907-912, Aug. 2003.
37. W. C. L. Hopman, P. Pottier, D. Yudistira, J. van Lith, P. V. Lambeck, R. M.
De La Rue, and A. Driessen, “Quasi-One-Dimensional Photonic Crystal as Compact Building-Block for Refractometric Optical Sensors,” IEEE J. Sel.
Topics of Quantum Electron., Vol. 11, No. 1, pp. 11-16, Jan. 2005.
38. C. Y. Chao, W. Fung, and L. J. Guo, “Polymer Microring Resonators for Biochemical Sensing Applications,” IEEE J. Sel. Topics Quantum Electron., Vol. 12, No. 1, pp. 134-142, Jan. 2006.
39. M. Kozuka, T. Minamide, H. Saito, H. Kudo, K. Otsuka, M. Takao, and K.
Mitsubayashi, “An Optical Halitosis (Bad Breath) Sensor with MAO-A,”
IEEE SENSORS 2006, EXCO, Daegu, Korea, October 22-25, 2006.
40. B. Schmidt, V. Almeida, C. Manolatou, S. Preble, and M, Lipson,
“Nanocavity in a silicon waveguide for ultrasensitive nano-particle detection,” Appl. Physc. Lett., Vol. 85, No. 21, pp. 4855, 2004.
41. M. A. Vincenti, M. De Sario, V. Petruzzelli, A. D’Orazio, F. Prudenzano, D.
de Cegliab, and M. Scalora, “Fabry-Perot microcavity sensor for H2-
30
breath-test analysis,” J. of Appl. Physc., Vol. 102, No. 7, pp. 074501, 2007.
42. F. J. Arregui, I. R. Matías and R. O. Claus, “Optical Fiber Gas Sensors Based on Hydrophobic Alumina Thin Films Formed by the Electrostatic Self-Assembly Monolayer Process,” J. of IEEE Sensors, Vol. 3, No. 1, pp.
56-61, 2003.
43. C. A. Barrios, K. B. Gylfason, B. Sánchez, A. Griol, H. Sohlström, M.
Holgado, and R. Casquel, “Slot-waveguide biochemical sensor,” Opt.
Lett., Vol. 32, No. 21, pp. 3080-3082, 2007.
44. S. Yano, K. Kameyama, and K. Hamamoto, “Low loss SOI-based high- mesa waveguides fabricated using neutral loop discharge (NLD) plasma etching for compact breath-sensing system”, Con. Proc. Integrated Photonics and Nanophotonics Research and Applications, IWA7, 2007, Salt Lake, USA.
45. T. Alasaarela, D. Korn, L. Alloatti, A. Saynatjoki, A. Tervonen, R. Palmer, J.
Leuthold, W. Freude, and S. Honkanen, “Reduced propagation loss in silicon strip and slot waveguides coated by atomic layer deposition”, Opt.
Express, Vol. 19, No. 12, pp. 11529-11538, 2011.
46. R. Ding, T. Baehr-Jones, W. J. Kim, X. Xiong, R. Bojko, J. M. Fedeli, M.
Fournier, and Michael Hochberg, “Low-loss strip-loaded slot waveguides in Silicon-on-Insulator”, Opt. Express, Vol. 18, No. 24, pp. 25061-25067, 2010.
47. R. Ding, T. Baehr-Jones, W. J. Kim, B. Boyko, R. Bojko, A. Spott, A.
Pomerene, C. Hill, W. Reinhardt, and M. Hochberg, “Low-loss
31
asymmetric strip-loaded slot waveguides in silicon-on-insulator”, Appl.
Phys. Lett., Vol. 98, No. 23, pp. 233303, 2011.
48. J. T. Robinson,L. Chen, and M. Lipson, “On-chip gas detection in silicon optical microcavities”, Opt. Express, Vol. 16, No. 6, pp. 4296-4301, 2008.
49. W. C. Lai, S. Chakravarty, X. Wang, C. Lin, and R. T. Chen, “On-chip methane sensing by near-IR absorption signatures in a photonic crystal slot waveguide”, Opt. Lett., Vol. 36, No. 6, pp. 984-986, 2011.
50. Y. Zhou, C. Karagodsky, B. Pesala, F. G. Sedgwick, and C. J. Chang- Hasnain, “A novel ultra-low loss hollow-core waveguide using subwavelength high-contrast gratings”, Opt. Express, Vol. 17, No. 3, pp.
1508-1517, 2009.
51. R. Bicknell, L. King, C. E. Otis, J. S. Yeo, N. Meyer, P. Kornilovitch, S.
Lerner, and L. Seals, “Fabrication and characterization of hollow metal waveguides for optical interconnect applications”, Appl. Phys. A, Vol. 95, No. 4, pp. 1059-1066, 2009.
52. C. Shi, C. Lu, C. Gu, L. Tian, R. Newhouse, S. Chen, and J. Z. Zhang, “Inner wall coated hollow core waveguide sensor based on double substrate surface enhanced Raman scattering”, Appl. Phys. Lett., Vol. 93, No. 15, pp. 153101-3, 2008.
53. A. Wilk, F. Seichter, S. Kim, E. Tutuncu, B. Mizaikoff, J. A. Vogt, U.
Wachter, and P. Radermacher, “Toward the quantification of the
13CO2/12CO2 ratio in exhaled mouse breath with mid-infrared hollow waveguide gas sensors”, Anal. Bioanal. Chem., Vol. 402, No. 1, pp. 397- 404, 2012.